Evaluation of Phenotypic Stability of Resistance to
Phytophthora
spp. in Cacao Clones
Luiz Roberto M. Pinto1, Stela Dalva V.M. Silva2 & Milton M. Yamada3
1Departamento de Ciências Exatas e Tecnológicas, Universidade Estadual de Santa Cruz, CEP 45662-000, Ilhéus, BA,
Brazil, e-mail: [email protected];2Seção de Fitopatologia; 3Seção de Genética, Centro de Pesquisas do Cacau,
Comissão Executiva do Plano da Lavoura Cacaueira, Cx. Postal 07, CEP 45.600-970, Itabuna, BA, Brazil. Author for correspondence: Luiz Roberto Martins Pinto
PINTO, L.R.M., SILVA, S.D.V.M. & �AMADA, M.M. Evaluation of phenotypic stability of resistance to Phytophthora spp. in cacao clones. Fitopatologia Brasileira 32:453-457. 2007
ABSTRACT
Resistance of fourteen Theobroma cacao clones to Phytophthora spp. was evaluated using stem inoculations on grafted seedlings. Concepts of phenotypic stability were used to interpret the results and to express horizontality of the resistance. The linear regression coefficient ‘b’, the determination coefficient (R2) and average lesion size were used to determine the level of horizontal resistance, the phenotypic stability and the predictability of all clones. The results indicated that clones P 7 and MA 15 present highest levels of horizontal resistance and stability, but with moderate predictability. Clones CAS 1 and CEPEC 13 were classified as those with high horizontal resistance, stability and predictability, while clones PA 30, UF 650 and SIAL 88 and EET 59 showed intermediate resistance and stability and high predictability. Clones SPA 17, OC 61, PA 150, SIAL 505, ICS 1 and R 41 presented high susceptibility and intermediate or low stability and moderate or high predictability.
Additional keywords: Theobroma cacao, genotypes, black pod disease.
RESUMO
Avaliação da estabilidade fenotípica da resistência a Phytophthora spp. em clones de cacaueiro
A resistência de quatorze clones de Theobroma cacao a Phytophthora spp. foi avaliada utilizando inoculações em hastes de mudas enxertadas de cacau. Utilizaram-se os conceitos de estabilidade fenotípica para interpretar os resultados e expressar a horizontalidade da resistência. O coeficiente ‘b’ da regressão linear, o coeficiente de determinação (R2) e a média das lesões foram utilizadas para determinar o nível de resistência horizontal, a estabilidade fenotípica e a previsibilidade de comportamento dos clones. Os resultados indicaram que os clones P 7 e MA 15 apresentaram os níveis mais altos de resistência e estabilidade, porém com previsibilidade moderada. Os clones CAS 1 e CEPEC 13 foram classificados como de alta resistência horizontal, estabilidade e previsibilidade enquanto que os clones PA 30, UF 650, SIAL 88 e EET 59 apresentaram resistência intermediária e alta previsibilidade. Os clones SPA 17, OC 61, PA 150, SIAL 505, ICS 1 e R 41 apresentaram altas suscetibilidades associadas à estabilidade baixa ou intermediária e previsibilidade moderada ou alta.
Palavras-chave adicionais: Theobroma cacao, genótipos, podridão parda.
INTRODUCTION
Black pod disease, caused by Phytophthora spp., is one of the most serious diseases of cacao worldwide. In Bahia, crop losses of 70-80% were reported in highly affected areas under disease-favorable conditions where chemical control was not conveniently applied (Luz & Silva, 2001). High chemical control costs, the occurrence of heavy rains in the cacao producing areas or variations in rainfall frequency and intensity from one region to another have highlighted the need to investigate more effective measures for disease control, such as the search for resistant genotypes in the cacao plantations.
Primary research into resistance to black pod disease only considered the species Phytophthora palmivora (E.J. Butler) E.J. Butler. Since 1976, the taxonomy of
Phytophthora on cacao has widely changed, and now at least two other species are recognized as the causal agent of
the disease in Brazil, P. capsici Leonian and P. citrophthora (R.E. Sm. & E.H. Sm.) Leonian (Campêlo & Luz, 1981).
Most phenotypic stability studies on cacao have been
based on yield (Jolly & De Verteuil, 1960; Cruickshank &
Murray, 1967; Martin & Lockwood, 1979; Cilas et al., 1985;
Mariano et al., 1988; Pinto et al., 1993). Prabhu & Morais (1993) suggested the use of theories proposed by �ates & Cochran (1938) and Plaisted & Peterson (1959) to evaluate disease resistance in plants.
Several authors have used the concepts of phenotypic stability to express horizontal resistance (Nayak & Chakrabarti, 1986). On cacao, these concepts for studying horizontal resistance to Phytophthora spp. have already
been applied (Pinto & Silva, 1987; Pinto et al., 1987;
Clones Isolates CAS 1 CEPEC 13 EET 59 ICS 1 MA 15 OC 61
P 7 PA 150
PA 30 R 41 SIAL 505
SIAL 88
SPA 17
UF 650 Mean
23 0,9
aA
1,26 aA 1,16
aA 1,01 aA 1,37 aA 0,92 aA 0,95 aA 1,21 aA
1,15 aA 1,57 aA 1,39 aA 1,25 aA 1,34
aA
0,98 aA 1,17 a
62 4,05
aA
4,15 aB 4,28
abAB 6,8 bA 3,9 aA 6,75 bA 3,5 aA 7,25 bA 4,8 abAB 12,18 cA
9,16 bA 5,56 bA 3,84
aAB 6,15 bAB 5,88 b 26 4,72 aABC 5,16 aABC 9,3 bCD 11,1 cD 2,72 aAB 8,75 bCD 2,11 aA 8,02 bBCD 7,7 bABCD 7,31 bABCD 6,55 bABCD 7,88 bABCD 11,11 bD 6,62 bABCD 7,07 b Mean 3,22 AB
3,52 AB 4,91
ABC 6,3 BC 2,66 A 5,47 ABC 2,18 A 5,49 ABC 4,55 ABC
7,02 C 5,7 BC 4,9
ABC 5,43 ABC 4,58 ABC 4,71 TABLE 1 - Means of lesion size (cm2) on cocoa stem progenies inoculated with three isolates of Phytophthora
Mean number with different lower-case (column) or upper-case (row) differ from one another by Tukey’s test at 5%. MATERIAL AND METHODS
The clones used in this experiment were: CAS 1, CEPEC 13, EET 59, ICS 1, MA 15, OC 61, P 7, PA 30, PA 150, R 41, SIAL 88, SIAL 505, SPA17 and UF 650. These genotypes were grafted on seven-month-old Catongo cultivar and the inoculations were done eight months later. Three isolates of the species of Phytophthora were used for inoculation. Isolates 23, 26 and 62, from P.capsici, P.
palmivora and P. citrophthora, respectively, were obtained from the Cocoa Research Center (CEPEC-CEPLAC) collection (Campêlo & Luz, 1981, Campêlo et al., 1982). They were cultivated on a carrot-agar medium for ten days at a temperature of 27 °C and under constant light (40 watts). Stem inoculations were carried out by making small vertical cuts with a scalpel and inserting three-millimeter diameter discs collected from ten-day-old cultures of Phytophthora spp. as proposed by Lawrence, 1978. These cuts were duly bound with adhesive tape and the bark was removed 18 days later when the area of lesion was determined.
The experiment was established in a randomized block design with 42 treatments in a factorial scheme, where the two factors are represented by the 14 clones and the three Phytophthora isolates, using four replications and 10 plants per plot. The lesion areas were submitted to analysis of variance according to the model, where the clone effects
were considered as fixed, and isolate effects as random. Both
isolates and interactions clone vs. isolate sum of squares were partitioned to measure the effect of isolates within clones. This enabled us to compare different isolates of
Phytophthora within each clone and also to quantify how much of this variance is explained by linear regression or random effects as well.
The methodologies proposed by Finlay & Wilkinson (1963) and Eberhart & Russel (1966) were used to determine the phenotypic stability and the predictability of clone performance in relation to horizontal resistance. The statistical model adopted was: �jk = Uj+BjIk+ Djk where: �jk = the observed mean size of lesion of the j clone for the isolate
k; Uj = the j clone mean size of lesion over all isolates; Bj
= the coefficient of regression that measures the functional
relationship between jth clones and the ith isolates; Ik = the
environmental indexes; and Djk= the regression deviation
effects of clone j for isolate k.
Clonal characterization was based on the following
three parameters: 1) average lesion size; 2) coefficient of linear regression related to environmental indexes; and
3). regression deviations, expressed in terms of R2. The genotypes were classified in regard to horizontality of the
resistance according to the following parameters: 1) the mean size of lesion - according to this, the genotypes were separated into three categories:i) susceptible - the ones with
the largest mean values in the experiment; ii) moderately resistant - the ones with intermediate mean values; and
iii)) highly resistant - those with lowest mean values in
the experiment; 2) the ‘b’ coefficients of linear regression - the magnitude of b coefficients was used to identify
genotypes in respect to the stability of horizontal resistance and separate them into three categories: i) Stable - the ones
with b values lower than the unit; ii) Moderately stable - those with b values near to the unit; and iii) Unstable - the genotypes with b coefficients greater than the unit and 3)
The coefficient of determination (R2). Stable and predictable
genotypes with a high level of horizontal resistance were those that presented the following characteristics: smaller
lesion sizes, b coefficients lower than the unit or about zero
and high R2 coefficients.
RESULTS AND DISCUSSION
The mean values for the lesion size on different clones according to each isolate are presented in Table 1. The lesion size values were observed to be higher for P.
Source of variation Degree Freedom Mean Square
Replication 3 17.72 *
Clone 13 22.95 **
Isolate 2 545.20 **
Clone x Isolate 26 15.29 **
(Isolate/Clone) (28) 53.14 **
Isolate/CAS 1 (2) 16.69 ns
Linear effect 1 33.36 *
Regression Deviation 1 0.02 ns
Isolate/CEPEC 13 (2) 16.44 ns
Linear effect 1 32.76 *
Regression Deviation 1 0.12 ns
Isolate/EET 59 (2) 67.38 **
Linear effect 1 107.64 **
Regression Deviation 1 27.12 *
Isolate/ICS 1 (2) 102.54 **
Linear effect 1 192.88 **
Regression Deviation 1 12.20 ns
Isolate/MA 15 (2) 6.44 ns
Linear effect 1 7.80 ns
Regression Deviation 1 5.08 ns
Isolate/OC 61 (2) 66.22 **
Linear effect 1 132.04 **
Regression Deviation 1 0.40 ns
Isolate/PA 150 (2) 55.66 **
Linear effect 1 110.44 **
Regression Deviation 1 0.88 ns
Isolate/PA 30 (2) 43.02 **
Linear effect 1 80.16 **
Regression Deviation 1 5.88 ns
Isolate/P 7 (2) 6.52 ns
Linear effect 1 6.76 ns
Regression Deviation 1 6.28 ns
Isolate/R 41 (2) 112.88 **
Linear effect 1 139.08 **
Regression Deviation 1 86.68 **
Isolate/SIAL 505 (2) 62.62 **
Linear effect 1 93.44 **
Regression Deviation 1 31.80 *
Isolate/SIAL 88 (2) 45.26 **
Linear effect 1 88.24 **
Regression Deviation 1 2.28 ns
Isolate/SPA 17 (2) 103.12 **
Linear effect 1 139.36 **
Regression Deviation 1 66.88 **
Isolate/UF 650 (2) 39.14 **
Linear effect 1 77.24 **
Regression Deviation 1 1.04 ns
Residual 123 5.71
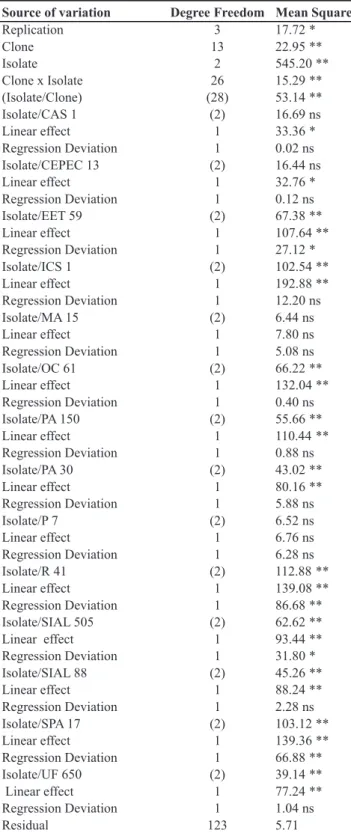
TABLE 2 - Analysis of variance of lesion size (cm2) on stem of grafted cacao, caused by three Phytophtora spp. isolates
*, ** and ns = respectively significative p <0,05, p <0,01 and non-significative
citrophthora were larger than those caused by P. palmivora,
but the differences were not statistically significant.
Differences were also observed for the lesion sizes caused by P. citrophthora and P. capsici. The analysis of variance
indicated significant differences for clones and isolates at
the level of 1% (Table 2). This means that clones differ in relation to resistance, and isolates differ in aggressiveness.
The interaction clones vs. isolates was also significant
at the level of 1% by the F test, indicating that clones present different behavior according to isolate type. The partitioning of the interaction sum square and subsequent F test shows that clones manifest a different performance from isolates. Clones CAS 1, CEPEC 13, MA 15, and P 7 presented uniform reactions to the three isolates, but the other clones did not.
When evaluating the genetic potential of clones it is very important to consider also the horizontal resistance. Since cacao is a perennial crop, it is frequently submitted to different strains of a given pathogen in several environments. Thus, the phenotypic stability of plants was used as a parameter to characterize horizontality of resistance in relation to species of Phytophthora (Van der Plank, 1963).
The significance of linear effects can be attributed either to
differential responses of clones to pathogen isolates or the variation in aggressiveness among isolates, or even to the interactions that form vertical resistance (Table 2) (Van der Plank, 1963).
Occasionally the regression deviation effects
were significant and, consequently, small coefficients of
determination (R2) were observed indicating that these linear
models were not good enough to explain the total variation
in resistance. The regression coefficient estimates ‘b’ are presented in Table 3. The average b coefficient is equal to
the unit. Every clone that presents b value greater than 1, responds to increasing indexes of environment. The smallest b values were observed for P7 and MA 15 clones and they
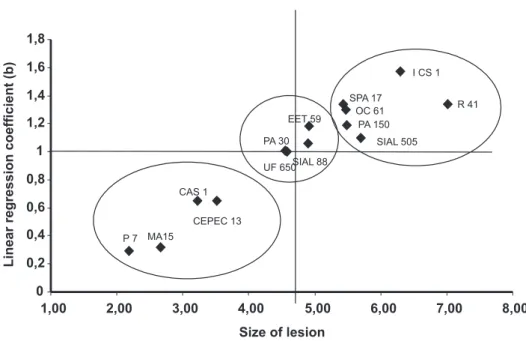
were not significant. These clones also presented the smallest lesion sizes and can be classified as the ones with a high level
of stable horizontal resistance and moderate predictability (low R2) (Table 3; Figure 1).
Clones CAS 1 and CEPEC 13 also showed some stable horizontal resistance and high predictability (R2= 99.93 and
99.62, respectively). These four clones can be regarded as the most promising ones and should be included in breeding programs. Clones PA 30, UF 650, SIAL 88 and EET 59 manifested stable and intermediate horizontal resistance and high predictability (Figure 1). The remaining clones (SPA 17, OC 61, PA 150, SIAL 505, ICS 1 and R 41) performed as highly susceptible and unstable, but some of these, such as ICS 1, PA 150 and SIAL 550, presented other interesting agronomic traits that also justify their inclusion in breeding programs, since their resistance can be improved.
Previous studies carried out at CEPEC-CEPLAC showed some similarities in performance for clone MA 15, but not for CAS 1, which presented lower values for lesion size and more stability (Pinto et al., 1995). The explanation for
these conflicting results relies on the type of genetic material
TABLE 3 - Estimates of horizontal resistance parameters and general classification
Where: H = High, L = Low, I = Intermediate S = Stable, MS = Moderately Stable, UN = Unstable P = Predictable, MP = Moderately Predictable
0 0,2 0,4 0,6 0,8 1 1,2 1,4 1,6 1,8
1,00 2,00 3,00 4,00 5,00 6,00 7,00 8,00
P 7 MA15 CAS 1
CEPEC 13
SIAL 88 EET 59
UF 650 PA 30
SPA 17
I CS 1
R 41 PA 150
SIAL 505 OC 61
Linear regression coefficient (b)
Size of lesion
FIG. 1 - Size of lesion and linear regression coefficient ‘b’ for all tested clones.
resistance seemed to be different in the progenies of CAS 1 and MA 15. Later on, another set of 82 cacao clones was evaluated for resistance to the same Phytophthora isolates (isolates 23, 26 and 62) using inoculation on unripe attached pods, without wounding (Luz et al., 1996). Two scales for classifying clones were used, according to the lesion sizes (1
to 4) and percentage of infected pods (0 to 3). Clones PA 30 and PA 150 presented the lowest scores for lesion size and infected pods, but PA 150 presented the largest lesions on the stems. Luz et al. (1996) have already made comments on inconsistency of results. An agreement was observed in relation to both CEPEC 13, which manifested a good
Clone b R
2
% Mean Classification/HR
P 7 0.29 0.28 51.77 2.18 H/S/MP
MA 15 0.32 0.26 60.65 2.66 H/S/MP
CAS 1 0.65 0.02 99.93 3.22 H/S/P
CEPEC 13 0.65 0.04 99.62 3.52 H/S/P
PA 30 1.01 0.28 93.14 4.55 I/MS/P
UF 650 1.00 0.12 98.66 4.58 I/MS/P
MEAN 1.00 - 4.71
-SIAL 88 1.06 0.17 97.46 4.90 I/MS/P
EET 59 1.18 0.59 79.87 4.91 I/MS/P
SPA 17 1.34 0.93 67.57 5.43 L/UN/MP
OC 61 1.30 0.07 99.69 5.47 L/UN/P
PA 150 1.19 0.11 99.22 5.49 L/UN/P
SIAL 505 1.10 0.64 74.61 5.70 L/MS/MP
ICS 1 1.57 0.40 94.05 6.30 L/UN/P
R 41 1.34 1.05 61.61 7.02 L/UN/MP
+
-+
-+
-+
-+
-+
-+
-+
-+
-+
-+
-+
-+
-REFERENCES
CAMPÊLO, A.M.F.L. & LUZ, E.D.M.N. Etiologia da podridão-parda do cacaueiro nos Estados da Bahia e Espírito Santo. Fitopatologia Brasileira 6:313-321. 1981.
CAMPÊLO, A.M.F.L., LUZ, E.D.M.N. & RESNI�, F.C.Z. Podridão-parda do cacaueiro no Estado da Bahia, Brasil. 1- Virulência das espécies de Phytophthora. Revista Theobroma 12:1-6. 1982.
CILAS, C., AMEFIA, �.�., LEGRAND, B. & PELISSOU, H. Étude de la stabilité du caractère de productivité chez le cacaoyer: premières contatations et perspective de sélection. Café, Cacao,Café, Cacao, Thé 19:89-94. 1985.
CRUIC�SHAN�, A.M. & MURRA�, D.B. Clonal trials, Grenada. In: St Augustine. ICTA. Annual Report on Cacao Research 1966. 23-25. 1967.
EBERHART, S.A. & RUSSEL, W.A. Stability parameters for comparing varieties. Crop Science 6:36-40. 1966.
FINLA�, �.W. & WIL�INSON, G.N. The analysis of adaptation in a plant breeding programme. Australian Journal of Agricultural Research 14:742-754. 1963.
JOLL�, A.L. & DE VERTEUIL, L.L. Clonal and fertiliser experiments in Trinidad and Tobago. In: Proceedings, Inter-American Cacao Conference, 8, Port of Spain, 1960. Trinidad and Tobago. 1960. pp. 390-418.
LAWRENCE, J.S. Evaluation of methods for assessing resistance of cacao Theobroma cacao L. cultivars and hybrids to Phytophthora palmivora (Butler) Butler. Ilhéus, BA, Brasil. CEPLAC/CEPEC.Ilhéus, BA, Brasil. CEPLAC/CEPEC. Boletim Técnico no 2. 1978.
LUZ, E.D.M.N. & CAMPÊLO, A.M.F.L. Temperatura, fator preponderante no equilíbrio populacional das espécies de Phytophthora que causam podridão- parda do cacaueiro na Bahia, Brasil. Revista Theobroma 13:361-375. 1983.
LUZ, E.D.M.N., SILVA, S.D.V.M., �AMADA, M.M., LOPES, U.V., BRAGA, M.C.T. & BRUGNEROTTO, M.I.B. Selection of cacao genotypes resistant to Phytophthora capsici, P. palmivora and P. citrophthora in Bahia. Fitopatologia Brasileira 21:71-79. 1996.
LUZ, E.D.M.N. & SILVA, S.D.V.M. Podridão-parda dos frutos, cancro e outras doenças causadas por Phytophthorano cacaueiro. In: Luz, E.D.M.N., Santos, A.F., Matsuoka, �. & Bezerra, J.L. (Eds.) Doenças causadas por Phytophthora no Brasil. Campinas SP. Livraria Rural. 2001. pp. 175-265.
MARIANO, A.H., �AMADA, M.M. & PEREIRA, M.G. Comportamento de híbridos de cacau sob distintas condições de clima e solo. In: Actas, Conferencia Internacional de Investigación en Cacao, 10, Santo Domingo, 1987. Lagos, Cocoa Producers’Lagos, Cocoa Producers’ Alliance. 1988. pp. 627-633.
MARTIN, �.J. & LOC�WOOD, G. Edge effects and interactions with environment in cocoa. Experimental Agriculture 15:225-239. 1979.
NA�A�, P. & CHA�RABARTI, N.�. Stable resistance to bacterial blight disease in rice. Annual Applied Biology 109:179-186. 1986.
PLAISTED, R.L. & PETERSON, C.C. 1959. A technique for evaluating the ability of selections to yield consistently in different locations and seasons. American Potato Journal 36:381-385. 1959.American Potato Journal 36:381-385. 1959.
PINTO, L.R.M. & SILVA, S.D.V.M. Estabilidade de comportamento da resistência horizontal das plantas aos patógenos. Fitopatologia Brasileira 12:133. 1987.
PINTO, L.R.M., SILVA, S.D.V.M. & �AMADA, M.M. Avaliação de progenitores de híbridos de cacaueiro quanto à resistência a Phytophthora spp. por inoculação em plântulas. Fitopatologia Brasileira 12:132. 1987.
PINTO, L.R.M., LOPES, U.V., MONTEIRO, W.R. & PEREIRA, M.G. Adaptabilidade e estabilidade de cultivares de cacaueiro. Agrotrópica 5:53-63. 1993.
PINTO, L.R.M., SILVA, S.D.V.M. & �AMADA, M.M. Estabilidade fenotípica e previsibilidade da resistência de cacaueiro a Phytophthora spp. Fitopatologia Brasileira 20:416-421. 1995.
PRABHU, A.S. & MORAIS, O.P. Resistência estável às doenças de plantas. Revisão Anual de Patologia de Plantas 1:239-273. 1993.
VAN DER PLAN�, J.E. Plant diseases: Epidemics and Control. New �ork N�. Academic Press. 1963.
�ATES, F. & COCHRAN, W.G. The analysis of groups of experiments. Journal Agriculture Science 28:556-580. 1938.
Received 18 May 2007 - Accepted 18 December 2007 – FB 7056 resistance level in this work, and also to R 41, which showed