The Addition of Aluminum Nanoparticles to Polypropylene
Increases Its Thermal Stability
Javier Arranz-Andrés
a,*, Félix A. López
b, Rosario Benavente
a aInstituto de Ciencia y Tecnología de Polímeros (ICTP-CSIC), Juan de la Cierva 3, 28006 Madrid, Spain. b
Centro Nacional de Investigaciones Metalúrgicas (CENIM-CSIC), Avda. Gregorio Amo 8, Madrid 28040, Spain.
ABSTRACT
This work reports the therma l degradation kinetics of isotactic polypropylene (iPP) and iPP with incorporated Al nanoparticles. The Fried man, Flynn-Wall–Oza wa (FWO), ASTM E698 and Coats -Redfern methods were used to calculate the activation energy of the samples fro m thermogravimetric data. The thermal stability of the iPP was improved by the introduction of the nanoparticles: the ma ximu m dec omposition te mperature of the nanocomposite increased from 453 ºC to 457 ºC and the activation energy from 226 kJ/ mol to 244 kJ/ mol. The thermal degradation models of iPP can be described by “Contracting Sphere” model, whereas that to nanocomposite by Rn (n= 4.8) model (phase boundary reaction).
Keywords:
Polypropylene-Aluminum nanocomposites; Therma l degradation; Kinetics; Reaction modelI.
INTRODUCTION
Polypropylene (PP) is one of the most important commodity poly me rs. Its attractive physical and mechanical properties, low price, light weight, and the ease with which it can be processed, have led to its use in different sectors of industry. It is commonly e mployed in the manufacture of film, fibers and the matrix of polymer co mposites, but the incorporation of specific fille rs allows it to be used in the production of many other products.
Poly mer–meta l composites are an interesting class of materia ls that combine the electrica l characteristics of metals and the mechanica l properties of poly me rs. They can als o be processed following methods typically used for polymers [1]. Currently, there is much interest in the use of metal nanoparticles as advanced additives in the functionalization of p lastics, and considerable research efforts are being made in this area [2-6]. Poly me r nanocomposites have better physical and mechanica l properties than conventional composites based on a polymer matrix with micro-sized fillers. Products made fro m the m include high-energy radiat ion shielding, micro wave absorbers, optical limiters, polarizers, sensors, and hydrogen storage systems. In addition to their intrinsic nanoscopic properties, these materia ls are of interest since changes in the filler-matrix interface area a lters their glass transition temperature, crystallinity, free volume content and therma l stability, allowing materia ls to be produced that may have novel applications. Increasing the temperature during the processing stage to compensate for the increase in viscosity produced
by the incorporation of the fille rs may, however, change the therma l degradation characteristics of the material.
The therma l behavior of a poly mer can be adjusted to meet required specifications if its therma l degradation kinetics are known. Pyro lysis is the standard technique used to study the thermal behavior of polymers, and much interest has been shown in discovering more about the thermal degradation of PP [7-12] and its nanocomposites. Thermogravimetric analysis (TGA) can be used to obtain the associated apparent activation energy (Ea) and kinetic model of decomposition [7, 11, 13]. Va riab les such as the pre-exponential factor (A), reaction order, and the Ea can be calculated fro m the TGA curve.
Several studies have exa mined the degradation features of polymer nanocomposites [14-18] but only a fe w have dealt with the thermal degradation kinetics of PP nanocomposites that incorporate metal partic les [19, 20]. The present work e xa mines the thermal stability of pure PP and PP/Al nanocomposites in an N2 at mosphere using TGA. The Fried man, Flynn-Wall–Oza wa (FW O), ASTM E698 and Coats-Redfern methods were used to calculate the Ea of the samples fro m the TGA data.
II.
MATERIALS AND METHODS
2.1. Materials
The polymeric mat rix used in the present work was a comme rcia lly available , metallocene-catalyzed, isotactic PP (iPP; Metocene HM562P: me lt flow inde x 15 g/10 min, ISO 1133), kindly supplied by LyondellBasell. The Al nanoparticles
(average dia meter 18 n m) we re purchased from IOLITEC.
2.2. (Na no)composite film preparation
A PP composite with an Al nanoparticle content of 5% (by volu me) (PPA l5) was prepared via me lt processing (165 ºC, 120 rp m for 40 min ) in a Haake Min ilab (Thermo Electron Co rporation) twin-screw e xt ruder (capacity 7 cm3) with co-rotating conical screws. After extrusion of the nanocomposite, a 250 m-thic k film was prepared by its compression in a Collin press (190 ºC, 10 MPa, 6 min). The film was then rapidly cooled (80 ºC min-1) by the press' cooling plates. The same procedure used to produce iPP without Al nanoparticles as a control.
2.3. Scanning electron microscopy (SEM)
Sa mples of the iPP and PPAl5 films were cryofractured and observations made using an XL30 ESEM PHILIPS scanning electron microscope (SEM).
2.4. Thermogravimetric analysis
The therma l stability measurements of the samples was exa mined by TGA using a TA Q500 thermogravimet ric analyze r over the te mperature range 20–800 ºC in an N2 atmosphere. Kinetic analyses were performed using heating ramps of 2, 5, 10, 20 and 30 ºC/ min. Continuous recordings of sample te mperature, samp le weight and heat flow were recorded.
III.
THEORY/CALCULATION
3.1. Mathematical models for determining thermal kinetics
In polyme r deco mposition it is generally assumed that the degree of conversion is proportional to the concentration (wt%) of the reacted mater ia l [21]. The degree of conversion can be expressed by the following basic rate equation (1):
) ( ). ( f T k dT d dt d
(1)
where α is the degree of conversion, β is the heating rate, and f(α) and k(T) are functions of conversion and temperature respectively. α is calculated in terms of mass loss according to equation (2): f t w w w w 0 0
(2)
where w0, wt and wf are the mass of the sample at the beginning of the decomposition process at any chosen point in the TGA curve, and the final mass respectively. k(T) is the temperature, which is dependent on the rate of heat flow; this is often
RT E Ae T
k( ) / (3)
where E (kJ/ mo l) is the activation energy, A (min-1) the pre-exponential factor, and R (8.314 J/ mol.K) the gas constant. By co mbining equations (1) and (3), the reaction rate can be written as:
) ( /
f RT E Ae dtd
(4)
3.1.1. Frie dman method
The Fried man method of determin ing therma l kinetics [22] is based on the Arrhenius equation and takes into account the logarithm of the conversion rate (dα/dt) as a function of the reciprocal of the te mperature (1/T) for d ifferent degrees of conversion α, according to Equation (5):
j i T R i a E j i f i A i dt d , . )) , ( ln(
ln (5)
where i is the inde x of conversion, j is the curve inde x, Ea the apparent activation energy at αi, and f(αi,j) the function dependent on the reaction model (assumed to be constant for a given reaction progress αi,j for all curves j). Since f(α) is constant at each degree of conversion αi, the curve for the logarith m of the reaction rate vs. 1/T is linear, with a slope of Ea /R. The intercept is A.
3.1.2. Fl ynn-Wall–Ozawa method
The FWO method [23,24] is derived fro m the integral isoconversional method. Using Doyle’s approximation [25], the reaction rate, in logarith mic form, can be e xp ressed as:
T R a E g R a AE 1 052 . 1 331 . 5 ) ) ( ln(
ln
(6)
where β is the heating rate and g(α) the conversion function. Thus, for any constant α value, the plot lnβ vs. 1/T recorded at should be a straight line irrespective of the heating rate. The Ea can be determined fro m the slope.
3.1.3. ASTM E698
The ASTM E698 method [26] is based on the assumption that the ma ximu m te mperature (for e xa mple of the derivative thermogravimetric [DTG] curve) of a single step reaction is reached at the same degree of conversion irrespective of the heating rate. Although this assumption is only partly true, the resulting error is small. In this method, the logarith m of the heating rate is plotted against the reciprocal ma ximu m te mperature. The slope of the yielded straight line is proportional to the Ea, just as in the FOW method:
T R a E A T 1 ) 1 ln( ln )
3.1.4. Coats-Re dfern me thod
The Coats-Redfern method [27] provides the therma l decomposition mechanism fro m the mass loss. An asymptotic approximation of 2RT/Ea <1 for the resolution of Equation (8):
) ( )
exp( 0
) ( ) (
RT a E p R
a AE dT RT
a E T
To A
f d g
(8)
allo ws Equation (9) to be obtained:
RT a E
E AR
T g
ln 2
) ( n
l
(9)This method is one of the most widely used for the determination of reaction processes. The Ea at a constant heating rate for any of the g(α) functions listed in Table 1 can be obtained fro m Equation (9).
Table 1. Functions of the most common reaction mechanis ms
IV.
RESULTS AND DISCUSSION
Figure 1 shows the good dispersion and distribution of the Al nanoparticles within the iPP matrix. No large agglo merat ions of Al nanoparticles were observed.
Figure 1. SEM photomicrograph of P PAl5
0 200 400 600 800 0
20 40 60 80 100
Ma
ss loss (
w
t.%
)
Temperature (°C)
30 °C/min 2 °C/min
5 °C/min
10 °C/min a)
20 °C/min
0 200 400 600 800 0
20 40 60 80 100
Ma
ss loss (
w
t.%
)
Temperature (°C) 2 °C/min
5 °C/min 10 °C/min
20 °C/min
30 °C/min b)
Figure 2. TGA curves for the decomposition of a ) iPP and b) PPAl5 at diffe rent heating rates.
Figure 3. DTG curves for the decomposition of a ) iPP and b) PPAl5 at diffe rent heating rates.
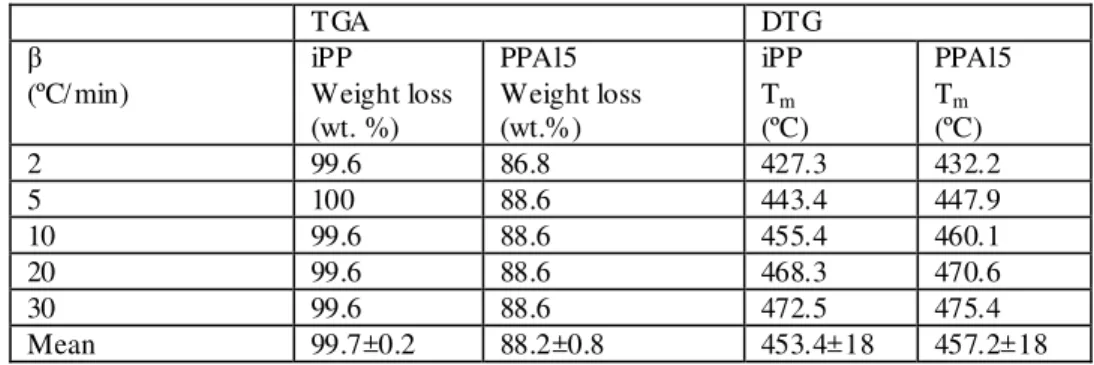
An increase was seen in the Tm with increasing heating rate. This effect has been described in other studies on the thermal decomposition of poly mers [28] and may be the result of therma l hysteresis. Table 2 shows that the presence of the Al nanoparticles to be associated with a shift of Tm towards higher values; the thermal stability for the iPP was, therefore, improved. At all the heating rates used, the Tm of the PPAl5 was some 4 ºC higher than that of the iPP (mean 457.2±2 ºC compared to 453.4±2 ºC). A similar increase was described by Lee et al. [20] for
a PP sa mple incorporating Pd nanoparticles. FTIR spectra have shown the existence of several interactions between a polyvinylidene fluoride matrix and Al nanoparticles in nanocomposites similar to the present PPAl5 [29]. These interactions can affect the mobility of poly mer chains and/or modify the Ea of the degradation process. A shift to lower wavelengths has also been recorded with increasing Al content in the FTIR spectra of other PP-Al co mposites (unpublished).
Table 2. TGA and DTG data for the decomposition of iPP and PPAl5 at d ifferent heating rates
(Tm: ma ximu m te mperature)
TGA DTG
β (ºC/ min)
iPP Weight loss (wt. %)
PPAl5 Weight loss (wt.%)
iPP Tm (ºC)
PPAl5 Tm (ºC)
2 99.6 86.8 427.3 432.2
5 100 88.6 443.4 447.9
10 99.6 88.6 455.4 460.1
20 99.6 88.6 468.3 470.6
30 99.6 88.6 472.5 475.4
The thermal stabilizing effect of the Al nanoparticles was also seen in terms of the mass loss. Over the temperature interval 20-800 ºC, the mean mass loss for all the heating rates was 99.7±0.2% for iPP and 88.2±0.8% for PPAl5.
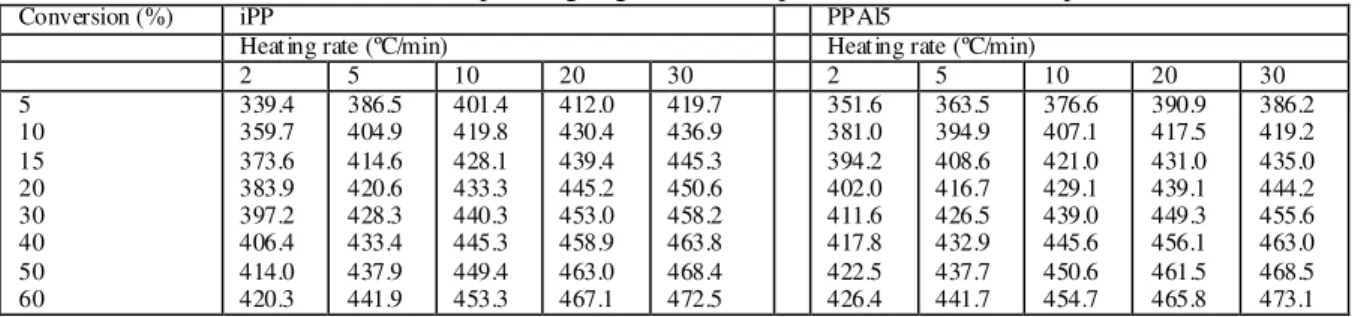
Table 3 shows the conversion values (%) with respect to the heating rate. For a heating rate of 2 ºC/ min, the Tm of PPAl5 was higher than that of iPP for a ll conversion values. At heating rates above 2 ºC/min, the Tm of PPAl5 was below that of iPP.
Table 3. Therma l deco mposition in terms of percentage conversion at a heating rate of 2, 5, 10, 20 and 30 ºC/ min, and the corresponding degradation temperature in an N2 atmosphere.
Conversion (%) iPP PPAl5
Heating rate (ºC/min) Heating rate (ºC/min)
2 5 10 20 30 2 5 10 20 30
5 10 15 20 30 40 50 60 339.4 359.7 373.6 383.9 397.2 406.4 414.0 420.3 386.5 404.9 414.6 420.6 428.3 433.4 437.9 441.9 401.4 419.8 428.1 433.3 440.3 445.3 449.4 453.3 412.0 430.4 439.4 445.2 453.0 458.9 463.0 467.1 419.7 436.9 445.3 450.6 458.2 463.8 468.4 472.5 351.6 381.0 394.2 402.0 411.6 417.8 422.5 426.4 363.5 394.9 408.6 416.7 426.5 432.9 437.7 441.7 376.6 407.1 421.0 429.1 439.0 445.6 450.6 454.7 390.9 417.5 431.0 439.1 449.3 456.1 461.5 465.8 386.2 419.2 435.0 444.2 455.6 463.0 468.5 473.1 4.2. Kinetics
Table 4 shows the Ea of the iPP and PPAl5 as determined by the different calculat ion methods. For the iPP, the Ea as determined by the Fried man method was 226 ± 15 kJ/ mo l (the pre-e xponential factor, A, was 8.5x10¹⁵ min-1), 226 ± 20 kJ/ mo l as determined by the FWO method, and 226 kJ/ mo l as determined by the ASTM E698 method. These values are similar to those reported in the literature for iPP. Lee et al. (2006) reported a value of 229 ± 13 kJ/ mo l as determined by the Fried man method (with an A value of 6.5x10¹⁵ min-1), and of 228 kJ/ mol as determined by the Kissinger method For the PPAl5, the Ea was 244 ± 4 kJ/ mo l (A = 1.6x10¹⁷
min-1) as determined by the Fried man method, 242 ± 4 kJ/ mo l as determined by the FWO method, and 244 kJ/ mol as determined by the ASTM E698 method. Thus, the Ea of the PPAl5 was around 15 kJ/ mol higher than that of the iPP: adding the Al nanoparticles therefore improved the thermal stability of the iPP.
Table 4. Apparent activation energy (Ea) and pre-e xponential factor values (A) obtained by the different mathemat ical methods for determining the therma l kinetics of decomposition, plus the therma l degradation mechanism as determined by the Coats-Redfern method.
iPP PPAl5
Fried man FWO ASTM
E698
Coats- Redfern
Fried man FWO ASTM E698
Coats- Redfern Ea (kJ/ mo l)
A (s-1) Mechanism
226 ± 15 1.42x10¹⁴ -
226 ± 20 - - 226 - - 206 4.64x10¹² R3
244 ± 4 2.72x10¹⁵ - 242 ±4 - - 244 - - 231 2.16x10¹⁴ Rn
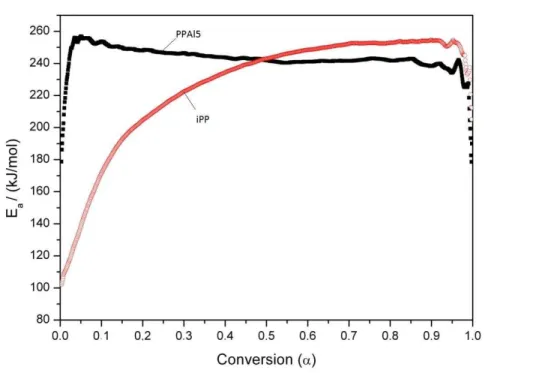
Figure 4 shows the variation in Ea as determined by the Fried man method with respect to the degree of conversion (interval 0<α<1) for both iPP and PPAl5. For the iPP, the Ea increased with the degree of conversion. The changes in the slope of the Ea/conversion value curve suggest that the therma l deco mposition of iPP occurs in three stages. The first stage occurs when α<0.15, wh ich has a clear associated ma ximu m Ea of 185 kJ/ mol
(148 ± 15 kJ/ mo l; slope: 0.66; R2=0.999). The second stage occurs when 0.15<α<0.55, with an associated Ea of 185 to 243 kJ/ mol (mean 224 ± 16 kJ/ mol; slope: 0.14; R2=0.960). The third stage occurs when 0.55<α<0.90, for which the associated
Figure 4. Variation in apparent activation energy as determined by the Fried man method.
For the PPA l5, a s mall increase in Ea was seen (fro m 179 kJ/ mo l to 257 kJ/ mol; mean 238 ± 22 kJ/mol) over the interval 0<α<0.05. Over the interval 0.05<α<0.95, it remained practically constant with increasing degree of conversion. These results suggest that the incorporation of the Al nanoparticles produced changes in the thermal decomposition mechanis m of iPP.
Table 4 shows the calculated Ea and degradation mechanism of iPP as determined by the Coats-Redfern method. The mean Ea for the iPP was 206 kJ/ mol, quite different to the values provided by the other methods. Again, this may be due to the decomposition reaction involving more than one stage and different mechanisms. The therma l degradation mechanism of iPP is proposed to be R3 type (contracting sphere). The mean Ea for the PPAl5 was approximately 231 kJ/ mo l; the reaction mechanism was Rn-type (f [α] = n[1-α] [1-1/n]
, where n = 4.8).
V.
CONCLUSIONS
The dynamic degradation of PP and a PP-Al nanocomposite materia l was compa red via TGA. The Fried man, Flynn-Wall–Oza wa (FW O), ASTM E698 and Coats-Redfern methods were used to calculate the Ea of the samples. The therma l stability for the iPP was imp roved with the introduction of the Al nanoparticles, showing a shift of the TGA curves towards higher temperatures. The therma l stabilizing effect of the Al nanoparticles was also seen in terms of the mass loss. Over the temperature interval 20-800 ºC, the mean mass loss for all the heating rates was 99.7 ±
Moreover, the Ea of the PPAl5 was around 15 kJ/ mol h igher than that of the iPP, wh ich means that adding the Al nanoparticles the thermal stability of the iPP is imp roved.
The thermal degradation models of iPP can b e described by “Contracting Sphere” model, whereas that to PPAl5 by Rn (n= 4.8) model (phase boundary reaction).
ACKNOWLEDGMENTS
This work was funded by the Ministerio de Ciencia e Innovación (project MAT2010-19883) and CYTED Project 311RT0417. J. Arran z-Andrés was supported by a CSIC JA E-Doc Progra m.
REFERENCES
[1]. Bhattacharya SK. Metal-Filled Poly mers: Properties and Applications. New York: Marcel Dekker; 1986.
[2]. G. Carotenuto LN. Nanocomposites Metal-Filled, in the Encyclopedia of Poly mer Science and Technology. New Yo rk: Wiley; 2003.
[3]. Zapata PA, Tamayo L, Páez M, Ce rda E, Azócar I, Rabagliati FM. Nanocomposites based on polyethylene and nanosilver particles produced by metallocenic "in situ" polymerization: Synthesis, characterizat ion, and antimic robial behavior. Eu rop Poly m J. 2011;47:1541-9.
perfluorinated implant mate ria ls. Europ Poly m J. 2011;47:662-7.
[5]. Pradhan S, Costa FR, Wagenknecht U, Jehnichen D, Bhowmic k AK, Heinrich G. Elastomer/ LDH nanocomposites: Synthesis and studies on nanoparticle dispersion, mechanica l properties and interfacial adhesion. Europ Po ly m J. 2008;44:3122-32. [6]. Ale xandrid is P, Tsianou M. Block
copolymer-d irected metal nanoparticle morphogenesis and organization. Europ Poly m J. 2011;47:569-83.
[7]. Chan JH, Ba lke ST. The therma l degradation kinetics of polypropylene: Pa rt III. Thermogravimetric analyses. Polym Degrad Stab. 1997;57:135-49.
[8]. Bockhorn H, Hornung A, Hornung U, Schawaller D. Kinetic study on the thermal degradation of polypropylene and polyethylene. J Anal Appl Pyrol. 1999;48:93-109.
[9]. Gao Z, Kaneko T, A masaki I, Na kada M. A kinetic study of thermal degradation of polypropylene. Polym Degrad Stab. 2003;80:269-74.
[10]. Cerruti P, Malinconico M, Rychly J, Matisova-Rychla L, Carfagna C. Effect of natural antioxidants on the stability of polypropylene films. Po ly m Degrad Stab. 2009;94:2095-100.
[11]. Aboulkas A, El harfi K, El Bouadili A. Thermal degradation behaviors of polyethylene and polypropylene. Part I: Pyrolysis kinetics and mechanis ms. Energ Convers Manage. 2010;51:1363-9.
[12]. Gó me z-Elvira JM, Benavente R, Mart ínez MC. Unravelling the contribution of chain microstructure in the mechanism of the syndiotactic polypropylene pyrolysis. Polym Degrad Stab. 2013;98:1150-1163.
[13]. Budrugeac P. Evaluation of the non-isothermal kinetic para meters of the thermal and thermo-o xidative degradation of polymers and polymeric materials: Its use and abuse. Polym Degrad Stab. 2000;71:185-7.
[14]. Pandey JK, Raghunatha Reddy K, Pratheep Ku mar A, Singh RP. An overview on the degradability of polymer nanocomposites. Poly m Degrad Stab. 2005;88:234-50. [15]. Lecouvet B, Bourbigot S, Sc lavons M,
Ba illy C. Kinetics of the thermal and thermo-o xidative degradation of polypropylene/halloysite nanocomposites. Poly m Degrad Stab. 2012;97:1745-54. [16]. Fereidoon A, Hemmat i M, Kordani N,
Ka me li M , Ahangari M G, Sharifi N. The effect of ac id-treat ment of carbon nanotubes
on the thermal kinetics of isotactic polypropylene. J Macromol Sc i, B. 2009;50:665-78.
[17]. Rakh imkulov AD, Lo ma kin SM, Dubnikova IL, Shchegolikhin AN, Dav idov EY, Kozlowski R. The effect of mu lti-wa lled carbon nanotubes addition on the thermo -oxidative deco mposition and fla mmability of PP/MWCNT nanocomposites. J Mater Sci. 2010;45:633-40.
[18]. Palac ios J, Pere ra R, Rosales C, Albano C, Pastor JM. Therma l degradation kinetics of PP/OMMT nanocomposites with mPE and EVA . Poly m Degrad Stab. 2012;97:729-37. [19]. Day M, Cooney JD, Mac Kinnon M.
Degradation of contaminated plastics: a kinetic study. Polym Degrad Stab. 1995;48:341-9.
[20]. Lee JY, Liao Y, Nagahata R, Ho riuchi S. Effect of metal nanoparticles on thermal stabilization of polymer/ metal nanocomposites prepared by a one-step dry process. Poly mer. 2006; 47:7970-9.
[21]. Mohoriè I, Kra jnc M, Šebenikb U. Model-free Kinetics Analysis of Thermal Degradation of Po lysilo xane Lubricant. Che m Biochem Eng Q, 2009;23:493-496. [22]. Fried man, HL, Kinetics of thermal
degradation of char-forming plastics from thermogravimet ry. Application to a phenolic plastic, J Po ly m Sci C, 1964;6: 183–195. [23]. Flynn J, Wall L, A quic k, direct method for
the determination of activation energy from thermogravimet ric data. J Po ly m Sc i Poly m Lett, 1966;4:4323-328
[24]. Ozawa A. New method of analyzing thermogravimet ric data. B Che m Soc JPN, 1965;38:1881–1886.
[25]. Doyle C. Kinetic analysis of thermogravimet ric data. J Appl Poly m Sc i, 1961;5:285–292.
[26]. ASTM E698, “Arrhenius Kinetic Constants for Thermally Unstable Materials”, ASTM International, West Conshohocken, PA [27]. Coats AW, Redfern JP. Kinetic para meters
fro m thermogravimet ric data. Nature, 1964;201:68–69.
[28]. Zheng P, Ling XK. A therma l degradation mechanis m of polyvinyl alcohol/silica nanocomposites. Polym Degrad Stab, 2007;92:1061–71.
shielding capability. Mat Che m Phys, 2013;142:469-478