ISSN 0104-6632 Printed in Brazil
Vol. 21, No. 04, pp. 569 - 583, October - December 2004
of Chemical
Engineering
A NUMERICAL SIMULATION ANALYSIS OF
THE EFFECT OF THE INTERFACE DRAG
FUNCTION ON CLUSTER EVOLUTION
IN A CFB RISER GAS-SOLID FLOW
L. C. Gómez* and F. E. Milioli
Núcleo de Engenharia Térmica e Fluidos, EESC-USP, Av. Trabalhador São-Carlense 400, CEP 13566-590, São Carlos - SP, Brasil,
E-mail: [email protected] E-mail: [email protected]
(Received: October 16, 2003 ; Accepted: July 12, 2004)
Abstract - The dynamics of formation, dissipation and breaking of coherent structures in the riser gas-solid flow of a circulating fluidized bed (CFB) are evaluated by numerical simulation. The simulation is performed using the MICEFLOW code, which includes IIT's two-fluid hydrodynamic model B. The methodology for cluster characterization is used from Sharma et al. and is based on determination of four characteristics, average lifetime, average volumetric fraction of solid, existence time fraction and frequency of occurrence. Clusters are identified applying a criterion for the time average value of the volumetric solid fraction. A qualitative analysis of the influence of different drag function correlations on the hydrodynamics of the flow, including the evolution of coherent structures, is performed. The simulation predictions are also compared to experimental results. The results indicate that the choice of a correlation for drag function should be quite judicious. Finally it is shown that the mean clustering criteria of Sharma et al. should be modified to take into account other factors that influence cluster dynamics.
Keywords: coherent structures, clusters, drag function, numerical simulation, gas-solid flow, circulating fluidized bed.
INTRODUCTION
The hydrodynamics of the gas-solid flow in risers of circulating fluidized beds result in coherent structures generally known as clusters. These structures are regions with higher particle concentrations than the average concentration of particles in the riser of the bed. These groups of particles move as a single body with little internal relative movement (Helland et al., 2002). According to Horio and Clift (1992), agglomerates are groups of particles joined together by the action of inter-particle forces, and clusters are groups of inter-particles joined together as a result of hydrodynamic effects. However, in several articles in the literature the term
1994; Tsukada et al., 1997; and others). Regarding this discrepancy, Lackermeier et al. (2001) noted that the laser sheet technique used by Horio and coworkers enables only images external to the flow to be obtained, thereby restricting observations to those of very small solid volumetric fractions (mass flow rates from about 0.01 to 0.05 kg/(m2s)). Lackermeier et al. (2001) applied Horio’s technique, but tooked a shot of the internal flow through the use of an endoscopic observation technique. This technique allowed studying gas-solid flows with solid concentrations characteristic of CFB risers. The clusters they observed were very similar to those described by Davidson (2000) and Büssing and Reh (2001).
A number of numerical simulations have been developed for studying clusters. Tsuo and Gidaspow (1990) used a traditional two-fluid model of constant viscosity to study the formation of clusters. Various characteristics of the clusters were described, including density, size and flow pattern, and a discussion of the effect of several parameters on processes of cluster formation was presented. The parameters considered were superficial inlet gas velocity, solid mass velocity, particle size, riser diameter, riser height and mixture of fine particles. It was shown that a decrease in mass flow rate and particle size and an increase in superficial inlet gas velocity, mixture of fine particles and column diameter produced a reduction in cluster population. Work similar to that of Tsuo and Gidaspow was developed by a number of researchers using Eulerian-Lagrangean formulations (Hoomans et al., 1998; Ouyang and Li, 1999; Helland et al., 2000; Helland et al., 2002; and others).
The similarity between cluster formation in liquid-liquid systems and that in gas-solid systems was addressed by Chen et al. (1991). The authors recognized that the drag force is the only source for producing relative movement between particles and considered that any two systems must have the same tendency to form clusters if their drag forces are hydrodynamically similar. Currently, the stationary drag force at the interface is the only one considered in the traditional two-fluid model. Empirical correlations account for this force, by which momentum transport at the interface is modeled. It is normal to consider the interface drag force as a combination of both the shape and the skin drag in a single empirical parameter (see, for instance, van Wachem et al., 2001).
Most of the data used for drag force correlation in many multiparticle systems were obtained in uniform fluidization and sedimentation studies. Typically, the
drag force is determined through experimental measurement of pressure gradient. Usually the experimental measurements are used to calculate the so-called drag function at the interface, β, either in a straightforward way where β = f(∆P) or as a function of the drag coefficient for a single particle in the suspension, CDs, so β = f(CDs(∆P)). Making use of this methodology various correlations for β have been proposed in the literature. For instance, Ergun (1952) measured pressure gradient in a fixed liquid-solid bed and developed an expression for ∆P. Later this correlation was used to calculate β in a straightforward way, i.e., β = f(∆P). Wen and Yu (1966) developed experiments on the sedimentation of solid particles in a liquid for a large range of solid volumetric fraction values. They considered their own data as well as data from other researchers and derived a correlation for CDs, valid for 0.01 ≤ αs ≤ 0.63. Later this correlation was used to indirectly calculateβ, giving rise to an expression of the type β = f(CDs(∆P)).
Helland et al. (2002) describe two opposite effects of the processes of cluster formation on the interface drag. In dilute regions with nonuniformly distributed particles, a descending movement of one particle can generate a velocity field throughout the fluid, reducing the drag on neighbor particles due to return flow bypass. In dense zones with uniformly distributed particles, the reduced flow area between particles will impose higher gas velocity gradients, which will produce increased shear stresses and consequently an increased resistance to the gas flow.
In this paper the methodology of identification and characterization of clusters of Sharma et al. (2000) is applied to results of numerical simulation. The main objective is to study the influence of the drag function on cluster dynamics. Four drag function correlations, taken from Ergun (1952), Wen and Yu (1966), Di Felice (1994) and Gidaspow (1994), are analyzed. The procedure applied in Gidaspow (1994), here referred to as Gidaspow's procedure, assumes a hybrid approach through which Ergun's correlation is applied for αs ≥ 0.2 and Wen and Yu's correlation is applied for αs < 0.2. van Wachem et al. (2001) observed that this procedure can cause some numerical instabilities due to the step-change in the drag function for αs = 0.2. Otherwise, according to Sanyal and Cesmebasi (1994) this procedure is the one that best reproduces bubble growth processes in bubbling fluidized beds.
Soong et al. (1993) apud Sharma et al. (2000). They accounted for four basic cluster characteristics that allow quantifying the influence of flow parameters on these structures. The parameters considered were particle size and gas superficial velocity. Their analyses were of experimental measurements obtained with a capacitance probe, which provided
instantaneous local volumetric solid fraction in a 15 cm diameter circulating fluidized bed. Despite the fact that the methodology was first applied to results of experiments (Soong et al., 1993 apud Sharma et al., 2000; Tuzla et al., 1998; Sharma et al., 2000), it was also recently applied by Helland et al. (2002) to results of numerical simulation.
Table 1: Mathematical Model B (Gidaspow, 1994).
1. Continuity, phase k (k = g, s) ( k k) ( k k k) 0 t
∂ ρ α + ∇ ⋅ ρ α =
∂ v
2. Momentum, Model B
Gas phase:
g g g
g g g g
B g s g g g
( )
( ) P
t
( ) ( )
∂ ρ α
+ ∇ ⋅ ρ α = −∇ ∂
−β − + ∇ ⋅ α τ + ρ
v
v v
v v g
Solid phase:
s s s
s s s s B g s
s s s s g s
( )
( ) ( )
t
( ) G ( )
∂ ρ α + ∇ ⋅ ρ α = β − ∂
+∇ ⋅ α τ − ∇α + ρ − ρ α
v
v v v v
g
3. Viscous stress tensor, phase k (k = g, s) k k k k T
(
k)
2( ) I
3
τ = µ ∇ + ∇ − ∇ ⋅
v v v
4. Solid elasticity modulus 8.686 g 6.385 2
g
G(α =) 10− α + dyn cm
5. Volumetric fraction α + α =g s 1
6. Gas law ρ =g P (R T)g ,ρ = ρs s (constant)
7. Interface drag function, Model B
Ergun (1952):
2
g s g s
s g
2 2
g p s g p s
150 1.75
( d )
(d )
ρ α − α µ
β = +
α φ α φ
v v
Wen and Yu (1966):
g s g g s 2.65
Ds g
g p s 3
C
4 ( d )
−
ρ α α −
β = α
α φ v v where 0.687 s s Ds s s 24
(1 0.15Re ) Re 1000
C Re
0.44 Re 1000
+ <
=
≥
Gidaspow’s procedure (Gidaspow, 1994): Ergun (1952) correlation for αs≥ 0.2 and Wen & Yu (1966) correlation for αs < 0.2.
Di Felice (1994):
Ds s g g g s g
p 3
C 4d
−η
β = α α ρ v −v α
2
Ds
s 1
C 0.63 4.8
Re
= +
[
]
2s 1.5 log(Re ) 3.7 0.65exp
2
−
η = − −
Reynolds number
g g g s p s
s
g d
Re =α ρ − φ
µ
FORMULATION AND THEORETICAL PROCEDURE
Mathematical Model
In the present work the hydrodynamic model B for a gas-solid flow developed at IIT (Illinois Institute of Technology) and included in the numerical code MICEFLOW (Jayaswal, 1991) is applied. A summary of the governing system of equation is shown in Table 1. More detailed descriptions of the formulation are presented in Jayaswal (1991), Gidaspow (1994), Enwald et al. (1996) and Cabezas-Gómez and Milioli (2001). The model, called the traditional two-fluid model, uses a Eulerian description for each phase, making possible the use of the kinetic theory of granular flows (KTGF) as described in Gidaspow (1994). The model includes mass, momentum and energy conservation equations for all the phases and the turbulent kinetic energy equation for all solid phases. The computational code allows a description of multiphase flows, including various solid phases, each characterized by a mean particle diameter, density and sphericity factor and two different fluid phases. In the present work a flow containing a single gas phase (air) and a single solid phase (glass beads) is addressed. Both phases are assumed to be isothermal at 300K, and no interface mass transfer is assumed. A Newtonian rheology is assumed for both phases. The solid phase pressure is modeled empirically through the solid elastic modulus, G, using the empirical correlation of Rietema and Mutsers (1973) apud Jayaswal (1991). As stated in the previous section, four different correlations are considered for the interface drag function. These are correlations of Ergun (1952), Wen and Yu (1966), and Di Felice (1994), besides the procedure of Gidaspow and coworkers (Gidaspow, 1994), where Ergun's correlation is used for αs≥ 0.2 and Wen and Yu's correlation is used for αs < 0.2.
In Table 1, the subscripts (g) and (s) respectively stand for gas and solid phases, vg and vs are local temporal velocities (m/s), ρg and ρs are densities (kg/m3), αg and αs represent volumetric fractions, andτg and τs are viscous stress tensors (Pa). Also, P is the thermodynamic gas pressure (Pa), g is the gravity acceleration (m/s2), G is the solid-phase elasticity modulus (N/m2), and β is an interface drag function (kg/m2s). CDs characterizes the interface drag coefficient for a single particle in an infinite medium, Res is the Reynolds number based on the particle mean diameter dp, φs is the particle
sphericity,µ represents dynamic viscosity (kg/ms), Rg is the ideal gas constant (kJ/kgK) and t is the time (s).
Cluster Identification and Characterization
Soong et al. (1993) apud Sharma et al. (2000) rely on the following guidelines to define clusters:
The concentration of solids in the cluster must be significantly higher than the local time-averaged solid concentration at a given local position for a particular set of operational conditions.
A perturbation in the concentration of solids due to clusters must be higher than the random ground fluctuations of the solid fraction.
This concentration perturbation should be measured in a sample volume with a characteristic length one or two orders of magnitude longer than the particle diameter.
Considering the above, Soong et al. proposed the following criterion: the value of the local instantaneous volumetric solid fraction for a cluster should be higher than its time-averaged value by two times the standard deviation (2σ). This way the clusters can be identified and considered as such when an instantaneous solid fraction exceeds that limit. This criterion was used by Tuzla et al. (1998) to detect clusters in a downer fluidized bed. Sharma et al. (2000) slightly changed the above criterion on the basis of experimental evidence. According to the authors, the clusters detected through the 2σ criterion may become a different physical entity as soon as the instantaneous solid fraction becomes larger than the time-averaged solid fraction. This leads to the following criteria for cluster life-time:
The cluster is detected when the instantaneous solid fraction becomes larger than the time-averaged solid fraction plus two times the standard deviation (2σ). The starting time of a cluster is the last time at which the instantaneous solid fraction exceeds the time-averaged solid fraction before satisfying the 2σ criterion.
The end time of a cluster is the first time at which the instantaneous solid fraction falls below the time-averaged solid fraction after falling below the 2σ criterion.
a quantitative way, but would not change the general dynamic characteristics of the clusters. The arbitrariness of the criterion adopted by Sharma et al. is discussed at the end of the Results section.
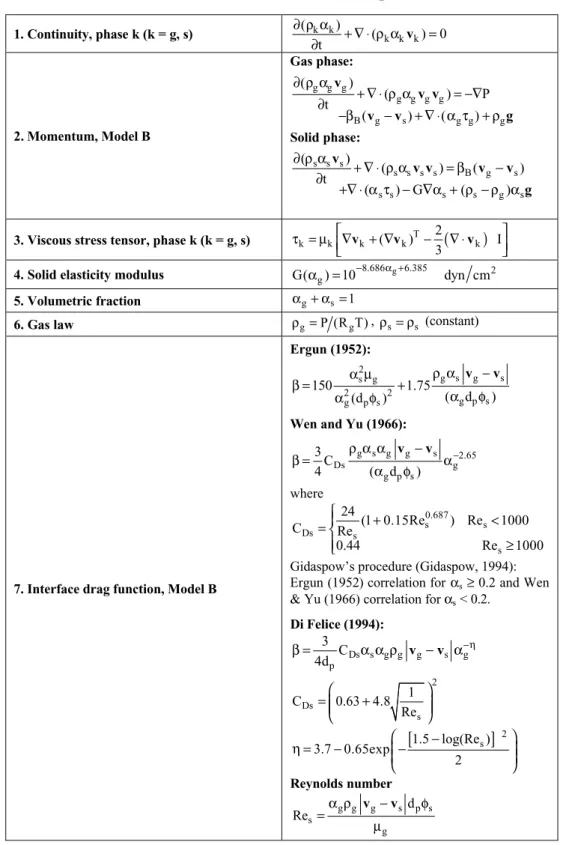
An illustrative application of the mean-referenced criterion is presented in Figure 1 for a transient signal
of the local volumetric fraction resulting from a typical simulation. The time-averaged solid fraction αs and the αs+ 2σ threshold are indicated. Figure 1b shows a closer view of the transient signal from 20 to 30 seconds. One cluster is observed between Ta and Tb.
20 30 40 50 60 70 80 90 100 0.00
0.01 0.02 0.03 0.04 0.05 0.06
Time (s)
αs
αs αs+ 2σ
a)
20 21 22 23 24 25 26 27 28 29 30 0.00
0.01 0.02 0.03 0.04 0.05 0.06
Time (s)
αs
αs αs+ 2σ
Ta Tb
b)
Figure 1: Illustrative application of the mean-referenced criterion to a transient signal of the local volumetric fraction resulting from typical simulation.
After a cluster is identified, its four basic characteristics, as defined by Tuzla et al. (1998) and Sharma et al. (2000), can be calculated. These characteristics are the mean duration time, the frequency of occurrence, the existence time fraction and the mean solid concentration. They are defined as follows:
Mean duration time (τc): the mean time of duration of all clusters in a sample volume. (In Sharma et al. the relevant volume is the volume of a capacitance probe; when results of simulation are used the relevant volume is that of a computational cell.) Assuming τi is the duration time of a single cluster,
n n
1 i
c
∑
τ =τ (1)
where n is the total number of clusters detected in the observation period.
Frequency of occurrence (Nc): the frequency at which the clusters are observed in the sample
volume. It is calculated as the mean number of clusters per second that are observed during the entire observation period (τ).
Existence time fraction (Fc): the fraction of the observation period in which there are clusters in the sample volume.
τ τ
=
∑
n
1 i
c
F (2)
Mean solid concentration (αsc): the sum of the time-averaged solid fractions for all the clusters over the total number of clusters detected in the observation period, i.e.,
n n
1 i , s
sc
∑
α=
α (3)
∫
=
R 20
dx
)
x
(
f
R
2
1
f
(4)where x is the horizontal coordinate direction and 2R is the cross-sectional length.
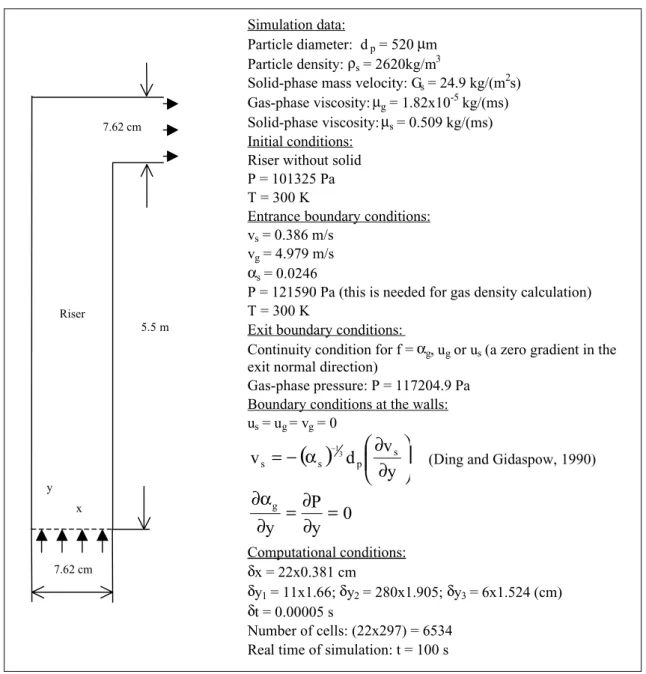
Simulation Conditions and Initial and Boundary Conditions
Figure 2 shows the simulation conditions and domain, including the initial, inlet and outlet
boundary conditions for both phases. One-dimensional plug flow is assumed at the inlet cross section. At the outlet the continuity condition is assumed for all variables, except for gas pressure. At the walls the no slip condition is assumed for the gas phase and a partial slip condition is assumed for the solid phase in agreement with Ding and Gidaspow (1990). A Cartesian coordinate system is used
considering a 22×297 two-dimensional
computational mesh nonuniform in the axial direction. The value for solid-phase viscosity was taken from Tsuo and Gidaspow (1990).
Simulation data:
Particle diameter: dp = 520µm Particle density:ρs = 2620kg/m3
Solid-phase mass velocity: Gs = 24.9 kg/(m2s) Gas-phase viscosity:µg = 1.82x10⁻⁵ kg/(ms) Solid-phase viscosity:µs = 0.509 kg/(ms) Initial conditions:
Riser without solid P = 101325 Pa T = 300 K
Entrance boundary conditions: vs = 0.386 m/s
vg = 4.979 m/s αs = 0.0246
P = 121590 Pa (this is needed for gas density calculation) T = 300 K
Exit boundary conditions:
Continuity condition for f =αg, ug or us (a zero gradient in the exit normal direction)
Gas-phase pressure: P = 117204.9 Pa Boundary conditions at the walls: us = ug= vg = 0
( )
∂ ∂ α
−
= −
y v d
vs s p s
3 1
(Ding and Gidaspow, 1990)
0 y P y
g
= ∂ ∂ = ∂
α ∂
Computational conditions:
δx = 22x0.381 cm
δy1 = 11x1.66;δy2 = 280x1.905;δy3 = 6x1.524 (cm) δt = 0.00005 s
Number of cells: (22x297) = 6534 Real time of simulation: t = 100 s Riser
7.62 cm
5.5 m
x y
7.62 cm
Figure 2: Simulation domain, including the initial, inlet, and outlet boundary conditions for both phases (for the IIT installation described in Luo (1987)
Simulation Results
In this section a comparison of the radial profiles for axial velocity for both phases and the solid volumetric fraction in the simulation and the experiment is presented. Transient profiles for solid fraction in the riser column are also presented. Next, simulation results for various drag functions are qualitatively compared using the methodology of cluster identification and characterization of Sharma et al. Finally some comments on the mean-referenced criterion are offered.
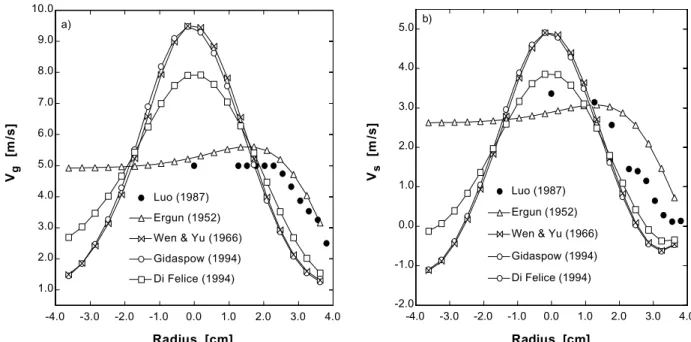
Comparison Between Simulation and Experimental Data
Figure 3 shows radial profiles for time-averaged axial velocity of both phases compared to Luo's experimental data for the various drag function correlations taken into account. In Figure 3a a significant difference is seen on vg profiles and the experimental data for all β correlations except Ergun's for the right-hand side wall. The deviations are still more pronounced at the axis of the riser. It can be observed that Wen and Yu's correlation and Gidaspow's procedure produce similar behavior for
vg. Di Felice's correlation also shows behavior that is qualitatively similar to the above, but with some quantitative differences. It should be pointed out that, despite the fact that the results for Ergun's correlation are similar to those of the experiment (mainly at the right-hand side wall), they are physically incorrect from the center to left-hand side wall. The reason for this behavior is discussed in Cabezas-Gómez and Milioli (2003a). It appears that in this case viscous effects lose significance unlike drag effects, resulting in flat distributions of αs (as seen in Figure 4). This produces a homogenization effect of the solid phase on the gas phase, i.e., a flow strainer-like effect, that causes the cross-section gas-solid velocity profile to become flat. Also, it can be observed in Figure 3b that Ergun's correlation gives rise to a vs radial profile that deviates more from the experiment that seen in the deviations for all the otherβ correlations. Figure 3 also shows that all the correlations, except Ergun's, achieve the expected characteristic core-annulus flow pattern, including the downflow at the walls evidenced by the negative values of vs. The physically incoherent results obtained using Ergun's correlation show it must not be used for the whole range of possible solid volumetric fractions.
-4.0 -3.0 -2.0 -1.0 0.0 1.0 2.0 3.0 4.0 1.0
2.0 3.0 4.0 5.0 6.0 7.0 8.0 9.0 10.0
Radius [cm]
Vg
[m
/s
]
Gidaspow (1994) Ergun (1952) Wen & Yu (1966) Luo (1987)
Di Felice (1994) a)
-4.0 -3.0 -2.0 -1.0 0.0 1.0 2.0 3.0 4.0 -2.0
-1.0 0.0 1.0 2.0 3.0 4.0 5.0
Radius [cm]
Vs
[m
/s
]
Gidaspow (1994) Ergun (1952)
Wen & Yu (1966)
Di Felice (1994) b)
Luo (1987)
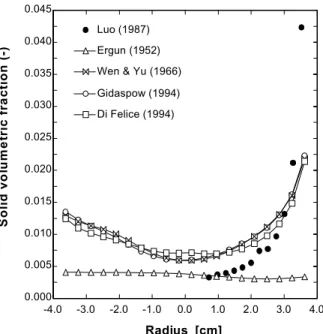
Figure 4 shows radial profiles for the time-averaged solid volumetric fraction, αs, for the various
β correlations. Except for Ergun's correlation, results are very similar, qualitatively correct and in good agreement with the experimental data. The largest quantitative differences between simulation and experiment are detected in the region close to the wall. Again, it is clear that Ergun's correlation alone cannot predict correct hydrodynamic behavior. The other correlations, including Ergun's as applied in Gidaspow's procedure, give rise to coherent solid volumetric fractions, which are higher close to the walls and lower around the axis.
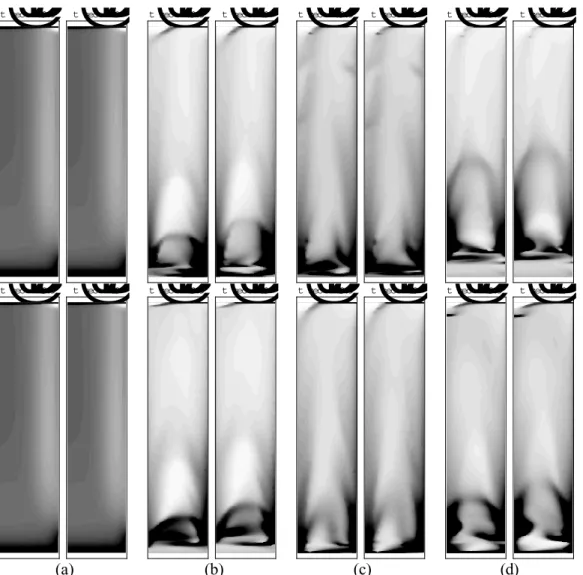
The temporal variation in the solid volumetric fraction in the column is shown in Figure 5 for the different drag functions considered. Four times are plotted (39.9, 40.0, 79.9 and 80.0 seconds). Once more the inadequacy of Ergun's correlation when used alone can be seen, since it prevents the model from catching both the expected characteristic low frequency flow oscillations and the clusters. However, when Ergun’s correlation is used for αs ≥ 0.2 alongside Wen and Yu’s correlation for αs < 0.2 (Gidaspow's procedure), the above trends are well represented (Figure 5d). The same occurs for the other two correlations considered. The predictions for Wen and Yu’s correlation and Gidaspow's procedure seem similar, differing more in the lower half of the column. This should be because Gidaspow's procedure applies Wen and Yu's correlation in dispersed regions. Figure 5 also shows that the instantaneous behavior of the flow is different for each correlation. This emphasizes the importance of a correct choice of drag function correlation and the need for new studies along this line.
Further analyses of simulations similar to those presented here were presented in Cabezas-Gómez and Milioli (2001, 2003a). The same mathematical model and numerical procedure were employed, using a different computational mesh. The qualitative behavior found was the same as that in the present simulations. The same behavior was also observed for Ergun's correlation.
Characteristic Analysis of Clusters Using Results of Simulation for Various β Correlations
Radial profiles for the mean solid concentration of clusters, αsc, are shown in Figure 6. Behavior similar to that seen in Figure 4 for αs is observed for all the β correlations except for Di Felice’s, which shows a quite different pattern. Again, Wen and Yu’s correlation and Gidaspow's procedure produce very similar results. The mean solid concentration of clusters is higher at the walls. Ergun’s correlation gives rise to a flat radial profile (radial homogeneous distribution of αsc) that matches the radial profile of αs both qualitatively and quantitatively. This is unexpected since the mean concentration of solids in clusters is by definition supposed to be higher than the time-averaged concentration of solids at the same place during the same time interval. This behavior is also observed for other correlations, as seen in Figure 6. Clearly, for the above situations the mean-referenced criterion is not appropriate. This fact, which is discussed further below, reinforces the need for improving or formulating new criteria to better characterize and quantify coherent structures in gas-solid flows.
-4.0 -3.0 -2.0 -1.0 0.0 1.0 2.0 3.0 4.0 0.000
0.005 0.010 0.015 0.020 0.025 0.030 0.035 0.040 0.045
Radius [cm]
S
o
lid
v
o
lu
m
e
tric
fra
c
tio
n
(-)
Gidaspow (1994) Ergun (1952)
Wen & Yu (1966) Luo (1987)
Di Felice (1994)
t
@
secD
=39.9 t@
secD
=40 t@
secD
=39.9 t@
secD
=40 t@
secD
=39.9 t@
secD
=40 t@
secD
=39.9 t@
secD
=40t
@
secD
=79.9 t@
secD
=80 t@
secD
=79.9 t@
secD
=80 t@
secD
=79.9 t@
secD
=80 t@
secD
=79.9 t@
secD
=80(a) (b) (c) (d)
Figure 5: Temporal variation in the solid volumetric fraction in the column for the different drag functions: (a) Ergun (1952), (b) Wen & Yu (1966), (c) Di Felice (1994), and (d) Gidaspow (1994).
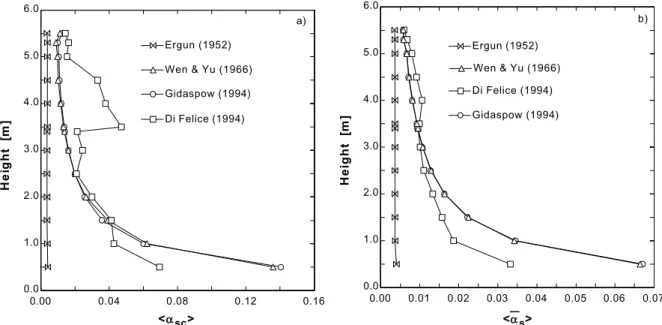
Figure 7 shows axial profiles for the mean cross-sectional values of the time-averaged solid fraction, <αs>, and the mean concentration of solids in clusters, <αsc>. Both parameters show similar behavior for both Wen and Yu’s correlation and Gidaspow's procedure, except for the height of 5.5 m, where <αsc> increases while <αs> decreases.
This is clearly a consequence of accumulation of solids and intensified cluster formation at the outlet. For Di Felice’s correlation the axial profile for <αsc> shows some variations that are sharper than that of <αs> and a noticeably sharp increase at the height of about 3.5 m. Above this height <αs> considerably decreases and finally slightly increases at the outlet. It should be noted that above 1.5 m <αsc> becomes higher than the values for the other correlations. This is due to the fact that denser clusters are formed for Di Felice’s correlation, as
seen in Figure 6.
profiles for <αsc> for the various drag function correlations considered, making evident the need for experimental validation.
Figure 8 shows radial profiles for cluster mean duration time, τc, and axial profiles for its cross-sectional average, <τc>. Significant relative variations are observed among the radial profiles for the various drag functions. A considerable increase inτc is observed moving towards the right-hand side wall. This happens to a lesser extent moving towards the left-hand side wall. Such asymmetric behavior seems to be due to the outlet boundary condition that requires the flow to move towards the right-hand
side wall, causing a higher concentration of solids in clusters in this region. It is interesting to note that for Ergun’s correlation the cluster mean duration time results in the range from about 1.0 to about 1.75 seconds. In this case the existence of a cluster duration time is inconsistent, since no cluster is observed when using Ergun’s correlation, as previously discussed. Again, this makes clear that the methodology of identification and characterization of clusters of Sharma et al. (2000) needs revision. Finally, Figure 8 shows that τc is higher for Di Felice’s correlation at most heights in the column.
-4.0 -3.0 -2.0 -1.0 0.0 1.0 2.0 3.0 4.0 0.000
0.010 0.020 0.030 0.040 0.050 0.060
Radius [cm]
αsc
Ergun (1952) Wen & Yu (1966) Gidaspow (1994) Di Felice (1994)
Figure 6: Radial profiles for the mean solid concentration of clusters for various drag function correlations.
0.00 0.04 0.08 0.12 0.16
0.0 1.0 2.0 3.0 4.0 5.0 6.0
<αsc>
H
e
ight
[m
] Di Felice (1994)
Wen & Yu (1966) Ergun (1952)
Gidaspow (1994)
a)
0.00 0.01 0.02 0.03 0.04 0.05 0.06 0.07 0.0
1.0 2.0 3.0 4.0 5.0 6.0
<αs>
H
e
ight
[m
]
Di Felice (1994)
Gidaspow (1994) Wen & Yu (1966) Ergun (1952)
b)
-4.0 -3.0 -2.0 -1.0 0.0 1.0 2.0 3.0 4.0 0.5
1.0 1.5 2.0 2.5 3.0 3.5 4.0
Radius [cm]
τc
(s
)
Gidaspow (1994) Ergun (1952)
Wen & Yu (1966)
Di Felice (1994) a)
3.4 meter height
0.0 0.4 0.8 1.2 1.6 2.0 2.4 0.0
1.0 2.0 3.0 4.0 5.0 6.0
<τc> (s)
H
e
ight
[m
]
Gidaspow (1994)
W en & Yu (1966)
Ergun (1952) Di Felice (1994)
b)
Figure 8: Radial profiles for cluster mean duration time and axial profiles for the cross-sectional average for various drag function correlations.
The present results for τc are quite different from those obtained by Sharma et al. They found the highestτc to be about 0.15 seconds at 4.5 meters high in the column. In the present work the highest τc was of about 4.0 seconds at a height of 3.4 meters. The turbulent nature of the flow may be a major cause for the disagreement, since in the present work it is only accounted for to the extent allowed by the size of the numerical mesh. Scales of turbulence smaller than the mesh size are not observed. This limitation will mainly affect the gas phase, as discussed in Cabezas-Gómez and Milioli (2003b), since mesh size is considerably fine for the solid phase. Otherwise, caution is required when comparing these results to those of Sharma et al., since those authors assumed radial symmetry and their operating conditions and bed geometry were not the same as those in the present work. Experimental uncertainties of Sharma et al. and numerical errors in the present simulations should also be considered.
Radial profiles for cluster existence time fraction are shown in Figure 9 at a column height of 3.4 meters. Cross-sectional averages in the column are also shown. Existence time fraction of the clusters was quite scattered throughout the cross section, ranging between about 0.07 and 0.27, with most of the points lying between 0.12 and 0.22. No correlation pattern seems to exist between existence time fraction of the clusters and radial position inside the column. The cross-sectional averages of the existence time fraction of the clusters varied between about 0.07 and 0.23. It’s average on the column
height resulted in about 0.17 for all correlations except for those of Di Felice. The same result was obtained by Sharma et al.. The authors observed that <Fc> is constant and independent of both inlet gas superficial velocity and mean particle diameter and pointed out that for this there is no explanation at the moment.
-4.0 -3.0 -2.0 -1.0 0.0 1.0 2.0 3.0 4.0 0.00
0.04 0.08 0.12 0.16 0.20 0.24 0.28
Radius [cm]
Fc
Gidaspow (1994) Ergun (1952)
Wen & Yu (1966) Di Felice (1994) 3.4 meter height
a)
0.050 0.100 0.150 0.200 0.250 0.0
1.0 2.0 3.0 4.0 5.0 6.0
<Fc>
He
ig
ht
[m
]
Gidaspow (1994) Wen & Yu (1966)
Ergun (1952)
Di Felice (1994) b)
Figure 9: Radial profiles for cluster existence time fraction for 3.4 meters from the inlet and cross-sectional averages along the column for various drag function correlations.
-4.0 -3.0 -2.0 -1.0 0.0 1.0 2.0 3.0 4.0 0.00
0.04 0.08 0.12 0.16 0.20
Radius [cm]
Nc
Gidaspow (1994) Ergun (1952)
Wen & Yu (1966) Di Felice (1994) 3.4 meter height a)
0.00 0.10 0.20 0.30 0.40 0.50 0.0
1.0 2.0 3.0 4.0 5.0 6.0
<Nc> (1/s)
H
e
ight
[m
]
Gidaspow (1994) Wen & Yu (1966) Ergun (1952)
Di Felice (1994) b)
Figure 10: Radial profiles for frequency of cluster occurrence 3.4 meters from the inlet and cross-sectional :averages in the column for various drag function correlations.
Helland et al. (2002) applied an Euler-Lagrange model to simulate the upper side of the experimental rig of Sharma et al. (2000). They found frequencies of cluster occurrence from 6 to 9 clusters per second, which is relatively close to that of Sharma et al. of 12
much lower than the maximum of 4.0 seconds in the present simulation.
Helland et al. used a highly spatial resolved simulation by considering the movement of all the particles in the domain and their interactions with the gas phase. In the present Euler-Euler simulations, the high frequency hydrodynamic oscillations of the gas phase are filtered by the numerical procedure. This may be a cause for the relatively low values observed for the frequency of cluster occurrence as well as for the high values found for mean duration time of the clusters. However, the present results are qualitatively supported by Davidson’s observation that clusters are characterized by long residence times and slow movements (Davidson, 2000).
The above are evidence of the need for new and more comprehensive studies on cluster characterization, both experimental and numerical. On the experimental level the reason to require new independent measurement of solid fractions is clear. On the simulation level more comprehensive and accurate three-dimensional results are required.
Analysis of the Sharma et al. Mean-referenced Criteria
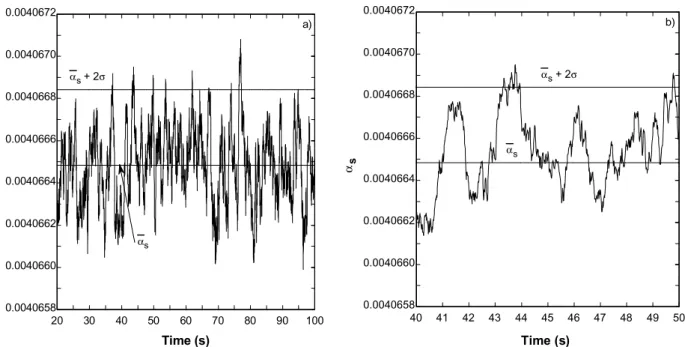
Figure 11 shows the transient behavior of the solid fractions close to the left-hand side wall at a
column height of 3.4 meters, using Ergun’s correlation for the drag coefficient. As can be seen, the 2σ criteria obtains nine clusters during the time interval considered. The difference between the time-averaged solid’s fraction αs and αs + 2σ, which actually defines what is and what is not a cluster, is on the order of 10-7. This very insignificant difference is lower than errors commonly found in experimental measurements and many numerical predictions in fluid mechanics. In fact, the statistical analysis on the mean-referenced criteria of Sharma et al. (2000) are based will identify clusters independently of the behavior of αs. This is so because any signal analyzed will have some clusters beyond the 2σ limit. It seems clear that new criteria need to be formulated, whereby flow hydrodynamic effects are taken into account, rather than only statistical data on αs. This feature was recently addressed by Harris et al. (2002). According to these authors, the lower limit of αs influences cluster definition and properties. This suggests that the mean-referenced criteria should be modified by considering lower limits of αs, both in time and space. Effects of operating conditions and bed geometry on flow behavior should also be considered. This task seems to be very difficult to accomplish at the moment.
20 30 40 50 60 70 80 90 100 0.0040658
0.0040660 0.0040662 0.0040664 0.0040666 0.0040668 0.0040670 0.0040672
Time (s)
αs
αs+ 2σ
αs
a)
40 41 42 43 44 45 46 47 48 49 50 0.0040658
0.0040660 0.0040662 0.0040664 0.0040666 0.0040668 0.0040670 0.0040672
Time (s)
αs
αs+ 2σ
αs
b)
FINAL REMARKS
Simulation results were significantly affected by the particular drag function correlation which was used. The choice of an appropriate correlation was shown to be a critical feature, especially when quantitative good results are desired. Clearly, further work is required on this matter. Physically incoherent results were obtained with Ergun's correlation, showing that it must not be applied alone for the whole range of possible solid fractions.
The analyses clearly pointed out that the criteria of Sharma et al. (2000) for identification and characterization of clusters needs to be reformulated. In its present form the criteria indicate the existence of clusters for any flow pattern, whatever the value of the solid fraction.
The present predictions, evaluated under the criteria of Sharma et al., obtained much lower amounts and much longer lifetimes of clusters than the experiment and other simulations in the literature. These discrepancies may be caused by experimental uncertainties, numerical errors or differences in both operational conditions and bed geometry. Also, in the present simulations the high frequencies of hydrodynamic oscillations in the gas phase are filtered by the numerical procedure. This may also be a cause of the above-mentioned discrepancies. In this case the model can by corrected by including either artificial turbulence models, such as the k-ε model, or a large eddy simulation with a well-refined computational mesh, sub-mesh models and the KTGF for solid-phase viscosity computation.
ACKNOWLEDGEMENTS
This work was supported by FAPESP (Fundação de Amparo a Pesquisa do Estado de São Paulo) through doctoral and postdoctoral scholarships for the first author (processes 98/13812-1 and 02/12038-8).
NOMECLATURE
List of Symbols
CDs drag coefficient for a single particle in an infinite
medium (-)
dp particle diameter, (m)
g gravity acceleration, (m/s2)
G solid elasticity modulus (N/m2)
P gas pressure (Pa)
Res Reynolds number based on
particle diameter (-)
Rg ideal gas constant, (kJ/kgK)
t time, (s)
vg and vs control volume average
velocities, (m/s)
β interface drag function, (kg/m2s)
µ dynamic viscosity, (kg/ms)
αg and αs volumetric fractions (-)
ρg and ρs densities, (kg/m
3 )
σ standard deviation (-)
τg and τs viscous stress tensors, (Pa)
φs particle sphericity (-)
Subscripts
(g) and (s) gas and solid phases
(k) gas or solid phase
REFERENCES
Agrawal, K., Loezos, P.N., Syamlal, M. and Sundaresan, S., The Role of Meso-Scale Structures in Rapid Gas-Solid Flows, Journal of Fluid Mechanics, 445, 151 (2001).
Büssing, W. and Reh, L., On Viscous Momentum Transfer by Solids in Gas-Solids Flow through Risers, Chemical Engineering Science, 56, 3803 (2001).
Cabezas-Gómez, L. and Milioli, F.E., A Parametric Study of the Gas-Solid Flow in the Riser of a Circulating Fluidized Bed Through Continuous Eulerian Modeling, Powder Technology, 132, 216 (2003a).
Cabezas-Gómez, L. and Milioli, F.E., A Parametric Study of the Gas-Solid Flow in the Riser of a Circulating Fluidized Bed Through Continuous Eulerian Modeling, Submitted to Chemical Engineering Science (2003b).
Cabezas-Gómez, L. and Milioli, F.E., Gas-Solid Two-phase Flow in the Riser of Circulating Fluidized Bed: Mathematical Modeling and Numerical Simulation, Brazilian Journal of Mechanical Engineering, 19, No. 3, 271 (2001). Chen, Y-M., Jang, C-S., Cai, P and Fan, L-S., On the
Formation and Disintegration of Particle Clusters in a Liquid-Solid Transport, Chemical Engineering Science, 46, No. 9, 2253 (1991). Davidson, J.F., Circulating Fluidized Bed
Di Felice, R., The Voidage Function for Fluid-particle Interaction Systems, International Journal of Multiphase Flow, 20, No. 1, 153 (1994).
Ding, J. and Gidaspow, D., A Bubbling Model Using Kinetic Theory of Granular Flow, AIChE Journal, 36, No. 4, 523 (1990).
Enwald, H., Peirano, E. and Almstedt, A.-E., Eulerian Two-phase Flow Theory Applied to Fluidization, International Journal of Multiphase Flow, 22, (Suppl.), p. 21 (1996).
Ergun, S., Fluid Flow through Packed Columns, Chemical Engineering Progress, 48, No. 2, 89 (1952).
Gidaspow, D., Multiphase Flow and Fluidization: Continuum and Kinetic Theory Descriptions. Academic Press, Boston (1994).
Harris, A.T., Davidson, J.F. and Thorpe, R.B., The Prediction of Particle Cluster Properties in the Near Wall Region of a Vertical Riser (200157), Powder Technology, 127, No. 2, 128 (2002).
Helland, E., Occelli, R. and Tadrist, L., Numerical Study of Cluster Formation in a Gas-Particle Circulating Fluidized Bed, Powder Technology, 110, 210 (2000).
Helland, E., Occelli, R. and Tadrist, L., Computational study of Fluctuating Motions and Cluster Structures in Gas-Particle Flows, International Journal of Multiphase Flow, 28, 199 (2002).
Hoomans, B.P.B., Kuipers, J.A.M. and Van Swaaij, W.P.M., Granular Dynamics Simulation of Cluster Formation in Dense Riser Flow. 3rd International Conference on Multiphase Flow, Lyon, France (1998).
Horio, M. and Clift, R., A Note on Terminology: 'Clusters' and 'Agglomerates', Powder Technology, 70, 196 (1992).
Horio, M. and Kuroki, H., Three-Dimensional Flow Visualization of Dilutely Dispersed Solids in Bubbling and Circulating Fluidized Beds, Chemical Engineering Science, 49, 2413 (1994). Jayaswal, U., Hydrodynamics of Multiphase Flows:
Separation, Dissemination and Fluidization. Ph.D. diss., Illinois Institute of Technology, Chicago (1991).
Johnsson, F., Zijerveld, R.C., Schouten, J.C., van den
Bleek, C.M. and Leckner, B., Characterization of Fluidization Regimes by Time-series Analysis of Pressure Fluctuations, International Journal of Multiphase Flow, 26, No. 4, 663 (2000).
Lackermeier, U., Rudnick, J., Werther, J., Bredebusch, A. and Burkhardt, H., Visualization of Flow Structures Inside a Circulating Fluidized Bed by Means of Laser Sheet and Image Processing, Powder Technology, 114, 71 (2001). Luo, K.M., Dilute, Dense-Phase and Maximum
Solids-Gas Transport. Ph.D. diss., Illinois Institute of Technology, Chicago (1987).
Ouyang, J. and Li, J., Discrete Simulations of Heterogeneous Structure and Dynamic Behavior in Gas-solid Fluidization, Chemical Engineering Science, 54, 5427 (1999).
Sanyal, J. and Cesmebasi, E., On the Effect of Various Momentum Transfer Coefficient Models on Bubble Dynamics in a Rectangular Gas Fluidized Bed, Chemical Engineering Science, 49, No. 23, 3955 (1994).
Sharma, A.K., Tuzla, K., Matsen, J. and Chen, J.C., Parametric Effects of Particle Size and Gas Velocity on Cluster Characteristics in Fast Fluidized Beds, Powder Technology, 111, 114 (2000).
Tsukada, M., Ito, M., Kamiya, H. and Horio, M., Three-Dimension Imaging of Particle Clusters in Dilute Gas-Solid Suspension Flow, The Canadian Journal of Chemical Engineering, 75, 466 (1997). Tsuo, Y., Computation of Flow Regimes in
Circulating Fluidized Beds. Ph.D. diss., Illinois Institute of Technology, Chicago (1989).
Tsuo, Y.P. and Gidaspow, D., Computation of Flow Patterns in Circulating Fluidized Beds, AIChE Journal, 36, No. 6, 885 (1990).
Tuzla, K., Sharma, A.K., Chen, J.C., Schiewe, T., Wirth, K.E. and Molerus, O., Transient Dynamics of Solid Concentration in Downer Fluidized Bed, Powder Technology, 100, 166 (1998).
van Wachem, B.G.M., Schouten, J.C., van den Bleek, C.M., Krishna, R. and Sinclair, J.L., Comparative Analysis of CFD Models of Dense Gas-solid Systems, AIChE Journal, 47, No. 5, 1035 (2001). Wen, C.Y. and Yu, Y.H., Mechanics of Fluidization,