Design of an adsorbent employing activated carbon
fiber to remove lead
www.scielo.br/eq www.ecletica.iq.unesp.br
Volume 32, número 3, 2007
C. Cárdenas-López1, G.. Camargo1, L. Giraldo2, J.C.Moreno-Piraján3*
1 Faculty of Engineering, Department of Chemical Engineering. Universidad de Los Andes, Bogotá – Colombia.
2 Faculty of Sciences, Department of Chemistry, Universidad Nacional de Colombia. 3 Faculty of Sciences, Department of Chemistry, Research Group of Porous Solids and Calorimetry,
Universidad de Los Andes, Bogotá, Colombia
Abstract: Zorflex® activated carbon fibers (ACF), reference FM100 198B, are used before and after an oxidizing procedure with H
3PO4 to study the adsorption of Pb
2+. The point of
zero charge was determined for the modified and unmodified fiber giving values of 2.3 and 4.3, respectively. After oxidizing the ACF, the fiber showed to have a greater Pb2+ adsorption
capacity in comparison with the unmodified fiber, which is related with the acid sites increase, where lead was mainly adsorbed. Determination of the BET area was carried out by nitrogen physisorption at 77K. ACFs presented superficial areas between 1000 and 1500 m2/g showing
mostly, a microporous structure. The preliminary design of an adsorbent using the modified fiber is presented where the fiber superior physicochemical properties over the unmodified one are observed.
Keywords: isotherms; activated fibers; adsorbent; ion Pb2+
Introduction
During the last decades, new alternatives and technologies showing adequate characteristics to reduce environmental pollution to a very low final level have been developed. Lead has been one of the most common contaminant target present in water streams and air. Alternatives such as the use of granular activated carbon (GAC), powdered activated carbon (PAC) and activated carbon fiber (ACF) have been widely implemented due to the increasing demand of this type of materials. Activated carbon fibers are one of the called “new materials” and, because of their characteristics, have been used for a wide range of applications, as in operation of air conditioning systems, in personal protection, for removing VOCs (benzene, acetone, dichloromethane, n-hexane, acrylonitrile, etc.) [1, 3] and, in the chemical industry, for the protection of wounds by semi-permeable band
aids that do not allow micro organisms access [1-10]. Activated carbon fibers offer several advantages in comparison with GACs and PACs. The ACF porous structure is mainly constituted by micropores, while other presentations of activated carbons have a complex structure formed by micropores, mesopores and macropores. The diameters of the ACFs are smaller (10-40 μm) than the sizes of GAC and PAC particles, providing a larger adsorption rate. Another advantage of the ACFs is that the distance among fibers may be controlled by selecting the precursor material to allow ACFs to be packed in bed fixed adsorbents.
In the same way, ACFs are excellent adsorbents due to their low pressure drop, high contact efficiency and flexibility, lightness and malleability. Additionally, they possess high porosity and consequently, huge superficial areas (950-1550 m2/g), twice of
to adsorb elevated compounds quantities, as the above mentioned.
To design a efficient adsorption system, it is required to know the fundamental principles of the procedure of adsorption, of the material, the mass transfer rates, the transitions of the used bed, the changes produced as a consequence of the time and space during the adsorption process and the fiber behavior at equilibrium with the fluid phase, its saturation process and chemical and mechanical stability [1-39].
In the present work, it is presented the preliminary design of an adsorbent with different kinds of ACF´s, for which lead adsorption isotherms on different kinds of ACFs are determined and the influence of the superficial characteristics of the fibers on the ACFs adsorptive capacity are studied.
Experimental details Raw material
The Zorflex® fibers it has the advantages of having 100 % activate and 100 % carbon, faster adsorption kinetics, higher purity vapour uptake, smaller filtration beds and textile type properties.
Zorflex® fibers can also be impregnated with a range of chemicals of enhance the chemisorption capacity for selected gases.
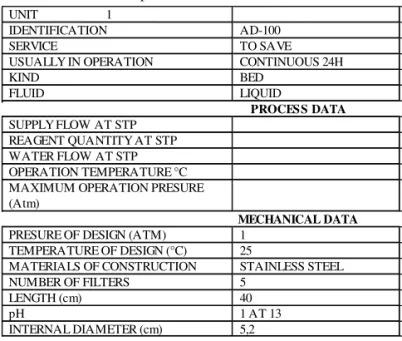
UNIT 1
IDENTIFICATION AD-100
SERVICE TO SAVE
USUALLY IN OPERATION CONTINUOUS 24H
KIND BED
FLUID LIQUID
PROCESS DATA
SUPPLY FLOW AT STP REAGENT QUANTITY AT STP WATER FLOW AT STP OPERATION TEMPERATURE °C MAXIMUM OPERATION PRESURE (Atm)
MECHANICAL DATA
PRESURE OF DESIGN (ATM) 1 TEMPERATURE OF DESIGN (°C) 25
MATERIALS OF CONSTRUCTION STAINLESS STEEL NUMBER OF FILTERS 5
LENGTH (cm) 40
pH 1 AT 13
INTERNAL DIAMETER (cm) 5,2
The unmodified raw material showed to have low resistance to the tension with a crack load average of 0.011 KN and thickness of 0.60375 mm. The modified fiber showed an average of 0.022 KN and thickness of 0.589 mm. When compared to the Jean fiber, used in the textile industry, the raw fiber showed low resistance to cracking. Although not suitable for textiles, as an adsorbent these values are probably suitable.
Table 1. Adsobent specifications.
Tests of Resistance
To the raw material, tests of mechanical resistance (tension) were carried out following the ASTM D5034 guideline. The crack load and thickness were determined by a preliminary analysis applied to four samples using an INSTROM and a LINEAR GAUGE BENSOR, respectively.
Impregnation with H3PO4 of the Activated Carbon Fibers
ACFs (Zorflex® fibers, ref. FM100 198B) were oxidized through a procedure similar to the one reported by Bandosz et al. [39]. In a 1L beaker, 20g of ACF and 500
mL of a 15% (v/v) H3PO4 solution, prepared
with concentrated H3PO4 and deionised
Afterwards, the solution was cooled down and filtered. The ACF was then washed several times using deionised water until the pH of the water was constant at 6. Finally, the ACF was dried on a stove at 110 ºC for 24 h and was kept inside a dried and closed container.
Determination of the aqueous isotherms: Concentration vs. Lead adsorption time
Data were obtained for given quantity of fiber in a 250 mL erlenmeyer containing
the Pb2+ solution of known concentration. The
system was weighted at that point. The solution was thermostated and the solution was periodically stirred. At predefined time intervals, different samples of the solution were
taken and the Pb2+ concentration was read
by atomic absorption spectrophotometry using a PERKIN ELMER, model ANALYST 300 through a calibration curve previously prepared. The fiber and the solution
were left in contact until the lead (Pb2+)
concentration in the fluid phase was constant. At predefined time intervals, different samples
of the solution were taken and the Pb2+
concentration was read by atomic absorption spectrophotometry using a PERKIN ELMER, model ANALYST 300 through a calibration curve previously prepared.
Determination of Adsorption Isotherm in Aqueous Solution
ACFs were washed with distilled water to remove dust attained dust and dried at 110°C for 24 h. Afterwards, different quantities of fibers were submerged in lead solution at different concentrations and pH adjustment using 0.01 M HCl and NaOH solutions was performed every hour. Finally, samples from the solutions were taken after 24, 48 and 72 h and measured by atomic absorption spectrophotometry using a PERKIN ELMER, model ANALYST 300.
Determination of Active Sites
The concentration of active sites in the fibers was determined by the acid-base titration method proposed by Boehm [26]. Acid sites were neutralized with a 0.1 M NaOH standard solution and the basic sites with a 0.1 M HCl standard solution. The
active sites were determined gauging a 50 mL erlenmeyer with 0.1 M neutralizing solution and adding approximately 0.2 g of fiber. After three days, 10 mL aliquots were taken from the solution to determine acid sites by titration using 0.1 M NaOH was accomplished. Similarly, the basic sites were determined using 0.1 M HCl as titration agent.
Determination of Point of Zero Charge
The point of zero charge of the fiber (PZC) was determined through a process quite similar to the one reported by Babic et al [9]. In an erlenmeyer, 0.1 g accurately weighted of fiber and 20 mL of a 0.01M KCl and 0.004 M KOH solution were added. The solution was kept under stirring for 48h and the titration solution (0.1 M HCl) was slowly added, recording the added volume and the pH of the solution. On the other hand, the same procedure was carried out without using the fiber. The titration was achieved in accordance with the recommendations made by Leyva et.al. [7].
Characterization of the ACFs. N2 Adsorption Isotherms at 77K.
Surface area and pore distribution were determined by the BET (Brunauer, Emmet and Teller) and DFT (Density Functional Theory) methods, respectively using a physisorption equipment QUANTACHROME INSTRUMENTS, model Autosorb 3B.
Breakage curves
Breakage curves were obtained by the same procedure alike to the one reported by Amaya, et al. [17-22].
Results and discussion Characterization of the fibers Raw material
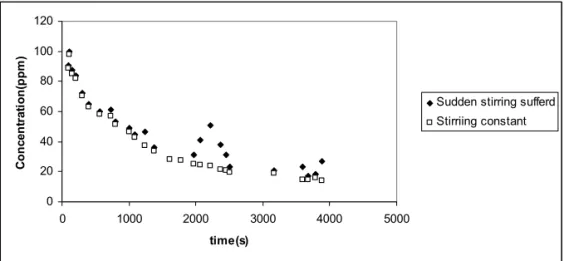
In Figure 1 the Pb2+ adsorption
some equilibrium perturbation by the sudden stir. The same figure also shows the curve with continuous stirring for comparison. This period allowed us to establish the experimentation time for the adsorption isotherms in aqueous solutions, point of zero charge and active sites.
Figure 1.Curve of Concentration vs. Time for Lead Adsorption on Fiber.
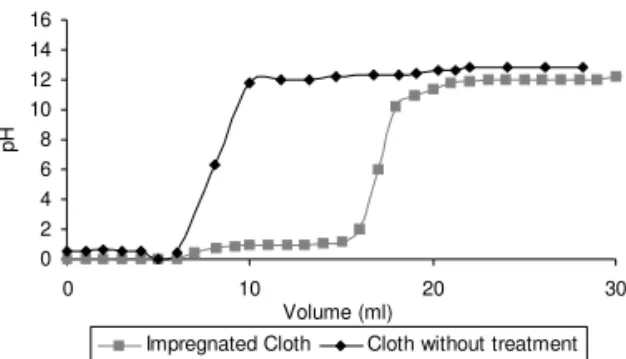
Point of Zero Charge
As an amphoteric material, carbon surface displays groups of acid and basic character that control its behaviour in accordance with the medium. The carbons atoms of the basal plane edges may be combined in variable proportions with different heteroatoms, generating diverse superficial groups as shown in Figure 2. Most of these groups are oxygenated due to the tendency of the carbons to oxidize even at room temperature.
In the Figure 3, the schematic representation of the acid character of some oxygenated groups (carboyls, hydroxyls an lactones) and of the oxygenated groups (pyrone, quinine and chromene type) is show. [7]
Figure 2. Schematic representation of the main superficial groups present on a carbon.
The acid and basic groups concentrations are equal in the point of zero charge and therefore the material is neutral. In order to achieve the maximum adsorption od certain pollutants, the carbon surface chemistry may be changed. The PZC of the ACFs was determined by plotting the pH of the solution against the volume of the titrating solution in the presence and in the absence of ACF. The pH where these two curves intercept corresponds to the PZC.
Figure 3. Oxygenated Groups (acid and basic character)
The PZC of the modified and unmodified fibers may be seen in figures 4 and 5. The obtained values, 4.3 and 3.2, respectively, show that both types of ACF have an acid character, weaker than the one reported by Rangel Mendez [43]. On the other hand, the PZC of the modified fiber is more acid than the one of the unmodified fiber and this is due to the higher proportion of acid
0 20 40 60 80 100 120
0 1000 2000 3000 4000 5000
time(s)
C
onc
e
nt
ra
ti
o
n(
ppm
)
sites than basic sites because the treatment
using H3PO4 introduced carboxylic groups.
The fact that the curves cross twice ( 4.3 and ~2.0) in the unmodified ACF means
that the ACF impregnated with H2PO4
increase of acid groups.
0 2 4 6 8 10 12
0 1 2 3 4
Volume (ml)
pH
without Cloth Whith cloth
Figure 4. Point of zero charge (PZC) of the
unmodified fiber.
0 2 4 6 8 10 12
0 1 2 3 4
Volume (ml)
pH
With Cloth modified whitout cloth
Figure 5. Point of zero charge (PZC) of the modified
fiber.
Acid and basic sites
The curves obtained from the determination of acid and basic sites for the unmodified fiber are shown in figures 6 and 7.
0 5 10 15
0 5 10 15 20 25
Volume (ml)
pH
Cloth whitout treatment Impregnated Cloth
Figure 6. Acid Sites of the unmodified and
impregnated fiber.
0 2 4 6 8 10 12 14 16
0 10 20 30
Volume (ml)
pH
Impregnated Cloth Cloth without treatment
Figure 7. Basic Sites of the unmodified and
impregnated fiber.
In figure 6, solutions of unmodified and impregnated fibers when they were titrated with NaOH are shown in a comparative way. It may be seen that with impregnation, fibers present higher quantity of acid groups than the unmodified fibers. This titration of graph, show that the acid of the impregnated fiber is weaker than the one of the unmodified ACF. When adding NaOH, this compound reacts with the acid sites of the ACF giving volume values of 10 and 13 mL for the unmodified and modified ACF, respectively. More volume on the impregnated fiber is required due to the greater acid sites concentration because of the treatment with phosphoric acid.
In Figure 7, it may be seen that the chemical treatment produces a slight slope depression indicating the presence of basic groups of weak character on the ACF surface. When adding HCl, this compound reacts with the basic sites of the ACF giving volume values of 6 and 16 mL for the unmodified and modified ACFs, respectively.
Figure 8. Active Sites Concentrations on ACFs.
0 0,2 0,4 0,6 0,8 1 1,2 1,4 1,6 1,8
Tela virgen Tela impregnada
C
onc
e
nt
ra
ti
on (
g
/m
l)
Finally, in Figure 8 the concentration of the active sites of the unmodified and impregnated ACFs are shown. It is be observed that the concentration of acid sites is slightly greater than the basic ones for both ACFs. These acid and basic sites concentrations are larger for the impregnated fiber because the chemical oxidation with
H3PO4 increases the concentration of acid
sites.
The concentrations of acid sites are 0.55 meq/g and 0.86 meq/g for the unmodified and the impregnated fiber, respectively and the concentration of basic sites are 0.52 meq/ g and 0.77meq/g, respectively, indicating that the ACFs surface is slightly acid.
The results show that the acid treatment does not modify strongly the superficial groups content of ACF.
It may be seen that the isotherms from aqueous solutions fit to the Lagmuir´s model.
Adsorption Isotherms from Aqueous Solution.
Experimental data from the
isotherms of Pb2+ adsorption on the ACFs
fitted using Langmuir’s and Freunlich’s models [11], mathematically represented as:
(5)
(6)
It may be seen that the isotherms from aqueous solutions fit to the Langmuir’s model, and that the ACFs produced I-type isotherms
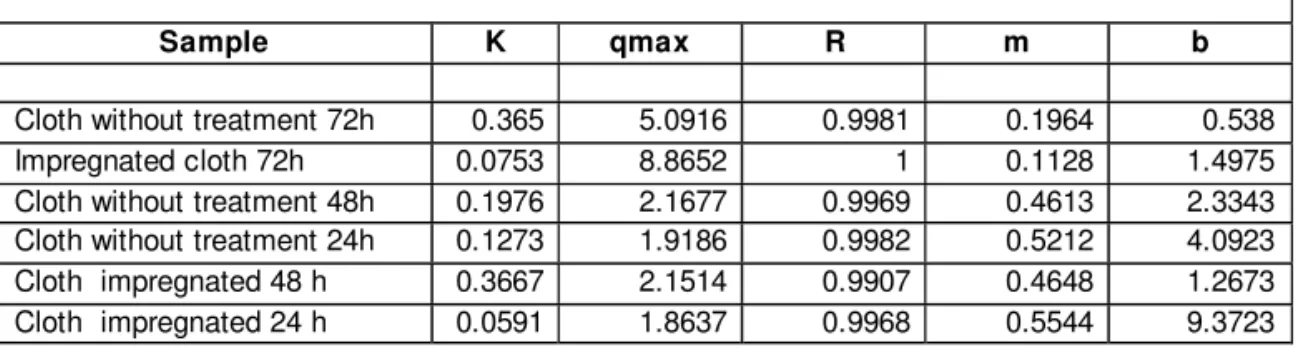
Sample K qmax R m b
Cloth without treatment 72h 0.365 5.0916 0.9981 0.1964 0.538
Impregnated cloth 72h 0.0753 8.8652 1 0.1128 1.4975
Cloth without treatment 48h 0.1976 2.1677 0.9969 0.4613 2.3343
Cloth without treatment 24h 0.1273 1.9186 0.9982 0.5212 4.0923
Cloth impregnated 48 h 0.3667 2.1514 0.9907 0.4648 1.2673
Cloth impregnated 24 h 0.0591 1.8637 0.9968 0.5544 9.3723
Figure 9. Isotherms from Aqueous Solution for the Pb2+ adsorption for different conditions.
Adsorption isotherms from Pb2+
aqueous solutions on unmodified and modified ACFs with adjusting pH to 5.0 and temperature at 25°C are shown in Figure 9. It may be seen that the impregnated ACF has greater adsorption capacity than the
unmodified ACF. The Pb2+ metallic cations in
aqueous solutions adsorb more on the ACF acid sites and the major acid sites are the carboxylic, phenolic and lactonic [11]. This explains the previous result since the impregnated ACF has a greater acid sites concentration compared with the unmodified ACF.
It is important to note that the pH of the solution plays an outstanding role on the
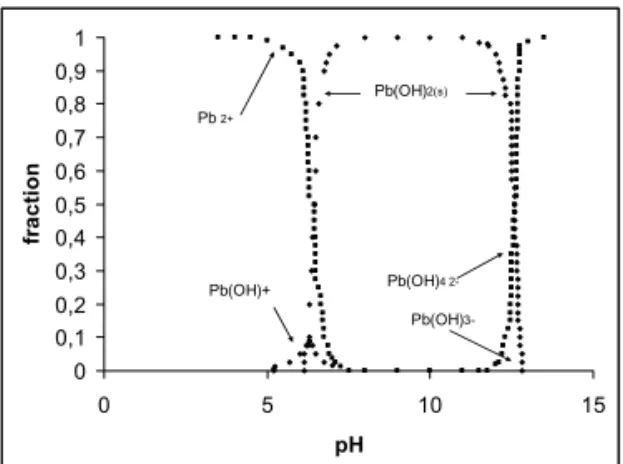
Pb2+ adsorption, the employed pH was taken
from the lead speciation curve shown in Figure 10. It is considered that this pH change slightly modifies the results from figure 9 [29].
0 2 4 6 8
1,5 21,5 41,5 61,5 81,5 101,5 121,5 141,5 161,5
Concentration (ppm)
q
(
m
g
P
b
ad
so
rb
ed
/g
clo
th
)
Cloth without treatment Cloth Impregnated Cloth impregnated Cloth whitout treatment Impregnated Cloth Cloth impregnated
Table 2. Parameters of fit to the model Langmuir´s
Figure 10. Lead Speciation Curve
Also, it can be observed that the
capacity of the ACF for adsorbing Pb2+
increases when they are oxidized with H3PO4
solution. The adsorption increase is due to the augment of the acid sites concentration during the oxidation and to the fact that lead is mainly adsorbed on these.
N2 Adsorption Isotherms
The surface area and the pore volume and average diameter are exhibited in the following figures for the unmodified and modified ACFs. These calculations were made through the BET and DFT methods.
Isotherm
260,9 276,7 292,5 308,3 324,1 339,9 355,7 371,5 387,3 403,1
0,0000 0,2000 0,4000 0,6000 0,8000 1,0000
Relative Pressure P/Po
V
o
lu
m
e
c
c
/g
l
A B
Figure 11. N2 Adsorption isotherm for the unmodified and impregnated ACF.
In figure 11, the N2 Adsorption
isotherms at 77K for the unmodified and modified fibers are shown. In accordance to the IUPAC classification (International Union of Pure and Applied Chemists) classification,
the obtained isotherms are I-type and these are characteristic of the microporous solids, where filling of the smaller pores at very low pressures takes place. In figure 11-A, a small hysteresis cycle makes evident the presence of other pores different on the ACFs.
The surface areas of the unmodified
and modified ACFs are 962m2/g and 1014
m2/g, respectively. The fiber, once is
impregnated with phosphoric acid causes an increase in the superficial area and this is attributed to the oxidation process since involves a series of chemical reactions that eliminates some of the functional groups on the carbonaceous planes increasing the free space.
In Figure 12, the ACFs pore distribution by the DFT method is shown. The pore size distribution of the analyzed ACFs makes evident that these fibers are essentially supermicroporous suggesting, indicating that most of the pore volume is enclosed in pores with diameters smaller between 0.8nm and 2.0 nm.
From fig. 12-A, it may be seen that the pore volume of the impregnated fiber is greater than the one of the unmodified fiber due to the increase of contact time with
H3PO4 solution. This increases the quantity
of produced microporosity because there is a greater action from the activante material and a pore uncovering due to the reactions between the impregnant agent and the ACFs.
DFT Pore Volume Histogram
0,0000 0,0076 0,0152 0,0228 0,0304 0,0380 0,0456 0,0532 0,0608 0,0684
5 20 35 50
Pore Width (A)
Po
re
Vo
lu
m
e
c
c
g
l
Figure 12. Pore distribution for unmodified and modificated for ACF
0 0,1 0,2 0,3 0,4 0,5 0,6 0,7 0,8 0,9 1
0 5 10 15
pH
fr
act
io
n
Pb 2+
Pb(OH)2(s)
3-Breakage Curves
For the interpretation of the solid-liquid interaction, it is necessary to take into account the adsorbate diffusion in the adsorbent particles. Fick’s law is applied:
J= -D(c)dc/dx
Where J represents the adsorbent flux per unit of time and area, D(c) corresponds to the diffusion coefficient, c is the concentration of the liquid phase in the adsorbent pores and x is the spatial coordinate.
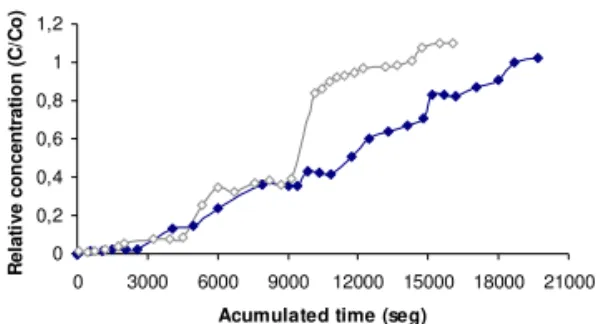
0 0,2 0,4 0,6 0,8 1 1,2
0 3000 6000 9000 12000 15000 18000 21000
Acumulated time (seg)
R
el
at
ive
co
n
cen
trat
io
n
(
C
/C
o
)
Figure 13. Breakage Curves for modificated (A) and unmodified (B) for fiber.
As it may be seen in the figure 13, the concentrations of a fluid phase inside an ACF fixed bed varies proportionally varies with the change of position of the saturation front in the bed and with the time; the differences that appear between ACF treated and without treatment must fundamentally to the acid treatment. Once the fluid comes into contact with the fixed bed, most part of the mass transfer takes place near to the bed entrance. After a while, the solid becomes saturated and most part of the matter transfer takes place far from the entrance. Also, it can be observed that the impregnated fiber is a better adsorbent than the unmodified one because the saturation time is higher.
Scaling breakage curve for impregnated fiber.
The length of the mass transfer depends on the velocity of matter transfer, the velocity of the flow and the shape of the
equilibrium curve. The scale change of adsorbents is generally carried out from laboratory assays in a bed of small diameter that works with the same particle size and superficial velocity.
To make the scaling calculations, the breakage curve of the fiber impregnated with
H3PO4 was used. An influent of 90.29 ppm
in a burette with a capacity of 50 mL and a length of 14 cm was employed. The purpose is to achieve a scaling to a 40 cm long column. For the beginning times of the breakage curve, the output concentration is practically zero. Frequently, the breakage point is taken as a relative concentration of 0.05 or 0.1 and since only the last portion of treated fluid has the highest concentration, the solute fraction separated from the beginning to the breakage point is usually 0.95 or higher. Whether the adsorption continues beyond the breakage point, the concentration would increase quickly to approximately 0.5.
Values of uo of 0.2 cms-1, of ñ
TCA of
0.012 g cm-3 and Co of 4.366 x 10⁻⁷ mol
Pb2+ cm-3 were found.
Concentrations near 0.05 and 0.95
are going to afford breakage time, tb of
1538.18 s and saturation time, ts of 10403.19
s.
The solute transference velocity, FA was
calculated as 0.001074 mol Pb2+ s-1 and the
breakage and saturation capacities as qb =
1.57 mg.g-1 and q
s = mg. g-1 . The time when
C/Co reaches the value of 0.5, t* is 7215.61 s.
From these values, the Lengh without Using of the Bed, LUB, was found as 11.02
cm. The breakage time in these case, tb2 is
14958.54 s.
0 0,2 0,4 0,6 0,8 1 1,2
0 5000 10000 15000 20000 25000 30000
Accum ulate d time (seg )
R
e
la
tiv
e
c
o
n
c
e
n
tr
a
ti
o
n
(
C
/C
o
)
Scaling breakage c urve Impregnated cloth
Figure 14. Curves of experimental breakage and
scaling.
The design of the adsorbent is in Fi-gure 15.
Figure15. External and internal part of the
adsorbent
Conclusions
The characterization of ACF by by nitrogen physisorption indicated surfaces areas between 1000 and 1500 m2/g and that
ACFs area mainly microporous materials. The pores of the ACFs are mainly microporous. The area of the impregnated ACF increases during the oxidation. The points of zero charge for the unmodified and modified fibers are 4.3 and 2.3, respectively, these are area acid due to the fact that ACFs have a larger concentration of acid than basic sites. The modified fiber became more acidic after the oxidation.
The impregnated ACFs presented a larger Pb2+ adsorption capacity than the
unmodified ACF which is associated with the slight modification of groups by the acid treatment. The breakage curves allowed the appropriate adsorbent scaling. The breakage curve of the impregnated ACF was used for the design because it showed to have better
physicochemical properties than the unmodified ACF.
An adsorbent preliminary design was made using the breakage curves, with a length of 40 cm and a diameter of 5.2 cm. It is an experimental design that suggests that, in the future, a scaled version may be used.
Acknowledgements
The authors wish to thank the Master Agreement established between the “Universidad de Los Andes” and the “Universidad Nacional de Colombia” and the Memorandum of Understanding entered into by the Departments of Chemistry of both Universities.
Received 23 May 2007 Accepted 05 September 2007
References
[1] M. P. Cal, M.J. Rood, S.M. Larson, Gas. Sep. Purif. 10 (2) (1996) 110.
[2] H. Chen-Chia, H. L. Yann L, L. Fang, Separation science and technology. 34 (4) (1999) 550.
[3] H. Pignon, C. Brasquet, P. Le Cloirec, Water Science and Technology. 42 (2000), 355.
[4] P. Kunwar, D. Mohan, G.S. Tandon, G.S.D Gupta, Environmental Chemistry division, Industrial toxicology Research Centre (2002) 2480.
[5] J.M. Martín. Adsorción Física de gases y vapores por carbones. Alicante, primera edición, 1990 18-32.
[6] F. Rouquerol, J. Rouquerol, K. Sing. Adsorption by powders and porous solids. Principles, methodology and applications. Academic Press, 1999, Chap 4-6.
[8] C. Moreno Castilla. Eliminación de contaminantes orgánicos de las aguas mediante adsorción en materiales de carbón. Granada, primera edición 2001, Cap. 1. [9] B.M Babic, S.M. Milojic, M.J. Polovina, B.V. Kaludjerovic, Carbon. 37 1999. [10] C.F. Estévez Mújica, J.C. Moreno-Piraján. E.M. Vargas, Rev. Ingeniería, Universidad de los Andes. 23 (2005) 63. [11] Z. Reddad, C. Gerente, Y. Andres, P.
Le Cloirec, Environ. Sci. Technol. 36 (2002)
2242.
[12] M.M. Johns, W.E. Marshall, C.A. Toles, J. Chem. Technol. Biotechnol. 71 (1998) 131.
[13] Z. Reddad, C. Gerente, Y. Andres, P.
Le Cloirec, Environ. Sci Technol. 36 (2002)
2067.
[14] S. Al-Asheh, F. Banat, Adsorpt. Sci. Technol. 18 (2000) 685.
[15] T. Vaughan, C.W. Seo, W.E. Marshall, Bioresource Technol. 78 (2001) 133 [16] J.W. Kim, M.H. Sohn, D.S. Kim, S.M. Sohn, Y.S. Kwon, J. Hazard. Mater. 85 (2001) 301.
[17] N. Yalcin, V. Sevinc, Carbon. 38 (2000) 1943.
[18] G. Bello, R. Cid, R. Garcia, R. Arriagada, J. Chem. Technol. Biotechnol. 74 (1999) 904.
[19] B.S. Girgis, L.B. Khalil, T.A.M. Tawfik, J. Chem. Technol. Biotechnol. 61 (1994) 87. [20] B. Saha, M.H. Tai, M. Streat, Institution of Chemical Engineers Trans. Icheme. 81, (2003) 1343.
[21] E. Demirbas, M. Kobya, E. Senturk, T. Oskan, Water SA. 30 (2004) 533. [22] S. Al-Asheh, Z. Duvnjak, Adv. Environ. 1 (1997) 194.
[23] P.A. Brown, S.A. Gill, S.J. Allen, Water Res. 34 (2000) 3907.
[24] T. Viraraghavan, M.M. Dronamraju, J. Environ. Sci. Health. 28 (1993) 1261. [25] Y.S. Ho, G. McKay, Water Res. 34 (2000) 735.
[26] H.P. Boehm, Carbon. 32 (1994) 759. [27] Z. Reddad, C. Gerente, Y. Andres, M.C. Ralet, J.F. Thibault, P. Le Cloirec Carbohydr. Polym. 49 (2002) 23.
[28] R. Machado, J.R. Carvalho, J.N. Correia, J. Chem. Technol. Biotechnol. 77 (2002) 1340.
[29] S. Al-Asheh, F. Banat, R. Al-Omari, Z. Duvnjak, Chemosphere 41 (2000) 659. [30] G. Vazquez, J. Gonzalez Alvarez, S. Freire, M. Lopez Lorenzo, G. Antorrena, Bioresource Technol. 82 (2002) 247. [31] V. Gloaguen, H. Morvan, J. Environ. Sci. Health, 32 (1997) 901.
[32] http://www.oviedo.es/personales/ carbon/c.activo/mpqcat.htm; tomado de Ángel Menedez, Junio 2007.
[33] M. Ajmal, R.A.K. Rao, S. Anwar, J. Ahmad, R. Ahmand, Bioresource Technol. 86 (2003) 147.
[34] R.E. Wing, Ind. Crops Prod. 5 (1996) 301.
[35] M.O. Bagby, N.M. Widstrom, in S. A. Watson and P. E. Ramstad (Eds.), Corn: Chemistry and Technology, American Association of Cereal Chemists Inc., St. Paul, MN, USA, 1987. p. 575.
[36] R.E. Wing, D.J. Sessa, J.L. Willet, in R. P. Overend and E. Chornet (Eds.), Making a Business from Biomass in Energy, Environmental, Chemicals, Fibers and Materials, Vol. 2, Elsevier Science, Oxford, UK, 1997, p. 1015.
[37] D.J. Sessa, R.E. Wing, in D.J. Sessa and J. Willett (Eds.), Paradigm for Successful Utilization of Renewable Resources. AOCS Press, Champaign, IL, 1998, p. 232. [38] A.C. Texeira, Y. Andres, P. Le Cloirec, Environ. Sci. Technol. 33 (1999) 489. [39] T.A. Bandosz, J. Jagiello, C. Contescu, J.A. Schwarz, Carbon. 31 (1993) 1193. [40] C.A. Leon y Leon, L.R. Radovic, in P.A. Thrower (Ed.), Chemistry and Physics of Carbon, Vol. 24, N.Y. Marcel Dekker, 1994, p. 213.
[41] C. Moreno-Castilla, M.V. Lopez-Ramon, F. Carrasco-Marin, Carbon. 38 (2000) 1995.
[42] W.E. Marshall, L.H. Wartelle, D.E. Boler, C.A. Toles, Environ. Technol. 21 (1999) 601.
[44] R. Leyva-Ramos, L.A. Bernal-Jacome, J. Mendoza-Barron, L. Fuentes-Rubio, R.M. Guerrero- Coronado, J. Hazard. Mater. 90 (2002) 27.
[45] R. Leyva-Ramos, J.R. Rangel-Mendez, J. Mendoza-Barron, L. Fuentes-Rubio, R.M. Guerrero- Coronado, Water Sci. Technol. 35 (7) (1997) 205.
[46] J.R. Rangel-Mendez, Adsorption of Toxic Metals from Water Using Commercial and Modified Granular and Fibrous Activated
Carbons, Ph. D. Thesis, Loughborough University, U.K, 2001.
[47] W.E. Marshall, L.H. Wartelle, A.Z. Chatters, Ind. Crops Prod. 13 (2001) 163. [48] D.D. Do, Adsorption Analysis: Equilibria and Kinetics, Imperial College Press, Singapore, 1998, p. 17.