*e-mail: [email protected]
Synthesis of TiO
2by the Pechini Method and Photocatalytic Degradation of Methyl Red
Pollyana Caetano Ribeiroa*, Ana Cristina Figueiredo de Melo da Costaa,
Ruth Herta Goldschmidt Aliaga Kiminamib, José Marcos Sasakic, Hélio Lucena Liraa
aDepartment of Materials Engineering, Federal University of Campina Grande – UFCG,
Av. Aprígio Veloso, 882, Bodocongó, CEP 58429-140, Campina Grande, PB, Brazil
bDepartment of Materials Engineering, Federal University of São Carlos – UFSCar, Rod. Washington Luis,
Km 235, CEP 13565-905, São Carlos, SP, Brazil
cDepartment of Physics, Federal University of Ceará – UFC, CEP 60455-970, Fortaleza, CE, Brazil
Received: July 7, 2012; Revised: September 17, 2012
This work evaluated the catalytic activity of TiO2 synthesized by the Pechini method. with varying molar ratios of 2:1, 3:1 and 4:1 of citric acid/metallic cations, in the photocatalytic degradation of methyl red dye in aqueous solution. The samples were characterized by X-ray diffraction, phase quantification by Rietveld structure refinement, and textural analysis by nitrogen adsorption, and their photocatalytic performance was bench- tested. The results indicated that the 3:1 and 4:1 samples contained two phases, with 84.4 and 89% of anatase phase and 15.6 and 11% of rutile phase, respectively. The 2:1 sample contained only anatase phase. The total discoloration of methyl red dye in 24 hours confirmed the high photocatalytic efficiency of the 2:1 sample, which was ascribed to the formation of monophasic anatase.
Keywords: photocatalysis, methyl red dye, titanium dioxide, Pechini method
1. Introduction
Titanium dioxide is one of the engineered nanomaterials most frequently used because it can serve two distinct functions: absorption and scattering of ultraviolet (UV) radiation and/or semiconductor photocatalysis activated by UV radiation1,2. As a UV reflecting agent it is found
in a variety of applications, including sunscreens, paints, and coatings, where it serves in a protective role3. The
photocatalytic ability of nano-TiO2 is used in photovoltaic devices and self-cleaning or self-sterilizing product coatings2. Additionally, as a photocatalytic agent, nano-TiO
2
could be useful for degrading environmental pathogen-contaminated drinking water4,5.
TiO2 has been the material most widely studied and used in many photocatalysis applications because of its strong oxidizing abilities for the decomposition of organic pollutants, superhydrophilicity, chemical stability, long durability, non-toxicity, and transparency to visible light6.
The photocatalytic properties of TiO2 derive from the photogeneration of charge carriers (electrons and holes) that occurs upon the absorption of ultraviolet (UV) light in the band gap of 3.2 eV7. The photogenerated holes in the valence
band diffuse on the TiO2 surface and react with adsorbed
water molecules, forming hydroxyl radicals (•OH)8. The
photogenerated holes and hydroxyl radicals oxidize adjacent to organic molecules on the TiO2 surface. Meanwhile, electrons in the conduction band participate in reduction processes, typically reacting with molecular oxygen in the air to produce superoxide radical anions (O2•-).
Titanium oxide presents three different crystallographic forms: anatase, rutile and brookite. The anatase and rutile phases are used in heterogeneous photocatalysis. The literature about the photocatalytic activity of TiO2 is controversial due to the polymorphousness of materials and the conditions and type of synthesis employed in the preparation of TiO2, which can promote one or more phases. Some researchers assert that the anatase phase is more efficient in the photocatalytic degradation process9.
However, the activation of anatase phase requires high
energy and is achieved by UV irradiation4. On the other
hand, other researchers report that small amounts of rutile present with anatase in TiO2 heighten its photocatalytic efficiency, which, allied to other factors such as high surface area, contributes to increase the effectiveness of the photocatalytic degradation process10,11.
It is therefore important to choose a suitable synthesis method to ensure the formation of the desired phase with specific characteristics such as high surface area, nanometric particle size and mesoporosity, which can activate photocatalysis.
The Pechini method stands out among several chemical synthesis methods because it allows for the use of different temperatures and proportions of citric acid and metallic cations, enabling controlled particle and/or agglomerate stoichiometry and morphology, compositional homogeneity, and low toxicity to produce a monophasic nanometric powder12-14. In the Pechini method the reaction is hydrolytic
of carboxylic acid, chelating agent, and metallic matrix, followed by its polyesterification with an excess of polyalcohol15. The reactants usually employed in this
application are citric acid and glycol ethylene16.
In this work, TiO2 photocatalyst was prepared by the Pechini method, with varying molar ratios of citric acid to metallic cations of 2:1, 3:1 and 4:1. The samples were characterized and subjected to a photocatalytic degradation reaction of methyl red.
2. Experiments
The sample TiO2 of nanopowder was prepared with
titanium isopropoxide IV Ti[OCH(CH3)2]4 97% PA, monohydrate citric acid (C6H8O7.H2O) 99.5% PA and glycol ethylene (C2H6O2) 99.5% PA.
Three samples of TiO2 were prepared by the Pechini method12 in citric acid/metallic cation molar ratios of 2:1, 3:1
and 4:1. First, titanium citrate was prepared by reacting citric acid with titanium. The reactants were mixed under constant stirring for 24 hours at 80 °C until a homogeneous system was formed. Glycol ethylene was then slowly added to citric acid to reach a mixture of 40/60 w/w. This mixture was then heated to 100 °C, resulting in a resin which was pyrolyzed at 400 °C for 1 hour, at a heating rate of 10 °C/min. The pyrolyzed material was disagglomerated in a mortar, sifted through an ABNT 200 (74 µm) mesh sieve, and calcined at 500 °C for 1 hour, applying a heating rate of 10 °C/min.
The samples were characterized by X-ray diffraction in a Shimadzu XRD 6000 diffractometer using CuKα radiation with λ = 1.5418 Å, operating at 40 kV and 30 mA. The
measurements were taken in the range of 15° to 85° (2θ) with a step size of 0.02o (2θ). Samples of 2 g of mass were
pretreated under vacuum at 200 °C for 6 hours, followed by a textural analysis by nitrogen/helium adsorption developed by Brunauer, Emmett and Teller (BET). The 40-point nitrogen absorption isotherms were measured with a Quantachrome NOVA 3200e analyzer. Using this technique, the average particle size was also determined by Equation 117.
6 BET
BET
D
D
S
=
× (1)
where,
• DBET = equivalent spherical diameter (nm); • D = True density (g.cm–3);
• SBET = surface area (m2.g–1).
The pore volume and pore diameter were determined
bythetheorydevelopedbyBrunauer,JoynerandHalenda (BJH).
The phases were identified using Shimadzu PMGR software and the JCPDF database. The structural parameters were refined by the Rietveld method18 using the DBWS-9807
graphical interface to quantify the phases in the TiO2 samples. The crystallite size of all the crystallographic planes was calculated by Scherrer’s equation (Equation 2)19.
hkl k D
cos λ =
β θ (2)
where k is the coefficient of the shape of the reciprocal lattice
point (0.9 to 1.0), λ is the wavelength of the radiation to be
utilized (1.54 Å), βisthewidthathalfpeakheight(FWHM),
and θ is the angle of diffraction.
The catalytic activity of all the samples was evaluated based on a photocatalytic degradation reaction using methyl red solution (20 mg.L–1). To this end, 1 g.L–1 of each sample
was immersed in 200 mL of this solution under constant stirring and subjected to UV-C radiation (λmax = 280 nm and 60 W) using four 15 W low-pressure mercury-vapor lamps. The mixtures were placed at a distance of 12 cm from the UV-C source. The photocatalytic performance of the samples was evaluated in a reactor operating for 24 hours.
3. Results and Discussion
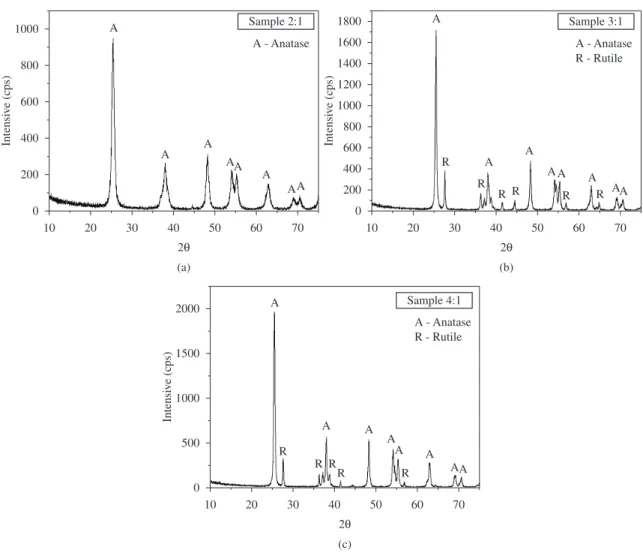
Figure 1 depicts the X-ray curves of the TiO2 samples prepared by the Pechini method. As can be seen, the 2:1 sample presented formation of primary phase anatase (ICDD 84-1286), while the 3:1 and 4:1 samples presented anatase phase and traces of rutile as secondary phase (ICDD 88-1172). According to the literature, rutile phase is formed at high temperatures (≈1000 °C), while anatase phase is formed at lower temperatures close to 450 °C20. The
formation of anatase phase was found to be favored by a low ratio of citric acid to metallic cation, and increasing this ratio favored the formation of rutile phase at temperatures lower than those reported in the literature.
The citric acid molecule can play the role of a polydentate ligand, which has an α-hydroxyl group, an
α-carboxyl group and two β-carboxyl groups, adding seven donor sites that can coordinate metallic ions. This can favor the formation of several types of titanium coordination21.
From the thermodynamic standpoint, the chelating effect is caused mainly by the increase in entropy associated with the formation of polydentate compounds. This occurs due to the formation reaction in which each polydentate ligand substitutes at least two monodentate ligands, increasing the number of ions, molecules or free radicals. Thus, increasing the citric acid concentration in the samples may have promoted the formation of intermediate structures that can favor the formation of rutile phase at low temperatures. Table 1 describes the quantities and crystallite sizes (Dc) of the phases in TiO2 samples prepared by the Pechini method in citric acid/metallic cation ratios of 2:1, 3:1 and 4:1. The crystallite sizes correspond to the main planes of the family of crystallographic planes {hkl}.
The crystallite size of sample 2:1 was smaller than 20 nm, indicating the formation of anatase nanoparticles. It was found that increasing the citric acid/metallic cation ratio generally caused the crystallite size of the anatase phase to increase. In Table 1, note that samples 3:1 and 4:1 present rutile and anatase phase, with the rutile phase not exceeding 20%.
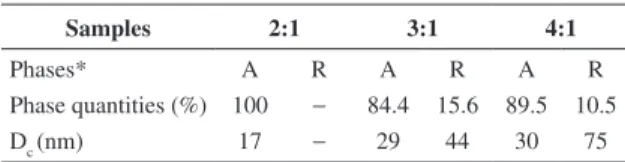
Table 1. Phase quantities and crystallite sizes (Dc).
Samples 2:1 3:1 4:1
Phases* A R A R A R
Phase quantities (%) 100 − 84.4 15.6 89.5 10.5
Dc (nm) 17 − 29 44 30 75
Intensi
ve (cps)
1000
800
600
400
200
0
A
A A
AA A
AA
10 20 30 40 50 60 70
2θ
Intensi
ve (cps)
1800 1600 1400 1200 1000
800 600 400 200 0
A
A A
AA A
AA
10 20 30 40 50 60 70
2θ
R
R
R R R R
A - Anatase Sample 2:1
A - Anatase Sample 3:1
R - Rutile
(a) (b)
Intensi
ve (cps)
2000
1500
1000
500
0
A
A A
A
A A
AA
10 20 30 40 50 60 70
2θ
R R R
R R
A - Anatase Sample 4:1
R - Rutile
(c)
Figure 1. XRD curves of TiO2 samples containing citric acid/metallic cation ratios of (a) 2:1, (b) 3:1 and (c) 4:1.
Table 2. Textural properties of TiO2 samples prepared by the Pechini method.
Textural properties
Samples
2:1 3:1 4:1
SBET (m2.g–1) 52.14 49.11 84.03
VP (cm3.g–1) 0.076 0.065 0.028
RP (Å) 19.39 19.39 19.43
DBET* (nm) 36.90 29.72 17.37
*Calculated from BET surface area.
reported by Li et al.23, who prepared TiO
2 by the alcohothermal
method,andalsotothosereportedbyHussainetal.9, who
prepared TiO2 nanoparticles for application as a photocatalyst for the photocatalytic degradation of ethylene.
Figure 2 shows the kinetic curves (C/Co vs. t) of the photocatalytic degradation of methyl red dye, with and without the presence of the TiO2 catalyst prepared by the Pechini method.
In Figure 2, note the discoloration of the dye in the presence of all the TiO2 samples after 24 hours of reaction. This is due to the radiation wavelength used in this work Table 2 lists the values of surface area (SBET), pore radius
(RP), pore volume (VP) and particle size (DBET) of the TiO2 samples prepared by the Pechini method. To calculate the particle size from the BET results required first estimating the density of the mixture of phases based on the results of the phase quantification by Rietveld refinement.
A comparison of the results in Table 2 for the 2:1 and 3:1 samples indicated that the surface area of these samples decreased as the citric acid/metallic cation ratio increased. This may have been due to the increase in the formation of rutile phase, which has a more tightly packed tetragonal crystalline structure, in which each octahedron is coordinated with 10 neighboring octahedral, while each octahedron in the anatase phase is with coordinated with 8 neighboring octahedral. On the other hand, among the samples with rutile as secondary phase, the 4:1 sample showed the largest estimated surface area, which is consistent with the low DBET values, indicating a low degree of particle agglomeration in this sample. The nitrogen adsorption-desorption isotherms indicated that all the samples were mesoporous, with ink-bottle pores and an average pore radius of 19 Å. This mesoporosity
was also reported by Nguyen-Phan et al.22, who prepared TiO 2
(280 nm), which corresponds approximately to the required activation energy of TiO2 (anatase), with a band gap of 3.23 eV7. Consequently, the best reactions were obtained
with the 2:1 sample, which contained only anatase as a pure crystalline phase.
The superior performance of anatase phase over that of rutile phase in the photocatalytic process was not clear.
However,thisbehaviorwastentativelyattributedtothree
factors: i) the rutile phase cannot adsorb O2, which is important in capturing electrons in the conduction band, reducing the electron-hole pair recombination rate; ii) the band gap energy of the anatase phase (3.23 eV) is higher than that of the rutile phase (3.02 eV), contributing to increase the probability of electron-hole pair recombination; and iii) the anatase phase presents higher-order quantum results, favoring the high density of active sites on the surface24,25.
Among the TiO2 samples containing a combination of anatase and rutile phases, the photocatalytic activity was found to be proportional to the anatase phase in the sample. Therefore, the 4:1 sample containing 89.5% of anatase phase showed a better performance than the 3:1 sample, which contained a lower percentage of this phase (84.4%) and hence lower catalytic activity. In addition, the high specific surface area of 84.03 m2.g–1 of the 4:1 sample may have
favored the high charge separation, inhibiting electron-hole recombination and favoring its performance.
Yang et al.10 prepared TiO
2 by the sol-gel method using
different heat treatments, and investigated its performance as a photocatalyst of methyl orange degradation. These authors
observed the presence of anatase as the single phase after 2 hours of treatment at a temperature of 500 °C, and anatase and rutile phase after 2 hours at 650 °C. The results of the photocatalysis indicated that the performance of biphasic TiO2 was slightly lower than that of the monophasic TiO2, with the former showing an efficiency of 80% and the latter of 85%. A comparison of the results of our work with those reported by the aforementioned authors indicates that each method of synthesis produces different characteristics in TiO2, which likely explains the formation of one or more phases. Melian et al.25 obtained TiO
2 by the sol-gel
method, followed by hydrothermal treatment to evaluate its photocatalytic activity in the degradation of phenol compared to Degussa P25 TiO2. Their results indicated that the sample calcined at 600 °C and containing 84% anatase phase and 16% rutile phase with particle sizes of 29 and 39 nm, respectively, was more efficient in degrading phenol than the commercial TiO2 Degussa P25.
In general, it was found that both monophasic and biphasic samples presented satisfactory photodegradation efficiency. It was assumed that photocatalytic performance is affected not only by the type of phase in the TiO2 sample but also by the method of synthesis and the type of dye employed.
4. Conclusions
The Pechini method proved efficient for the preparation of nanometric and mesoporous TiO2 samples. The TiO2 catalyst presented good performance in the photocatalytic
degradationofmethylreddye.However,thephotocatalytic
activity proved to be dependent on the anatase content in the samples, which explains the higher photocatalytic activity of the sample with a citric acid/metallic cation ratio of 2:1 containing pure anatase phase. As for the 4:1 sample, its high specific surface area of 84.03 m2.g–1 was probably the reason
for its better photocatalytic performance than that of the 3:1 sample, which also contained a trace amount of rutile phase.
Acknowledgements
The authors gratefully acknowledge the Brazilian research funding programs and agencies CNPq (Process no. 402561/2007-4), PROCAD/NF-CAPES, PRO-Engenharia CAPES, NANOBIOTEC and INCT-INAMI for their financial support of this work. We are also indebted to the Federal University of Ceará (UFC) for allowing the use of its X-ray laboratory, and the Federal University of Rio de Janeiro (UFRJ/COPPE) for the photocatalytic tests.
Figure 2. Photocatalytic degradation curves of methyl red dye.
References
1. Fujishima A, Rao TN and Tryk DA. Titaniun dioxide photocatalysis. Journal of Photochemistry and Photobiology C: Photochemistry Reviews. 2000; 1(1):1-21. http://dx.doi.or
g/10.1016%2FS1389-5567%2800%2900002-2
2. Kwon S, Fan M, CooperAT andYang H. Photocatalytic applications of micro- and nano-TiO2 in environmental engineering. Critical Reviews in Environmental Science and Technology. 2008; 38:197-226. http://dx.doi. org/10.1080%2F10643380701628933
3. Klaine SJ,Alvarez PJ, Batley GE, Fernandes TF, Handy RD, Lyon DY et al. Nanomaterials in the environment:
behavior, fate, bioavailability, and effects. Environmental Toxicology and Chemistry. 2008; 27:1825-1851. http://dx.doi.
org/10.1897%2F08-090.1
4. Prasad GK, Agarwal GS, Singh B, Rai GP and Vijayaraghavan R. Photocatalytic inactivation of Bacillus anthracis by titania nanomaterials. Journal of Hazardous Materials. 2009; 165(1-3):506-510. http://dx.doi.
org/10.1016%2Fj.jhazmat.2008.10.009
of synthesis temperature and precursor vapor concentration.
Journal Powder Technology. 2012; 215-216:195-199. http://
dx.doi.org/10.1016%2Fj.powtec.2011.09.047
6. Nakata K and Fujishima A. TiO2 photocatalysis: design and applications. Journal of Photochemistry and Photobiology C: Photochemistry Reviews.2012; 13:169-189. http://dx.doi.
org/10.1016%2Fj.jphotochemrev.2012.06.001
7. Fujishima A, Zhang X and Tryk DA. TiO2 photocatalysis and related surface phenomena. S u r f a c e S c i e n c e Reports. 2008; 63(12):515-582. http://dx.doi.org/10.1016%2Fj.
surfrep.2008.10.001
8. FujishimaA,HashimotoKandWatanabeT.TiO2 Photocatalysis:
Fundamentals and Applications. Tokyo: BKC; 1999. 174 p. 9. Hussain R, Ceccarelli DL, Marchisio FD and Russo NG.
Synthesis, characterization, and photocatalytic application of novel TiO2 nanoparticles. Chemical Engineering Journal. 2010; 157:45-51. http://dx.doi.org/10.1016%2Fj.
cej.2009.10.043
10. Yang H, Zang, K, Shi R, Li X, Dong X andYuY. Sol-gel synthesis of TiO2 nanoparticles and photocatalytic degradation of methyl orange in aqueous TiO2 suspensions. Journal of Alloys and Compounds. 2006; 413:302-306. http://dx.doi. org/10.1016%2Fj.jallcom.2005.06.061
11. LuisAM, Neves MC, Mendonça MH and Monteiro OC. Influence of calcination parameters on the TiO2 photocatalytic properties. Materials Chemistry and Physics. 2011; 125:20-25. http://dx.doi.org/10.1016%2Fj.matchemphys.2010.08.019 12. Pechini MP. Method of preparing lead and alkaline earth
titanates and niobates and coating method using the same to form a capacitor. US Patent 3.330.697, 1967.
13. Ding X, Liu Y, Gao L and Guo L. Correlation between anatase-to-rutile transformation and growth in nanocrystalline titanium powders. Journal of Alloys and Compounds. 2008; 458(9):346-350. http://dx.doi. org/10.1016%2Fj.jallcom.2007.03.110
14. Gama L, Ribeiro MA,Adillis MCS, Kiminami RHGA, Weber IT and Costa ACFM. Synthesis and characterization of the NiAl2O4, CoAl2O4 and ZnAl2O4 spinels by the polymeric precursors method. Journal of Alloys and Compounds. 2009; 483(1-2):453-455. http://dx.doi.
org/10.1016%2Fj.jallcom.2008.08.111
15. Zaki T, Kabel KI and Hassan H. Using modiied Pechini method to synthesize α-Al2O3 nanoparticles of high surface area.Ceramics International. 2012; 38(6):4861-4866. http://
dx.doi.org/10.1016%2Fj.ceramint.2012.02.076
16. XuY,Yuan X, Huang G and Long H. Polymeric precursor synthesis of Ba2Ti9O20. M a t e r i a l s C h e m i s t r y a n d Physics.2005; 90:333-338. http://dx.doi.org/10.1016%2Fj.
matchemphys.2004.10.022
17. Reed JS. Principles of Ceramics Processing.3rd ed. New York:
Ed. John Wiley; 1938. p.127.
18. Bleicher L, Sasaki JM and Santos COP.Development of a graphical interface for the Rietveld refinement program DBWS.
Journal of Applied Crystallography. 2000; 33:1189-1190. http://dx.doi.org/10.1107%2FS0021889800005410
19. KlungHandAlexanderL.X-ray diffraction procedures. New York: Wiley; 1962. p. 491.
20. LuisAM, Neves MC, Mendonça MH and Monteiro OC. Influence of calcination parameters on the TiO2 photocatalytic properties. Materials Chemistry and Physics Materials Chemistry and Physics. 2011; 125:20-25.
21. Wenzhang L, Li J, Wang X, Li J and Chen Q. Effect of citric acid on photoelectrochemical properties of tungsten trioxide films prepared by the polymeric precursor method. Applied Surface Science. 2010; 256(23):7077-7082. http://dx.doi.
org/10.1016%2Fj.apsusc.2010.05.030
22. Nguyen-PhanTD,PhamHD,KimS,OhE-S,KimEJandShin EW. Surfactant removal from mesoporous TiO2 nanocrystals by supercritical CO2 fluid extraction. Journal of Industrial and Engineering Chemistry. 2010; 16(5):823-828. http://dx.doi. org/10.1016%2Fj.jiec.2010.05.005
23. LiY, Xiuguo S, Li H, Wang S and WeiYU. Preparation of anatase nanoparticles with high thermal stability and specific surface area by alcohothermal method. Powder Techology. 2000; 194:149-152. http://dx.doi.org/10.1016%2Fj.
powtec.2009.03.041
24. Litter M. Heterogeneous photocatalysis (Review).Applied Catalysis B: Enviromental. 1999; 23:89-114. http://dx.doi.or g/10.1016%2FS0926-3373%2899%2900069-7