a pH optode baSed on tHymol blue:
appliCation to determination of Co
2uSing
floW injeCtion analySiS SyStem
M.D.P.T. Sotomayor1,*, I.M. Raimundo Jr.2, J.J. R. Rohwedder2 and G. Oliveira Neto3
1. Instituto de Química; Unesp – Araraquara – São Paulo – Brasil 2. Instituto de Química; Unicamp – Campinas – São Paulo – Brasil 3. Secretaria Municipal de Educação – Campinas – São Paulo – Brasil Corresponding author: Maria Del Pilar Taboada Sotomayor - IQ – UNESP
Araraquara, SP - Brazil. e-mail: [email protected]
abstract: An optode based on thymol blue (TB), an acid-based indicator, has been constructed and evaluated as a detector in FIA system for CO2 determination. The dye was chemically immobili-sed on the surface of a bifurcated glass optical fibre bundle, using silanisation in organic media.
In FIA system, hydrogen carbonate or carbonate samples are injected in a buffer carrier solution,
and then are mixed with phosphoric acid solution to generate CO2, which diffuses through a PTFE membrane, in order to be collected in an acceptor carrier fluid, pumped towards to detection cell, in which the optode was adapted. The proposed system presents two linear response ranges, from 1.0 x 10⁻³ to 1.0 x 10⁻² mol l-1,and from 2.0 x 10⁻² to 0.10 mol l-1. The sampling frequency was 11 sample h-1, with good repeatability (R.S.D < 4 %, n = 10). In flow conditions the optode lifetime was 170 h. The system was applied in the analysis of commercial mineral water and the results obtained in the hydrogen carbonate determination did not differ significantly from those obtained by potentiometry, at a confidence level of 95 %.
Keywords: CO2, FIA, thymol blue, silanisation, pH-optode.
1 - introduCtion
Quantiication of carbon dioxide is an im
-portant parameter in areas such as medicine, envi-ronmental and industrial process [1,2], principally due to its important role in animal and plants meta-bolism and in the process of photosynthesis. Thus, measurement in vivo or in real time of blood PCO2 in intensive care units is considering an essential parameter in monitoring, diagnosis, and treatment
of critically ill patients subject to surgery [1,2].
In the atmosphere the CO2 presence is the result of plant respiration (production) and photosyn-thesis (consumption). However, human activities, such as heading systems, transportation, industrial
combustion, etc., and natural phenomenas, such as burning and degradation of biomass or volca-nic eruptions, are responsible for much higher le-vels of this gas in some regions [3]. In this sense, CO2 analysis is considered an essential element of environmental research [2]. CO2 determination is also vital in many biochemical industries, where it serves for the process control. The continuous analysis of the fermentation process on line is cri-tical for high product yields, minimal unwanted metabolic by products and an overall optimised control strategy [2].
With the aim of CO2 determination, nume-rous analytical procedures are known in gases and
by spectrophotometry based on pH-indicator sys-tems [4], turbidimetric method [5] and infrared (IR) spectrometry [6,7]. Generally, these metho-dologies are fast and produces reliably quantita-tive results. However, they are expensive, bulky and not very much robust.
It is enough notorious than in all process for determination of CO2, measurements in continuous form will be very convenient. In this
aspect, low systems become powerful tools; prin
-cipally due to they are simple, reliable and allow a high sample throughput. For the other hand, che-mical sensors are excellent devices for coupled in
low systems.
Between, the chemical sensors,
that based on optical ibres, are usually sensiti
-ve, robust, cheap and easily miniaturised [8], also the optical sensors offer the possibility of remote, continuous, multianalyte analysis in low volume locations [2]. Thus, for the CO2 determination numerous optodes have been developed. Since
those reported by Zhujun and Seitz [9] and Optiz
and Lübbers [10] in 1984, based on Severinghaus electrode [11]. In these optodes [12-19], the CO2 molecules diffuse through a hydrophobic membra-ne, which separates the sodium bicarbonate buffer internal solution from the sample, the carbon dio-xide is converted to HCO3- in the internal solution, changing its pH, which one is followed by using
colorimetric or luorescent pH indicators. Howe
-ver, the greater problems in these optodes are the internal solution use to detect the pH variations, and the type of membrane used to separate the in-ternal and the analysed solutions. Consequently, these CO2 optodes present limited lifetime and
long response times [17] dificult their coupling in low systems.
Due to the drawbacks presented by the op-todes based on Severinghaus principle, gradual
conigurations have been proposed in order to ob
-tain optodes with response times suitable for use
in low systems, and also to avoid the use of the
internal bicarbonate solution.
In the pairing method [6,7,20-24], ion-pair between a pH indicator and a phase transfer such as tetraoctylammonium hydroxide is entrap-ment in a layer of hydrophobic material such as si-licone, permeable to CO2 but not for H+ [25]. The-se optodes show extremely fast responThe-se times,
when applied in gas phase measurements, but in liquid phase the sensor should be covered with a permeable membrane for the continuous and pro-longed use [2].
Other conigurations including the
development of ilms sensors for CO2
[26-29]; coupled the ibre optic in low cell contai
-ning the indicator in solution [30] and copolyme-rised the dye in polymeric matrices [31]; or still immobilising polysiloxane directly on the glass
optical ibre [32].
Previously, we report [33,34] optodes for pH measurements, constructed immobilised che-mically acid–base indicators in a bifurcated
boro-silicate optical ibre bundle using the silanisation
procedure in organic media. These optodes were
evaluated in several low systems showed respon
-se times and lifetime satisfactory for its u-se in these systems [33], and evaluated in the indirect determination of oxalate in food samples, which the CO2 generated by the enzymatic reaction be-tween oxalic acid and oxalate oxidase [34], was satisfactorily monitored.
Despite of the numerous optodes reported in literature, still exist the necessity to developed new experimental procedures for CO2 determina-tion. In this sense, this work describe the results obtained in the evaluation of the performance of a pH optode based on thymol blue (TB) acid-based dye, chemically immobilised on the glass optical
ibre through silanisation, in the indirect determi
-nation of CO2, as an alternative to the other exis-ting methods.
2 - experimental
2.1 - reagents and Solutions
For the construction of the pH optode, nitric acid (Merk), ethanol (Nuclear), o-Xylene (Mallin-ckrodt), 3-aminopropyl-triethoxysilane (Aldrich) and thymol blue (Synth), were used. o-Xylene was previously dried overnight with anhydrous Na2SO4 before using in the silanisation.
2.2 - Construction of tb optode
The optode was constructed as previous-ly described [33,34], by employing a bifurcated
borosilicate optical ibre bundle (5 mm diameter),
made with ibres of 70 µm i.d. The surface of the
common end of the optical ibre bundle was ini
-tially treated with ethanol, nitric acid and ethanol, and allowed to dry at room temperature. Then, the silanisation was carried out by introducing the common end of the bundle into a 5.0 % (v/v) 3-aminopropyl-triethoxysilane in o-xylene. After this step, the silanised common end was rinsed with o-xylene, in order to eliminate any excess of silane, then with ethanol, to clean off the sol-vent, and allowed to dry at room temperature. The immobilisation of the dye was done by introdu-cing the common end of the bundle into a 0.04 % (w/v) TB solution, containing 8.6 x 10⁻⁴ mol l-1 NaOH, and rinsed with deionised water. After all
this steps the tip of the optical ibers showed an
intense purple colour, indicating that the immobi-lisation was successful.
2.3 - instrumentation
The instrumentation employed in this work consisted of a radiometric source (Oriel 6883), with a quartz-halogen lamp (12 V, 100 W), whose radiation was modulated at 200 ± 2 Hz by means of an optical chopper (Oriel 75152) and focused onto
one arm of the optical ibre bundle. The modula
-ted light source was guided to the common end of
the optical ibre, where the TB was immobilised.
The relected radiation was focused onto the en
-trance slit of a monochromator (Oriel 77250) and detected by a photomultiplier tube (Oriel 77340),
connected to a lock-in ampliier (Stanford Resear
-ch System SR 510), provided with a pre-ampliier
(Stanford Reasearch System SR 552). The lock-in
ampliier was synchronised to the frequency of the
optical chopper. A PC-AT 486 microcomputer was employed to control the monochromator and the
lock-in ampliier, through an electronic interface
(ADLink ACL-811). Software was written in Mi-crosoft VisualBasic 3.0 to perform these tasks.
2.4 - flow manifold and procedure
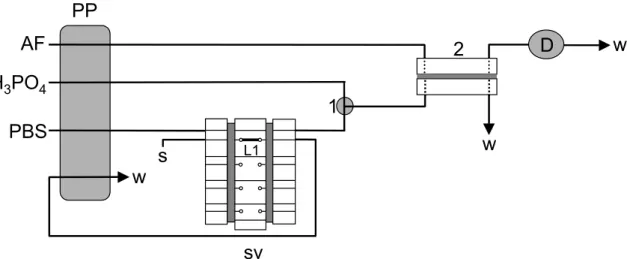
The low manifold was assembled as sho
-wn in Figure 1. Was employing a peristaltic pump (Ismatec IPC8), furnished with tygon tubes to propel the solutions. In the FIA system, hydrogen
carbonate or carbonate samples were injected into
a 0.1 mol l-1 phosphate buffer at pH 7.6 stream (PBS), using a sliding central bar sampling val-ve [35], and then were mixed with a phosphoric acid solution, in order to generate CO2. The CO2 diffused through a PTFE (Black Swam MFG. Co.) membrane placed in the gas diffusion cell “2” [36], and was collected by an adequate acceptor
luid, which was continuously pumped towards to
detection system “D”, that include the TB
opto-de. The change of the pH in the acceptor luid,
causes a colour change of the TB immobilised on
the optical ibre bundle, generating a variation in the relectance intensity, which was proportional
sample was injected directly into the FIA system, and the reflectance intensity variation was
PP
sv
AF
H
3PO
4PBS
s
w
w
1
L1
D
w
2
figure 1. Schematic diagram of the low manifold. PP, peristaltic pump; AF, acceptor luid; PBS, phosphate buffer solution; s, sample; L1, loop of sampling; sv, sampling valve;1, mixture point; 2, gas diffusion cell; D, detection system and w, waste.
2.5 - determination of hydrogen carbonate in mi-neral water samples
Six commercial mineral water samples col-lected in the Campinas city (São Paulo – Brazil) were analysed, in which the total concentration of hydrogen carbonate was determined. Each sample
was injected directly into the FIA system, and the relectance intensity variation was monitored. The
concentration of hydrogen carbonate in the sample was determined by interpolation, employing the analytical curve obtained with NaHCO3 standards solutions. These results were compared with those obtained by potentiometric titration [37], using a pH-meter (Micronal B374) equipped with a glass electrode. The hydrogen carbonate titration in the samples was carried out used a 0.0100 mol l-1 HCl standard solution.
3 - reSultS and diSCuSSion
3.1 - Characteristics of the thymol blue optode
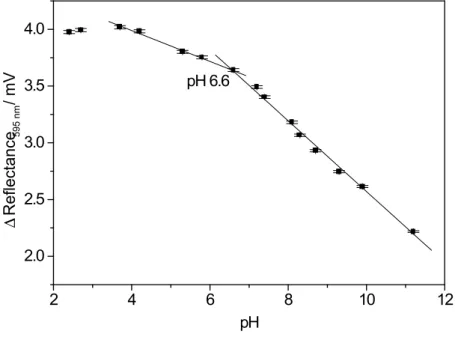
Thymol blue (TB) was chosen due to its aqueous solution presents two pH regions of co-lour change (from 1.2 to 2.8 and from 8.0 to 9.6). On the other hand, studies carried out by Gonçal-ves et al. [4] have demonstrated the eficiency of the TB dye in aqueous solution for CO2 determi-nation, using FIA system and spectrophotometric detection. When TB was immobilised in a optical
ibre bundle, the pH optode presented two linear
response ranges, allowing to detect pH changes from 4.0 to 11.0 as showed in Figure 2. It is a good result, because generally, optodes based on acid-base dyes presented a response range of two pH units or pKa ± 1. This peculiar proile of the TB optode can be probably explained considering the TB dye characteristics, which presents two-pH range of colour change in aqueous solutions. The extended ranges can be attributed to the chemi-cal immobilisation of the colorimetric reagent on
different sites of the optical ibre bundle surface,
bon-ded to the optical ibre, resulting in groups with different pKa´s and, therefore, extending the linear pH range.
2 4 6 8 10 12
2.0 2.5 3.0 3.5 4.0
pH 6.6
∆
Reflectance
595 nm
/ mV
pH
figure 2. TB optode response proile as pH function.
3.2 - optimisation of the fia system
In the determination of the CO2 with the proposed FIA system, parameters such as composition,
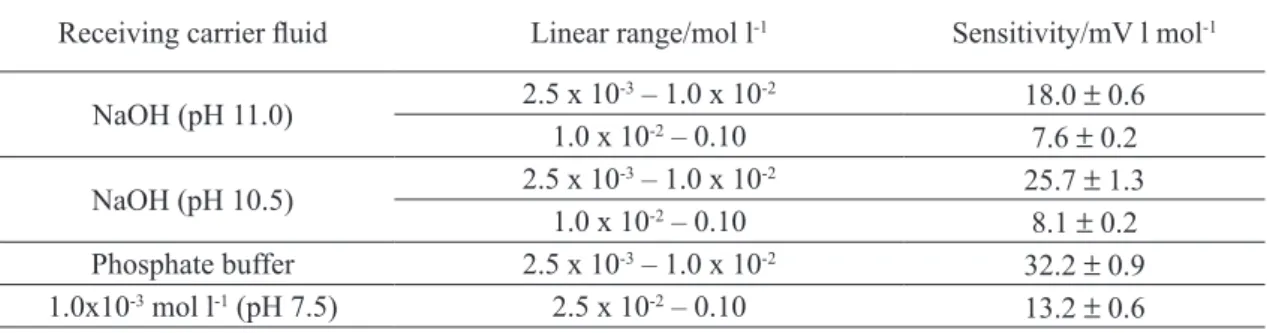
pH and concentration of the acceptor luid (AF) have important effects on the sensitivity and linear response range of the method. Thus, was carry out a study on different acceptor luids. Solutions of
table 1. Characteristics of the low system as a function of pH and acceptor luid composition (ionic strength adjusted at 0.05 mol l-1 with NaCl).
Receiving carrier luid Linear range/mol l-1 Sensitivity/mV l mol-1
NaOH (pH 11.0) 2.5 x 10
-3 – 1.0 x 10⁻² 18.0 ± 0.6
1.0 x 10⁻² – 0.10
7.6 ± 0.2
NaOH (pH 10.5) 2.5 x 10
-3 – 1.0 x 10⁻² 25.7 ± 1.3
1.0 x 10⁻² – 0.10 8.1 ± 0.2 Phosphate buffer 2.5 x 10⁻³ – 1.0 x 10⁻² 32.2 ± 0.9 1.0x10⁻³ mol l-1 (pH 7.5) 2.5 x 10⁻² – 0.10 13.2 ± 0.6
Vi = 1.0 ml; low rate = 2.9 ml min-1 ; acid solution = 0.1 mol l-1 H
3PO4.
The effect of the acceptor luid ionic strength on the FIA system performance was evaluated.
This study was carried out because is known that optodes constructed using acid-base dyes are sensitive to variation of ionic strength leading to incorrect results [38]. In this study, the ionic strength of the
acceptor luid was adjusted in 0.01, 0.05 and 0.10 mol l-1 with NaCl. The analytical curves showed in
Figure 3 indicate that the ionic strength adjusted to 0.01 mol l-1 provides the best results, mainly for the
more diluted range.
0.00 0.02 0.04 0.06 0.08 0.10
0.0 0.5 1.0 1.5
NaCl 0.01 mol l-1 NaCl 0.05 mol l-1
NaCl 0.10 mol l-1
∆
Reflectance
595 nm
/ mV
[CO2] / mol l -1
figure 3. Analytical curves obtained in the study carried out to evaluate the inluence of the ionic strength of receiving carrier luid in the FIA system response.
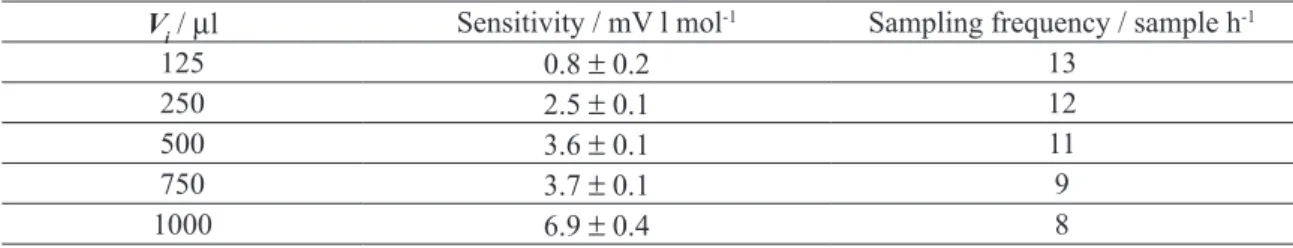
In Table 2 are shows the FIA system characteristics as a function of injected volume (Vi) of
table 2. Sensitivities and sampling frequencies obtained in the linear range from 2.5 x 10⁻² to 0.10 mol l-1, as function of the injected volume(V
i).
V
i / µl Sensitivity / mV l mol
-1 Sampling frequency / sample h-1
125 0.8 ± 0.2 13
250 2.5 ± 0.1 12
500 3.6 ± 0.1 11
750 3.7 ± 0.1 9
1000 6.9 ± 0.4 8
AF = 1.0 x 10⁻³ mol l-1 phosphate buffer (pH 7.5), with ionic strength adjusted at 1.0 x 10⁻² mol l-1 with NaCl; 0.10 mol l-1 H
3PO4 acid solution and low rate = 2.9 ml min -1.
Table 3 shown the results obtained in the study carried out to evaluate the effect of the low rate on the FIA system performance. Even though the best results were obtained using a low rate of 1.3 ml
min-1, it was employed a low rate of 1.6 ml min-1, as a mean of improving the sampling frequency.
table 3. Effect of the low rate of the carrier luid on the response and sampling frequency. ∆Relectance at low rate 1.3 ml min-1 = 0.64 mV; [Na
2CO3] = 0.010 mol l -1.
Flow rate / ml min-1 Sampling frequency/sample h-1 Percentage of relectance variation
1.3 9 100
1.6 10 72
2.6 11 57
3.5 12 30
AF (acceptor luid) 1.0 x 10⁻³ mol l-1 phosphate buffer (pH 7.5), with ionic strength adjusted at 1.0 x
10-2 mol l-1 with NaCl; 0.10 mol l-1 H
3PO4 acid solution and Vi = 500 µl.
The composition of the acidic solution used to generate CO2 was also studied, employing suc-cinate buffer (pH 3.0), H3PO4 and H2SO4 solutions. Results summarised in Table 4 show that 0.5 mol l-1 phosphoric or sulphuric acid solutions provide the best results. Phosphoric acid was chosen in the present work because the signal was greater than that one obtained with sulphuric acid solution.
table 4. Relectance variation for various acid solutions. [Na2CO3] = 0.010 mol l-1.
Conluent luid H3PO4 /mol l
-1 H
2SO4 /mol l
-1 Buffer
0.5 0.1 0.5 0.1 (pH 3.0)
∆Relectance/mV 0.72 ± 0.02 0.64 ± 0.01 0.69 ± 0.01 0.52 ± 0.02 0.35 ± 0.02 *standard deviation for three replicates.
AF (acceptor luid) 1.0 x 10⁻³ mol l-1 phosphate buffer (pH 7.5), with ionic strength adjusted at 1.0 x
10-2 mol l-1 with NaCl; low rate = 1.6 ml min-1 and V
3.3 - fia system performance
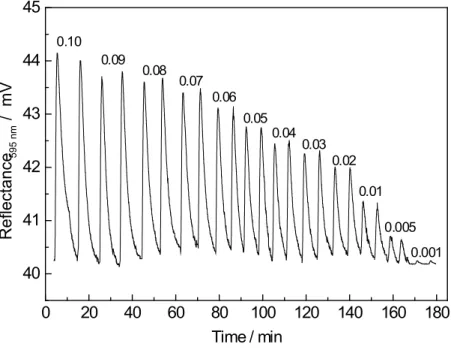
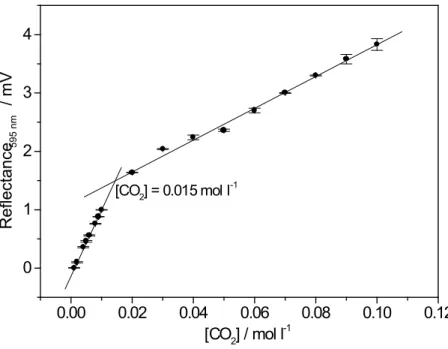
Figure 4 shows a typical response proile for this FIA system and in Figure 5 is showed the cor
-responding analytical curves.
0 20 40 60 80 100 120 140 160 180
40 41 42 43 44 45
0.001 0.005 0.01 0.02 0.03 0.04 0.05 0.06 0.07 0.08 0.09 0.10
Reflectance
595 nm
/ mV
Time / min
0.00 0.02 0.04 0.06 0.08 0.10 0.12 0
1 2 3 4
[CO2] = 0.015 mol l-1
Reflectance
595 nm
/ mV
[CO2] / mol l-1
figure 5. Analytical curves obtained in FIA system proposed. Measurements carried out injected 500 µl of samples in a carrier of 0.1 mol l-1 phosphate buffer (pH 7.6) with 0.1 mol l-1 NaCl and 1.0 x 10⁻³ mol l-1 EDTA. The acid solution was 0.50 mol l-1 H
3PO4 and accepter luid 1.0 x 10
-3 mol l-1 buffer solution (pH 7.5) with 1.0 x 10⁻² mol l-1 NaCl in a rate of 1.60 ml min-1.
At Figure 5 it can be observed two linear response ranges, the irst from 0.001 to 0.010 mol l-1 and
the second response range from 0.020 to 0.10 mol l-1, which presented the following linear regressions, respectively;
∆Relectance = -0.103(± 0.017) + 109.597(± 2.007) [CO2] (r=0.9991, n=8) (1)
∆Relectance = 1.115(± 0.033) + 27.164(± 0.621) [CO2] (r=0.9982, n=9) (2)
This peculiar proile of this FIA system can be probably explained considering the response pro
-ile of TB optode as a function of pH (Figure 2). When hydrogen carbonate or carbonate samples, are
injected the pH of the accepter luid changes. These pH changes are detected by TB optode, which res
-ponds linearly until the concentration of the sample causes a pH change in the acceptor luid of 6.6 (see Figure 2). In the proposed FIA system, the injection of samples with concentrations higher than 0.015
mol l-1, causes a pH shift in the acceptor luid for values smaller than 6.6 (Figure 2), corresponding to the straight line with minor inclination of Figure 5. For concentrations higher than 0.015 mol l-1, a straight line from 0.020 to 0.10 mol l-1 is obtained.
The repeatability of the FIA system was evaluated by ten successive injections of 5.0 x 10⁻² mol
l-1 sodium carbonate solutions, obtained a relative standard deviation value (R.S.D.) of 3.5%. This result indicates the good performance of the proposed FIA system.
The TB optode lifetime in low conditions was c.a. of 17 days, which is in accordance with others
3.4 - determination of Co2 in mineral water samples
The system was evaluated by hydrogen carbonate determination in mineral water. No signiicant
differences were found at a conidence level of 95 %, when the results were compared with those obtai
-ned with potentiometric method, as showed in Table 5.
table 5. Results obtained in the determination of hydrogen carbonate concentration in mineral waters by proposed and potentiometric methods.
Sample [HCO3
-] / mol l-1
Potentiometric titration Proposed method*
01 1.99x10⁻³ (1.97 ± 0.10) x10-3
02 2.01x10⁻³ (2.04 ± 0.12) x10-3
03 2.67x10⁻³ (2.68 ± 0.01) x10-3
04 2.72x10⁻³ (2.63 ± 0.05) x10-3
05 2.90x10⁻³ (2.92 ± 0.01) x10-3
06 2.02x10⁻³ (1.99 ± 0.01) x10-3
* standard deviation for six replicates
4 - ConCluSionS
The chemical immobilisation of TB dye on a borosilicate optical ibre bundle allowed the prepa
-ration of a pH optode, which presented response times suficiently short and long lifetime to be used as a
detector in a FIA system. The results show that this system is able to determine satisfactorily carbonate, with good repeatability and accuracy.
acknowledgements
The authors are thankful to FAPESP-Brazil, for the inancial support and the CNPq-Brazil for
fellowship to MDPTS.
resumo: Este trabalho mostra a construção de um optodo baseado no indicador ácido – base azul de
timol (TB) e sua aplicação como detector de um sistema para análise por injeção em luxo (FIA) para
determinação de CO2. O indicador foi quimicamente imobilizado na superfície de um feixe bifurcado
de ibras ópticas de vidro, usando silanização em meio orgânico. No sistema FIA, amostras de carbo
-nato ou bicarbo-nato são injetadas em uma solução tampão carregadora, e a seguir são misturadas com
solução de ácido fosfórico para gerar CO2, o qual se difunde através de uma membrana de PTFE, para
ser coletado em um luido carregador aceptor, o qual é bombeado em direção à cela de detecção, na qual
encontra-se o optodo. O sistema proposto apresenta duas faixas lineares de resposta, entre 1,0 x 10⁻³ e 1,0 x 10⁻² mol l-1,e entre 2,0 x 10⁻² e 0,10 mol l-1. A freqüência de amostragem foi de 11 amostras h-1,
com boa repetibilidade (R.S.D < 4 %, n = 10). Sob condições em luxo o tempo de vida do optodo foi de
na determinação de bicarbonato foram similares daqueles obtidos pelo método potenciométrico, a um
nível de coniança de 95%.
palavras-chave: CO2, FIA, azul de timol, silanização,optodo para medidas de pH.
5 - references
[1] M.P. Xavier, G. Orellana, M.C. Moreno-Bondi, J. Díaz-Puente, Quim. Anal. 19 (2000) 118.
[2] A. Mills, K. Eaton, Quim. Anal. 19 (2000) 75.
[3] T.D. Rhines, M.A. Arnold, Anal. Chim. Acta 231 (1990) 231.
[4] R.I. Gonçalves, Determinação da pressão parcial do CO2,
na atmosfera e em água do mar por injeção em fluxo contínuo,
com detector espectrofotométrico, Ph.D. Thesis, USP, São Paulo, 1996.
[5] W. Lang, H.U. Wolf, R. Zander, Anal. Biochem. 92 (1979) 255.
[6] G. Neurauter, I. Klimant, O.S. Wolfbeis, Anal. Chim. Acta 382 (1999) 67.
[7] A. Mills, A. Lepre, L. Wild, Sens. Actuators B 38–39 (1997) 419.
[8] K.T.V. Grattan, D. T. Sun, Sens. Actuators B 82 (2000) 40.
[9] Z. Zhujun, R. Seitz, Anal. Chim. Acta 160 (1984) 305.
[10] N. Optiz, D.W. Lübbers, Adv. Exp. Med. Biol. 180 (1984) 757.
[11] J.W. Severinghaus, A.F. Bradley,J. Appl. Phys. 13 (1958)
1574.
[12] M.D. DeGrandpre, M.M. Baehr, T.R. Hammar, Anal. Chem. 71 (1999) 1152.
[13] J.W. Parker, O. Laksin, C.yu, M.L. Lau, S. Klima, R. Fisher, I. Scott, B.W. Atwater, Anal. Chem. 65 (1993) 2329. [14] M.B. Tabacco, M. Uttamial, M. McAllister, D.R. Walt, Anal. Chem. 71 (1999) 154.
[15] C. Goyet, R. David, R. Walt, P.G. Brewer, Deep-Sea Res. 39 (1992) 1015.
[16] M.F. Choi, P. Hawkins, Anal. Chim. Acta 309 (1995) 27. [17] M.D. DeGrandpre, Anal. Chem. 65 (1993) 331. [18] C. Munkholm, D.R. Walt, F.P. Milanovich, S.M. Klainer, Talanta 35 (1988) 109.
[19] O. S. Wolfbeis, Fibre Optic Chemical Sensors and Biosensors, CRC Press, Boca Raton, 1991.
[20] B.H. Weigl, A. Holobar, W. Trettnak, I. Lklimant, H. Kraus, P. O’Leary, O.S. Wolfbeis, J. Biotechnol. 32 (1994) 127.
[21] B. Müller, P.C. Hauser, Analyst 121 (1996) 339. [22] G.J. Mohr, T. Werner, I. Oehme, C. Preininger, I. Klimant, B. Kovacs, O.S. Wolfbeis, Adv. Mater. 9 (1997) 1108. [23] C. Mallins, B.D. McCraith, Analyst 123 (1998) 2373. [24] H.N. McMurray, J. Mater. Chem. 2 (1992) 401. [25] J. Lin, TrAC, Trends Anal. Chem. 19 (2000) 541.
[26] y. Kawabata, T. Kamichika, T. Imasaka, and N. Ishibashi, Anal. Chim. Acta 219 (1989) 223.
[27] A. Mill, L. Monaf, Analyst 121 (1996) 535.
[28] B.H. Weigl, A. Holobar, N.V. Rodriguez, O.S. Wolfbeis, Anal. Chim. Acta 282 (1993) 335.
[29] C. Malins, H.G. Glever, T.E. Keyes, J.G. Vos, W.J. Dressick, B.D. MacCraith, Sens. Actuators B 67 (2000) 89. [30] G. Orellana, M.C. Moreno-Bondi, E. Segovia, M.D. Marazuela, Anal. Chem. 64 (1992) 2210.
[31] C. Munkholm, D.R. Walt, F. Milanovich, Talanta 35 (1988) 109.
[32] I. Kasik, M. Pospísilová, V. Matejec, M. Chomát, K.
Rose, L. Sasek, Book of Abstracts of the Europt(r)ode IV, 1998, sII11a.
[33] P.T. Sotomayor, I.M. Raimundo Jr., G. Oliveira-Neto, W.A. Oliveira, Sens. Actuators B 51 (1998) 382.
[34] M.D.P.T. Sotomayor, I.M. Raimundo Jr., G. Oliveira-Neto, L.T. Kubota, Anal. Chim. Acta 447 (2001) 33.
[35] H. Bergamin Fo, J.X. Medeiros, B.F. Reis, E.A.G.
Zagatto, Anal. Chim. Acta 101 (1978) 9.
[36] O.J. Hall, R.C. Aller, Limnol. Oceanogr. 37 (1992) 1113.
[37] A. Vogel, Quantitative Chemical Analysis, Longman Group, England, 5nd edn., 1989, pp. 278-279.