This paper aims to present the experimental results involving the use of nanoindentation measurements and prediction of macroscale elastic
properties of high performance cementitious composites (HPCC). The elastic properties of HPCC mixture were evaluated at different length scales
by nanoindentation (microscale), and elastic moduli and compressive strength tests (macroscale). The nanoindentation results, obtained by grid
indentation with subsequent phase deconvolution, were complemented by an independent porosimetry test and inserted into a two-step analytical homogenization scheme to predict the overall macroscale properties. The inal results show that the presented method allows a reliable advanced prediction of HPCC elastic properties indicating, thus, that inserting nanotechnology in the concrete industry can be promising, since it would allow the production of a more predictable composite in an easier and less expensive way.
Keywords: nanoindentation, multiscale analysis, high performance cementitious composite.
O presente trabalho visa apresentar os resultados experimentais envolvendo o uso de ensaios de nanoindetação na predição das propriedades elásticas de compósitos cimentícios de alta resistência (CCAR). As propriedades elásticas do CCAR foram avaliadas em diferentes escalas atra
-vés de ensaios de nanoindetação (microescala), módulo de elasticidade e resistência à compressão (macroescala). Os resultados do ensaio de nanoindetação, obtidos mediante grelha de indentação seguido de decovolução de fase, foram complemetados com os resultados de ensaios independentes de porosimetria e inseridos em um método de homogenização de modo a predizer as propriedades elásticas do compósito avalia
-do. Os resultados obtidos permitem airmar que o método utilizado permite uma predição realística das propriedades elásticas dos CCAR. Dessa forma, pode-se airmar que a inserção da nanotecnologia no setor da construção civil é promissora, uma vez que esta possibilitaria a produção de um produto inal mais previsível de um modo mais prático e econômico.
Palavras-chave: nanoindentação, análise multiescalar, compósitos cimentícios de elevada resistência.
Nanotechnology and Construction: use of nanoindentation
measurements to predict macroscale elastic properties of
high strength cementitious composites
Nanotecnologia e Construção: emprego do ensaio de
nanoindentação na predição das propriedades elásticas
de compósitos cimentícios de alta resistência
W. R. L. da SiLva a [email protected] J. Němeček b [email protected] P. Štemberk c [email protected]
a Wilson Ricardo Leal da Silva ([email protected]) – Czech Technical University in Prague – MSc. Civil Engineer, PhD student, Department of Concrete and Masonry Structures, Faculty of Civil Engineering, Czech Technical University in Prague (ČVUT).
b Jiři Němeček ([email protected]) – Czech Technical University in Prague – Associate Professor, Department of Mechanics, Faculty of Civil Engineering, Czech Technical University in Prague (ČVUT).
c Petr Štemberk ([email protected]) – Czech Technical University in Prague – Associate Professor, Department of Concrete and Masonry Structures, Faculty of Civil Engineering, Czech Technical University in Prague (ČVUT).
abstract
1. introduction
Cementitious composites include various types of concretes and mortars and represent the most used building materials. In gen -eral, concrete and mortar mixtures are considered by many re-searches and practitioners as a homogeneous material.
Never-theless, this classiication may change according to the level of
observation (micro, meso and macroscopic level). Those materials
whose homogeneity depends on the observation level are called multiscale materials. Based on this deinition, cementitious com -posites are considered as typical representatives of multiscale ma-terials since they can be treated as homogeneous in the macro-scopic level (cm~m length scale), and as heterogeneous material
in a iner level of observation (nm~cm length scale).
Heterogeneity of cementitious composites at the lower level arises
from both the chemical reactions from the hydration process, [1,2], and the mechanical mixing of non-reactive components, [3,4].
Moreover, transition zones between the phases and also porosity
are present at each scale of the composite.
The multiscale analysis of a composite involves the following steps:
1 microstructure observation (i.e. determination of morphologi-cal parameters) and separation of chemimorphologi-cally different phases; 2 assessment of mechanical properties of individual phases and
their links to chemical properties;
3 upscaling of properties from the microlevel to a broader scale, [3,5]. The microstructure observation and determination of phases can be performed, e.g., by analysis of images obtained
from optical microscopy, scanning electron microscopy (SEM) or atomic force microscopy (AFM).
Several researches, [4-8], have used these techniques to obtain
morphological and chemical parameters of individual material
phases with great success, and equally as in this paper, the mi -crostructure analysis has often been supplemented by porosity measurements obtained by mercury intrusion porosimetry and/or image analysis, among other methods.
The micromechanical analysis of individual material phases
(nm~mm scale) can be obtained by the nanoindentation technique. This corresponds to a unique technique which allows the mechani -cal properties of small volumes at nano and micro level. The prin-ciple of nanoindentation lies in forcing a very small diamond tip to
the material surface while the changes in the applied load and the penetration depth are measured simultaneously, [9]. By using this
method, material properties, such as elastic modulus, hardness, plastic or viscous parameters, can be obtained from experimental readings for a given material volume, [9-11].
The macrolevel analysis is performed by different types of stan-dardized macroscopic tests (e.g., by the static compression,
ten-sion or bending and/or by dynamic tests) where the overall mate -rial properties are obtained on large specimens (cm~m scale).
Transition between the micro and macro levels can be treated with a micromechanical approach that separates the levels by deining
a characteristic scale and related representative volume elements
(RVE) for each of the levels, [12]. The response of the micromechani
-cally heterogeneous RVE can be averaged through different homoge
-nization techniques, [12-14]. A signiicant group of analytical methods is based on the classical Eshelby’s solution of ellipsoidal inclusions
embedded in a matrix, [13], namely the Mori-Tanaka method, the self-consistent scheme and others, [12]. Numerical homogenizations can
include inite element computations or fast Fourier transformation, [14-16]. Among the analytical homogenization schemes, the Mori-Tanaka method, which performance was justiied by some researchers when used for cementitious composites, [3,5,17], is frequently used for its simplicity and wide applicability in terms of the concentration range of
the multiple phases involved in the analysis.
High performance Cementitious Composite, HPCC, are those cementitious-based composites, e.g., mortar and concrete, which meet special performance and comply with uniformity require
-ments that cannot be always achieved by conventional materials and practices, [18]. By deining the link between microstructure,
micromechanical properties and macroscopic mechanical perfor-mance of such composite, one can optimize its mechanical
proper-ties in an easier and experimental less expensive way. This pos
-sibility is highly inviting for the concrete industry, since they would
be able to deliver a more predictable product, for example, a high
performance concrete with the desired elastic properties.
In this paper, a combination of nanoindentation technique and ap -proaches mentioned along these lines has been applied in order to determine macroscale elastic properties of the high performance cementitious composites.
2. experimental program and evaluation
of results
This section highlights the details on the tested materials, mixture compositions, sample preparation, mixing procedure and tests performed. The experimental setup for the analysis of mechanical properties at different levels is also presented.
2.1 Materials
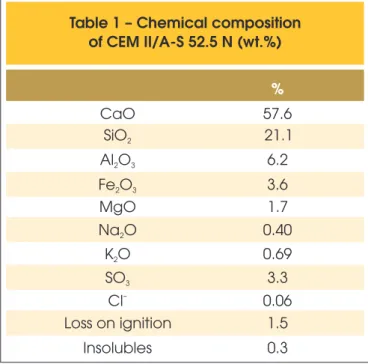
The tests were carried out with mortar mixtures further denoted as C1. The mortar mixtures contained cement CEM II/A-S 52.5 N (Table 1), high-range water reducing admixture Stachement 2000, and quartz
Table 1 – Chemical composition
of CEM II/A-S 52.5 N (wt.%)
%
CaO
57.6
SiO2
21.1
Al O
2 36.2
Fe O
2 33.6
MgO
1.7
Na O
20.40
K O
20.69
SO
33.3
–
Cl
0.06
Loss on ignition
1.5
results, [21], and adjusted in order to obtain higher compressive
strength and spread diameter of ~180 mm in the low-table test. The mixing procedure is described in Table 4. After mixed and tested in the fresh state, nine samples were molded for the tests in the hard
-ened state, whose details are described in the following sections.
2.3 Macroscale analysis
2.3.1 macroscopic elastic modulus and strength
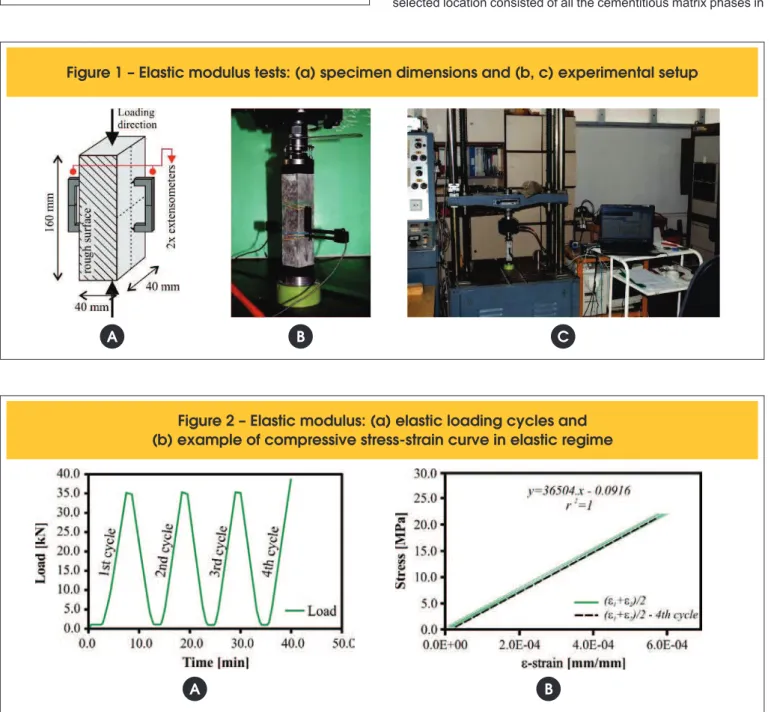
For the evaluation of elastic modulus and compressive strength six
prismatic specimens 40×40×160 mm3 were molded. The molding
was performed in two layers of 2.0 cm, each one compacted under
a cycle of 15 seconds under vibration on a vibration table. The
samples were then sealed with plastic foil and kept in the mold for 24 hours. Later, the specimens were demolded and stored in water for 20 days until the tests in the hardened state were performed. Before testing, the top and bottom ends of the specimens were polished to obtain lat parallel surfaces.
The uniaxial compression tests were performed by using an electro
-mechanical universal test machine (Testatron, Otto Wolpert-Werke Gmbh). The load was measured by a beam load cell (MTS 100 kN) attached to the electromechanical actuator. Two axial extensometers with the gauge length of 50 mm were used to measure the displace
-ment of the specimen. The extensometers were located on the lateral surfaces of the samples as indicated in Figure 1a. The centric loading was checked at the beginning of the test and in case of any bending occurrence, the test was stopped and the specimen adjusted to its center position. The complete experimental set up is presented in Fig
-ure 1b,c. Four loading cycles were performed on each sample to ex
-clude the initial inelasticity (Figure 2a). The elastic modulus was com -puted from the linear part of the last cycle in the stress-strain curve,
see Figure 1b. The loading continued until the ultimate load was
reached in order to obtain the compressive strength of each sample.
2.4 Microscale analysis
2.4.1 Nanoindentation tests
A cylindrical sample of 30 mm in diameter was prepared for na
-noindentation testing (Figure 3). The molding and curing proce
-iller, provided by Sklopísek Střeleč, CZ, with the maximum grain size of 0.063 mm. A mix of two ine quartz sands, ST06/12 and ST01/06, also provided by Sklopísek Střeleč, CZ, were used as aggregates These are mainly composed by SiO2 (99.2%) and Fe2O3 (0.04%).
The sand mix included 50 vol.% of ST06/12 (with the grain size range varying from 0.63 mm to 1.25 mm) and 50 vol.% of ST01/06 (with the
grain size range varying from 0.10 mm to 0.63 mm). The grain size distribution of both the aggregates is presented in Table 2.
2.2 Mixture compositions and mixing procedure.
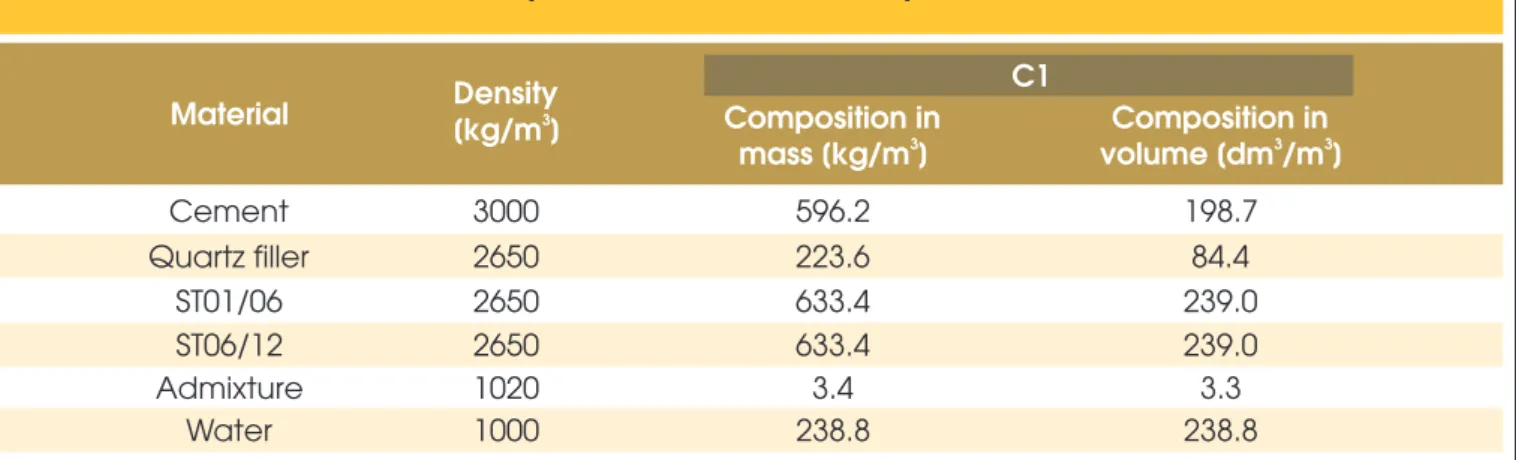
The compositions of mortar mixture in mass and volume is
pre-sented in Table 3. This composition was deined on previous study
Table 2 – Grain size distribution
of aggregates (in wt.%)
ST 01/06
ST 06/12
Middle grain size (d ) [mm]
500.38
0.88
AFS grain fineness number
30
14
3Bulk density [kg/m ]
1500
1600
Grain size [
m
m]
ST 01/06
ST 06/12
>4000
-
-
>1250
-
7.0%
>1000
0.0%
-
>800
-
-
>630
12.0%
91%
>315
-
-
>200
85.0%
-
>100
2.0%
-
<100
1.0%
2.0%
Table 3 – Material density and mortar mixture composition, in mass and volume
Material
Density
[
kg/m ]
3C1
Composition in
3
mass [kg/m ]
volume [dm /m ]
Composition in
3 3Cement
3000
596.2
198.7
Quartz filler
2650
223.6
84.4
ST01/06
2650
633.4
239.0
ST06/12
2650
633.4
239.0
Admixture
1020
3.4
3.3
dure was held the same as described in section 2.3.1. The speci
-men was cut out from the middle section of a larger volume by using a precision diamond saw. Then, dried surfaces were grinded by SiC papers (grit #2000 and #4000) and polished by cloth with 0.25 mm diamond spray. Finally, the surfaces were cleaned by washing in alcohol and ultrasonic bathing. The resulting surface roughness (root-mean-square) was checked with AFM to be less
than 20 nm on 5×5 mm area.
The nanoindentation measurements were carried out in the CSM
Nanohardness tester® machine. The three-sided pyramidal indenter
tip (Berkovich) was used to perform a massive grid of 16×18 (288) indents with the mutual distance of indents of 8 µm as illustrated in Figure 4a. The indentation location was selected carefully by a high magniication optical microscope prior to testing to ensure that they lie away from large aggregate. The microstructure at the
selected location consisted of all the cementitious matrix phases in
Table 4 – Mixing procedure
Procedure
Time (s)
Dry materials mixed together
→
→
→
→
→
→
30
Addition of water
30
Mixture of materials and water
60
Edge shovel clean
30
Addition of superplasticizer
30
Mixture of the base mortar
90
Figure 1 – Elastic modulus tests: (a) specimen dimensions and (b, c) experimental setup
A
B
C
Figure 2 – Elastic modulus: (a) elastic loading cycles and
(b) example of compressive stress-strain curve in elastic regime
a suficient content. Thus, it could be considered as a representa
-tive volume element (RVE) on the matrix level (level I) having the dimension ~100 mm. Individual indent size (depth of penetration h) was chosen to be h ≈ 200 nm, [19], so that the affected volume under the indenter, which can be estimated as 3×h (i.e. ~600 nm), was smaller than the characteristic sizes of inclusions to avoid signiicant phase interactions. However, in the dense matrix of a HPCC full exclusion of interactions can hardly be achieved since it presents several phases of different stiffness. Due to surface roughness, which cannot be further decreased by mechanical way,
[23], the indent size must be kept in hundreds of nm. The indent
size 100~300 nm also suits well the concept of grid indentation on cement pastes, [19]. It can be assumed that hard quartz iller, with
maximum ~60 mm size, in larger volumes can also cause stiffening
of less stiff phases like C-S-H gels during indentation. The error incorporated into the measurements can be roughly quantiied by FEM computation as 13~25%, [24]. Similar errors are incorporated
into measurement of stiff inclusions surrounded by a compliant
matrix, however their content is smaller and thus their inluence also decreases. It can be assumed that such errors are naturally
included in nanoindentation measurements and should be
consid-ered in the inal comparisons.
The nanoindentation loading regime contained loading at 12 mN/
min, holding for 10 seconds and unloading at 12 mN/min as shown in Figure 4b. The holding period of 10 seconds with constant force was added mainly to minimize creep effects on the elastic unload -ing, [25].
The elastic modulus of the analyzed phase was determined ac
-cording to the Oliver-Pharr methodology, [10]. The analysis is based on Eq.(1) to deine the indentation (reduced) modulus:
(1)
S
A
E
rp
b
2
1
=
(2)
max h h h P
d
d
S
=
=
where S, which is deined by Eq.2, is the contact stiffness assessed
as a slope of the unloading branch at the maximum depth hmax and
the peak load, Ac is the projected contact area at the peak load, and
β is the geometrical correction factor introduced to correct the
non-Figure 3 – Specimens for nanoindentation
test: initial and final configuration
Figure 4 – Nanoindentation tests: (a) Indentation grid, and (b) loading and penetration depth diagram
symmetrical indenter shape (β=1.034 for Berkovich tip). The effect of non-rigid indenter can be taken into consideration by the equality of compliances shown in Eq.(3),
(3)
,
1
1
1
2 2i i
r
E
E
E
n
n
-+
-=
where E corresponds to the elastic modulus and n the Poisson’s ratio of the tested materials, while Ei and ni are the parameters of
the indenter (Ei=1141 GPa and ni=0.07 for a diamond).
2.4.2 deconvolution procedure
The individual phase properties of the analyzed mixtures were de -termined by applying the statistical deconvolution to elastic modu-lus histograms, [19,4]. The results on the elastic moduli in the form
of frequency plots are analyzed so that the minimization proce -dure seeks parameters of n Gauss distributions in an experimental
probability density function, PDF.
In the deconvolution algorithm, a random seed and minimizing criteria based on quadratic deviations between the experimental and theoreti
-cally computed overall PDFs are calculated to ind the best it. A com
-prehensive review about the deconvolution procedure is described in [4]. The number of the searched phases was ixed to four based on the number of characteristic peaks in the PDF. The dominant phas
-es in the PDF need not nec-essarily to correlate with the chemically
distinct phases and are further considered as mechanically distinct
phases which will be used in the homogenization procedure.
2.5 Analytical elastic homogenization
The homogenization corresponds to a technique used to upscale
the mechanical properties from the microscale to the upper
lev-el to ind the effective properties of the RVE. In this paper, the elastic homogenization was performed by means of the analytical
Mori-Tanaka scheme, [20]. This scheme describes a composite by a morphologically prevailing matrix (the reference medium)
reinforced by distinct non-continuous spherical inclusions. In the
Mori-Tanaka method, the homogenized bulk and shear moduli of a r-phase composite are assessed as indicated in Eq.4 to 7.
(4)
1 0 0 1 0 0hom
(
1
(
1
))
))
1
(
1
(
-×
+
-×
+
×
=
å
å
k
k
f
k
k
k
f
k
r r r r r r ra
a
(5)
1 0 0 1 0 0hom
(
1
(
1
))
))
1
(
1
(
-×
+
-×
+
×
=
å
å
m
m
b
m
m
b
m
m
r r r r r r rf
f
(6)
0 0 00
3
3
4
m
a
×
+
×
×
=
k
k
(7)
0 0 0 00
15
6
12
20
m
m
b
×
+
×
×
+
×
=
k
k
where the subscript 0 corresponds to the reference medium and r corresponds to a particular inclusion. Thus, k0 and µ0 are
the bulk and shear moduli of the reference medium, while kr
and µr refer to the inclusion phases. These values are the input
to the equations that define the homogenized elastic modu
-lus. After defining these values, the bulk and shear moduli can be recomputed to the elastic modulus and the Poisson’s ratio though Eq.8 and 9.
(8)
hom hom
hom hom
hom
3
9
m
m
+
×
×
×
=
k
k
E
(9)
hom hom hom homhom
3
6
2
2
m
m
n
×
+
×
×
-×
=
k
k
3. Results
3.1 Experimental results in hardened
state – Macroscale analysis
3.1.1 elastic modulus and Compressive strength
The results from elastic modulus and uniaxial compression tests are summarized in Table 5.
Table 5 – Elastic modulus and Compressive
strength - Macroscale analysis
Sample
modulus [GPa]
Elastic
Compressive
strength
[MPa]
1
41.2
61.4
2
38.1
58.2
3
37.5
49.4
4
39.1
57.0
5
38.8
55.7
6
39.5
54.7
Average
result [GPa]
39.0
–
–
Standard
3.2 Experimental results in hardened state -
Microscale analysis
3.2.1 Nanoindentation
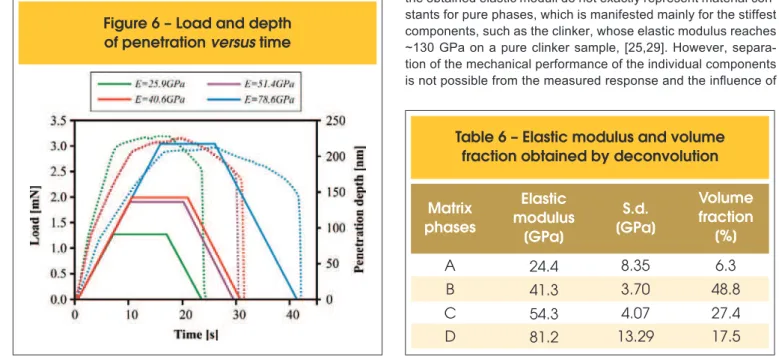
A total of 288 indents to the cementitious matrix were performed. Examples of the load-penetration curves and related load/penetra
-tion-time diagrams showing indents to differently stiff phases are presented in Figure 5 and 6, respectively.
All relevant indents were analyzed by the Oliver-Pharr method, [10], for an elastic modulus with the assumption of constant Pois
-son’s ratio 0.2 for all indents, since the inluence of the selected Poisson’s ratio in the relevant range 0.18−0.22 on the evaluation is very small, [17]. Subsequently, the frequency plots, with bin
size set to 1.0 GPa, and related experimental probability density
functions (PDFs) were computed. The deconvolution method was applied to PDFs as illustrated in Figure 7. The obtained results
are listed in Table 6.
As mentioned above, the results are considered as results re -ceived on mechanically distinct phases and there is no intention
to link them with pure chemical phases, such as C-S-H gels with
different densities, Portlandite, interfacial zones, etc., [5,17,19].
Despite the fact that the results from deconvolution present me -chanically distinct phases rather than chemically distinct phases,
they are closely related. Based on the SEM imaging, cement
chemistry and mixture composition, it is assumed that the phase
A in Figure 7 is composed of low stiffness porous phases, the phase B contains majority of the main hydration products (C-S-H gels and partly Ca(O(C-S-H)2), the phase C is composed of high
stiffness hydration products (high stiffness C-S-H and partly Ca(OH)2), the phase D contains the remaining non-hydrated clin
-ker, ly ash or quartz iller. Due to unavoidable phase interactions,
the obtained elastic moduli do not exactly represent material
con-stants for pure phases, which is manifested mainly for the stiffest components, such as the clinker, whose elastic modulus reaches ~130 GPa on a pure clinker sample, [25,29]. However, separa -tion of the mechanical performance of the individual components
is not possible from the measured response and the inluence of
Figure 5 – Example of load-penetration curves
Figure 6 – Load and depth
of penetration
versus
time
Figure 7 – Experimental and best-estimated
PDF obtained by deconvolution
Table 6 – Elastic modulus and volume
fraction obtained by deconvolution
Matrix
phases
Elastic
modulus
[GPa]
S.d.
[GPa]
Volume
fraction
[%]
A
24.4
8.35
6.3
B
41.3
3.70
48.8
C
54.3
4.07
27.4
interactions can be just estimated as discussed in section 2.4.1.
Further, the evaluated micromechanical values are considered as the irst estimates and as such they neglect the interaction phenomena in the following upscaling.
3.2.2 Homogenization
The microstructure of the analyzed composites was split into
two levels. The irst level, which corresponds to the matrix level, named as level I, is characterized by all the matrix phases hav -ing characteristic dimensions less than d ≈ 10 mm (i.e.
hydra-tion products, clinker, quartz iller, ly ash). The RVE size which
also corresponds to the indentation grid has the dimension ~100 mm. Therefore, the scale separability condition [12,19] h<<d<<L, where h is the indent size, d is the characteristic inclu-sion size and L is the RVE size, holds. The situation is illustrated
in Figure 8.
Since the volume affected by the indentation is ~0.6 mm3 it is as-sumed that all the pores smaller than this limit are included in the
indentation results. It includes mainly nanoporosity. However, a small part of pores with the dimension of 0.6~10 mm, which cor
-responds to approximately 1/10 of RVE size, also lies in the level I but cannot be detected by the nanoindenter. Consequently, this porosity was included as an additional mechanical phase in the level I (Table 7).
Mercury intrusion porosimetry (MIP) performed on the crushed pieces of the composites of the size of up to 5 mm was used for as
-sessment of the level I porosity, i.e., pores in the range from 0.6 µm to 10µm, which equaled to 2.4 vol.%, see Figure 9. The results for the homogenized elastic modulus and the Poisson’s ratio obtained by the Mori-Tanaka method for level I are presented in Table 7. Subsequently, the level of the whole mortar, named as level II, was constructed. It consisted of the homogenized phase of the level I (matrix) and the rest of components, i.e. large sand par
-ticles, aggregate and air voids, which corresponds to capillary pores with diameter greater than 10µm and large air voids com
-ing from entrapped air greater than 1mm. Since the aggregate
does not change chemically in the composite, its portion is given
by the initial mixture proportions, deined in Table 3. The elastic modulus and the Poisson’s ratio of the quartz aggregates were assumed as 71.8 GPa and 0.17, respectively, [30]. Sometimes, an additional phase, an interfacial zone between the matrix and
the aggregate, is considered as a separate phase in multiscale
models. For the herein presented analysis, the properties of possible ITZ are naturally included in the nanoindentation data since the indentation grid was squeezed between the large ag -gregate. Moreover, the very dense matrix itself consists of
pos-sibly interconnecting ITZs surrounding the pure phases. Due to the large span of the pore diameters ranging from mm to mm, a combination of imaging techniques was used to assess
Figure 8 – Scale definition
Table 7 – Mechanical properties of the level I obtained by homogenization
Phase
modulus
Elastic
[GPa]
n
Volume
fraction
[%]
Corrected
volume
fraction [%]
Mori-Tanaka
level-I
E
hom[GPa]
level-I hom
n
A
24.4
0.20
6.3
6.2
45.9
0.20
B
41.3
0.20
48.8
47.6
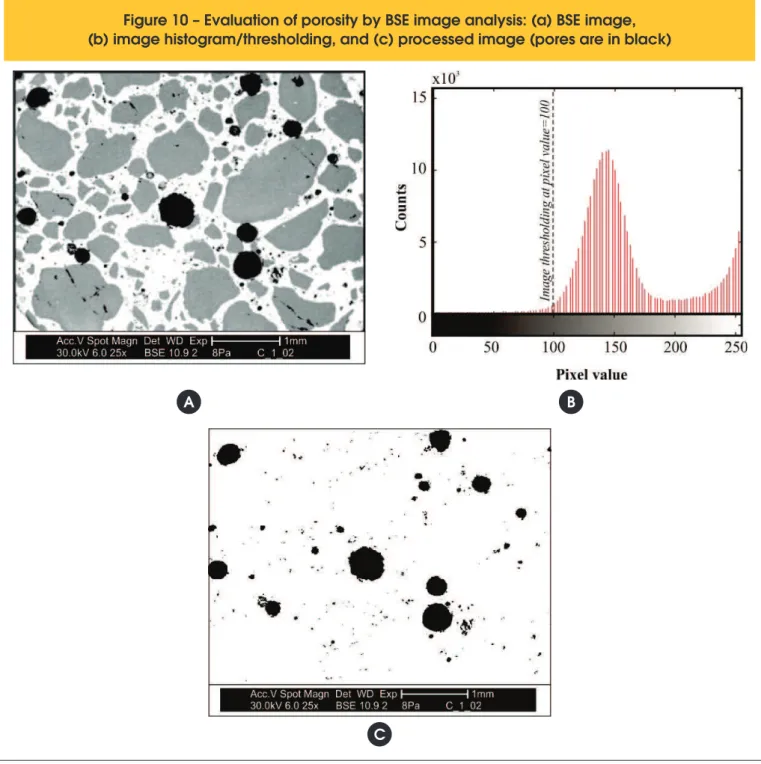
the level II porosity. Image analysis was employed on segmented back-scattered (BSE) electron and optical images (OI). The seg
-mentation was performed on the thresholded binary images as il
-lustrated in Figure 9.
The medium size porosity (10µm to 1mm) was assessed from 25× magniication BSE images, see Figure 10. Fifteen different BSE images were analyzed and the results averaged. The analysis
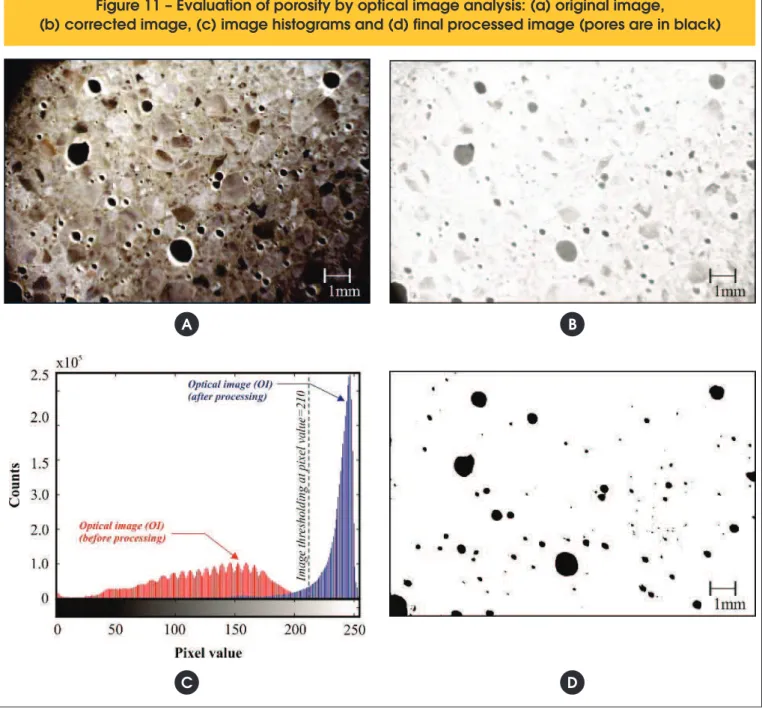
yielded 8.92% (Table 8). The pores larger than 1 mm (mainly
entrapped air pores) were as
-sessed similarly also from OI with 10× magniication, see Figure 11. As indicated in Ta
-ble 8, the analysis resulted with
0.31% of porosity. The results obtained for the homogenized elastic modulus and the
Pois-son’s ratio by using the Mori-Tanaka method are shown in Table 8 for the level II.
4. veriication of the results
The veriication of the results is based on the comparison of the elastic modulus obtained from the level II homogenization (Table 8)
and the macroscopic tests (Table 5). These results are summarized
in Table 9. The relative error between the results obtained from the macroscale elastic modulus tests and homogenized values is within
the order of tens of percent.
As mentioned in section 2.4.1,
evaluation of nanoindentation
tests is not error-free. In the case of HPCC, which consists in a dense matrix, in which sev -eral phases of different stiffness
occur, the interaction between
the matrix and these different phases can affect the nanoin-dentation results. Therefore, it can be assumed that the error presented in Table 9 is caused
Figure 9 – Mercury intrusion porosimetry: (a) incremental porosity curve;
(b) cumulative porosity curve
A
B
Table 8 – Mechanical properties of level II obtained by homogenization
Phase
Elastic
modulus [GPa]
n
Volume
fraction [%]
level-II
E
hom[GPa]
level-II hom
n
[GPa]
Level I - homogenized matrix
45.9
0.20
46.2
0.18
Aggregate (0.10-1.25mm)
71.8
0.17
Capillary pores >10µm –1mm
(BSE)
–
–
Large air pores >1mm (OI)
–
–
47.6
43.2
8.92
0.31
Table 9 – Elastic modulus:
Homogenization
vs.
Macroscale tests
Elastic
modulus
homogenization
[GPa]
Elastic modulus
macroscopic
level-static
[GPa]
Error
[%]
Figure 10 – Evaluation of porosity by BSE image analysis: (a) BSE image,
(b) image histogram/thresholding, and (c) processed image (pores are in black)
A
B
C
by the phase interactions inluencing the nanoindentation results. The inluence of the evaluation by deconvolution is also considered. This observation is supported by the fact that the level II homogenization
is based on mixture proportions and independent image analysis re-sults. Therefore, the observed overall error must come from the
ba-sic indentation data used in the level I homogenization. In order to decrease the effect of interactions and thus reine the computations, it would be necessary to decrease the size of indents. Nonetheless, such reinement is hardly achievable with standard polishing tech
-niques that provide surface roughness at least in the order of several
tens of nanometers on the given sample composition. In spite of the
error, the use of nanoindentation tests cannot not be either discarded
or substituted since it corresponds to the best experimental technique which allows direct assessing of the mechanical properties of material volumes with dimensions on the nanometer scale, [3], reason why this technique has been chosen in the presented research.
5. Conclusions
for determination of macroscale elastic properties of HPCC based on multiscale analysis. Based on the obtained results the following conclusions can be drawn.
The experimental results showed that the use of statistical grid nanoindentation, which was applied for the mechanical analysis
on the microscale level, can be performed in a very effective and
inexpensive way on the matrix components and provides reliable
estimates of their stiffness.
It has been also proved that the use of several independent experi
-mental techniques and their combination in the homogenization
procedures, offers a cost effective tool for virtual testing of
mac-roscale mechanical performance of HPCC, which is composed by
a mix of different chemical and mechanical phases. This feature can be highly attractive to the concrete industry, since the use of
described method would dramatically reduced the total volume of experimental work and, more important, it would enable the pro -duction of a more predictable composite, in the present case, a more predictable high performance concrete.
6. acknowledgements
The support of the Czech Science Foundation (project 103/09/1748), Grant Agency of the Czech Technical University in Prague (grants No. SGS12/116/OHK1/2T/11 and SGS11/107/
Figure 11 – Evaluation of porosity by optical image analysis: (a) original image,
(b) corrected image, (c) image histograms and (d) final processed image (pores are in black)
A
B
OHK1/2T/11), and the Erasmus Mundus External Cooperation Window EMEWC – EUBrazil Startup is gratefully acknowledged.
7. References
[01] Taylor, H. Cement Chemistry. Academic Press, New
York, 1990.
[02] Jennings H. A model for the microstructure of calcium silicate hydrate in cement paste, Cement and Concrete Research, 30; 6; 2000; 101-116. [03] Němeček J. Nanoindentation of Heterogeneous
Structural Materials, Habilitation Thesis, CTU Reports, ČVUT Praha; 2010.
[04] Němeček J, Šmilauer V, Kopecky L. Nanoindentation
characteristics of alkali-activated aluminosilicate
materials, Cement and Concrete Composites 33; 2;
2010; 163-170.
[05] Constantinides G, Ulm F-J. The effect of two types of C-S-H on the elasticity of cement-based materials: Results from nanoindentation and micromechanical modeling, Cement and Concrete Research; 34; 1;
2004; 67-80.
[06] Calabri L, Pugno N, Valeri S. AFM Nanoindentation Method: Geometrical Effects of the Indenter Tip, Nanoscience and Technology – Applied Scanning Probe Methods XI; 2009; 139-164.
[07] Scrivener K L. Backscattered electron imaging of
cementitious microstructures: understanding and
quantiication, Cement and Concrete Composites; 26;
8; 2004; 935-945.
[08] Chen J J, Sorelli L, Vandamme M, Ulm F-J.
Chanvillard G.A Coupled Nanoindentation/SEM-EDS Study on Low Water/Cement Ratio Portland Cement Paste: Evidence for C–S–H/Ca(OH)2 Nanocomposites,
Journal of the American Ceramic Society; 93; 5; 2010; 1484–1493.
[09] Fischer-Cripps A C. Nanoindentation. Springer, 2002. [10] Oliver W C, Pharr G M. An improved technique for
determining hardness and elastic modulus using load and displacement sensing indentation experiments,
Journal of Materials Research; 7; 1992; 1564-1583. [11] Vandamme M, Ulm F-J. Viscoelastic solutions for
conical indentation, International Journal of solids and
structures; 43; 10; 2006; 3142-3165.
[12] Zaoui A. Continuum Micromechanics: Survey, Journal of Engineering Mechanics 128 (8) (2002) 808-816. [13] Eshelby J. The determination of the elastic ield of an
ellipsoidal inclusion and related problems, in: Proc.
Royal Society of London A; 1957; 376-396.
[14] Zeman J, Vondřejc J, Novák J, Marek I. “Accelerating a FFT-based solver for numerical homogenization of
periodic media by conjugate gradients”, Journal of
Computational Physics; 229; 21; 2010; 8065-8071. [15] Garboczi E J. Finite Element and Finite Difference
Programs for Computing the Linear Electric and Elastic Properties of Digital Images of Random Materials, Tech. rep., NIST Building and Fire Research Laboratory,
Gaithersburg, Maryland; 1998.
[16] Moulinec H, Suquet P, A fast numerical method for
computing the linear and nonlinear mechanical
properties of composites, Computer Methods in Applied Mechanics and Engineering; 157; 1-2; 1998;
69-94.
[17] Sorelli L, Constantinides G, Ulm F-J, Toutlemonde F. The nano-mechanical signature of Ultra High Performance Concrete by statistical nanoindentation techniques, Cement and Concrete Research; 38; 2008; 1447–1456.
[18] Bharatkumar B H, Narayanan R, Raghuprasad B K, Ramachandramurthy D S, Mix proportioning of high performance concrete, Cement and Concrete Composites, 23, 1, 2001, 71-80.
[19] Constantinides G, Chandran K R, Ulm F-J, Vliet K V.
Grid indentation analysis of composite microstructure and mechanics: Principles and validation, Materials
Science and Engineering A; 430; 2006; 189-202. [20] Mori T, Tanaka K. Average stress in matrix and
average elastic energy of materials with misitting inclusions, Acta Metallurgica; 21; 5; 1973; 1605-1609. [21] Silva, W R L, Damo, G, Oliveira, A L, Tochetto,
E, Prudêncio JR, L R. Inluence of Air Temperature on the Performance of Different Water Reducing Admixtures with Respect to the Properties of Fresh and Hardened Mortar. In: Advances in Civil Engineering, 2010, Article ID 136768.
[22] ASTM E1876-01, Standard Test Method for Dynamic Young’s Modulus, Shear Modulus, and Poisson’s Ratio by Impulse Excitation of Vibration, Annual Book of ASTM Standards, American Society for Testing and
Materials, 2006.
[23] Miller M, Bobko C, Vandamme M, Ulm F-J, “Surface
roughness criteria for cement paste nanoindentation”,
Cement and Concrete Research; 38; 4; 2008;
467-476.
[24] Němeček J, Lukeš J. On the Evaluation of Elastic
Properties from Nanoindentation of Heterogeneous
Systems. Chemicke Listy; 2010; 104; 279-282. [25] Němeček J. Creep effects in nanoindentation of
hydrated phases of cement pastes , Materials
Characterization; 60; 9; 2009; 1028-1034.
[26] Nochaiya T, Wongkeo W, Chaipanich A. Utilization of ly ash with silica fume and properties of Portland cement-ly ash-silica fume concrete, Fuel 89; 3; 2010;
768-774.
[27] Ravina D, Mehta P K. Properties of fresh concrete containing large amounts of ly ash, Cement and Concrete Research; 16; 2; 1986; 227-238.
[28] Montgomery D C, Runger G C. Applied Statistics and Probability for Engineers, 4th Edition; 2007.
[29] Velez K, Maximilien S, Damidot D, Fantozzi G, Sorrentino F. Determination by nanoindentation of
elastic modulus and hardness of purê constituents of
Portland cement clinker, Cement and Concrete Research; 31; 2001; 555-561.