Overweight and obesity in preschoolers: Prevalence and relation
to food consumption
ARETHA MATOSDE ARAUJO1, SOCORRO ADRIANADE SOUSA MENESES BRANDÃO2, MARCOS ANTÔNIODA MOTA ARAÚJO3,
KAROLINEDE MACÊDO GONÇALVES FROTA4*, REGILDA SARAIVADOS REIS MOREIRA-ARAUJO4
1Graduate Food and Nutrition Program, Universidade Federal do Piauí (UFPI), Teresina, PI, Brazil 2Graduate Sciences and Health Program, UFPI, Teresina, PI, Brazil
3Fundação Municipal de Saúde, Teresina, PI, Brazil
4Doctor in Food and Nutrition, Department of Nutrition, UFPI, Teresina, PI, Brazil
SUMMARY
Study conducted by Graduate Food and Nutrition Program, Department of Nutrition,
Universidade Federal do Piauí (UFPI), Teresina, PI, Brazil
Article received: 5/31/2016
Accepted for publication: 6/20/2016
*Correspondence: Departamento de Nutrição, UFPI
Address: Campus Universitário Ministro Petrônio Portela, s/n, bl. 13,
Teresina, PI – Brazil Postal code: 64049-550
http://dx.doi.org/10.1590/1806-9282.63.02.124
Objective: To determine overweight and obesity prevalence in preschool children from public education, and to determine their relation to food consumption.
Method: Cross-sectional study with children aged between 2 and 5 years, of both sexes, enrolled at municipal day care centers. Socioeconomic, demographic and anthropometric data were collected, in order to calculate the body mass index (BMI) for age. Data on food consumption were assessed using a Food Frequency Questionnaire. χ2 test, Kruskal-Wallis test, Student’s t-test and Pearson’s correlation
were used at a signiicance level of 5%.
Results: Of 548 children, 52% were male, with mean age of 4.2 years old. Most families had incomes between 1 and 2 minimum wages (59.7%), in addition to 10 years (mothers) of education. Anthropometric parameters did not differ signiicantly between sexes. According to the BMI-for-age, it was found that most of children were well-nourished (85.2%), 8.2% had the risk of becoming overweight, and 4.2% were overweight. The most consumed foods were: rice (100%), beans (99.4%), bread (98.5%), fruit (98.5%), red meat (97.1%), butter and margarine (95.4%), biscuits, cakes and sweet pies (94.1%), dairy products (94.1%), chocolate milk (91.7%), and soft drinks (90.2%). Consumed foods that were strongly correlated (r > 0.7) to the risk of/excess weight were, as follows: bread; biscuits, cakes, sweet pies; dairy products; chocolate milk; sausages.
Conclusion: There was low prevalence of overweight and absence of obesity
among the population assessed. The risk of overweight was greater among girls. Data from the study showed deviations in food consumption.
Keywords: overweight, obesity, preschooler, food consumption.
INTRODUCTION
The change in the nutritional proile of Brazilian chil-dren due to the nutritional transition has revealed the increasing prevalence of overweight and obesity among children, in parallel to the reduction of nutritional deicits, and this situation has become alarming due to rising indicators.1
Estimates by the World Health Organization (WHO) suggest that excess weight affects around 5 million chil-dren aged under 5 years worldwide.2 The Family Budget
Survey (POF, in the Portuguese acronym) 2008-2009 showed an important increase in the number of obese
children in Brazil, with a prevalence of 32.8% overweight and 16.2% obesity among children up to 5 years of age.3
The growing trend of overfeeding, overweight and obe-sity means the prevention of these outcomes is of the utmost priority in order to prevent complications in adult life, con-sidering the multifactorial nature of this condition.4,5
The irst years of life are sensitive to nutritional chang-es and metabolic disorders, and it is a critical period for establishing habits and behaviors that will inluence both growth and child development.6,7
considering the impact that consumption can have on the overall health of this age group, preventing imbal-ances both due to deiciency diseases and dietary excess.8
Faced with the increasing prevalence of overweight and obesity, as well as changes in food consumption among preschool children, it is necessary to obtain rep-resentative data for this population, which is exposed to this risk the most often, in order to enable further follow--up, monitoring and intervention measures, whenever these become necessary. Therefore, this study aimed to verify the prevalence of overweight and obesity in pre-schoolers at public education institutions in Teresina, capital of the Brazilian state of Piauí, and its relationship to food consumption.
METHOD
This is a cross-sectional and analytical study, in which we assessed preschoolers of both sexes aged 2 to 5 years and enrolled in the Municipal Public Education Network of Teresina, in the Brazilian state of Piauí, from the four census regions of the city. The day care centers were deined by means of drawing lots, as well as the sample population. For calculation of the sample size (n), a 10% prevalence of overweight and obesity was adopted, as observed in a study with Brazilian children of low socioeconomic status,9
obtaining n = 548 children, considering a margin of error (e) of 5% and a conidence level of 95%.
To begin the collection of data, the approval of the Ethics Committee of the Federal University of Piauí (Re-port No. 94772/12), the Department of Education and the parents/guardians of the students was obtained by signing the informed consent form, in addition to obtain-ing the Consent of Participation of Person as a Subject.
The inclusion criterion was the absence of physical or motor restrictions that could impair the collection of anthropometric data.
We collected and recorded data relating to the gen-eral conditions and health of the child, such as age, sex, birth weight, current height and weight, time attending day care, the occurrence of diseases, control of parasitosis and the use of vitamins and medicines, socioeconomic data (level of education and parental occupation, house-hold income, number of family members, number of rooms in the house, basic sanitation and type of housing) as well as an anthropometric assessment with measure-ment of body weight and stature. The anthropometric measurements were determined using standard tech-niques.10,11 To measure the weight, a pre-calibrated Wiso
W910 ultra slim digital scale with capacity for 150 kg and
graduation in units of 100 g was used, and a WCS® sta-diometer, with measurements in triplicate.
The weight and height data were used to calculate the body mass index (BMI), which was then adjusted for age in the Z-score using the WHO’s growth curves.2 The
WHO criteria were used to classify the nutritional status,12
as well as that adopted by the Brazilian Ministry of Health,13 which was BMI for age, using the
Anthropomet-ric Program ANTHRO.14
Food consumption of the preschoolers was veriied using a previously validated qualitative Food Frequency Questionnaire (FFQ) completed by the child’s guardian or parent.15 Foods were categorized with the following
con-sumption frequencies: consumes versus does not consume. The “consumes” category included consumption when this occurred daily, weekly or fortnightly. The “does not” cat-egory included monthly consumption or just non-con-sumption. The questionnaire included foods consumed regionally and the usual food for this population.
For the statistical analysis a database was created using Statistical Package for the Social Sciences, software version 17.0.16 The results were presented using simple
and cross-frequency tables, with absolute values, percent-age, means and standard deviations, when necessary. In order to verify the association, Chi-square (χ2) test was
applied on the nominal variables and the Kruskal-Wallis test was used to test differences in proportions. Student’s t-test was applied to the numerical variables (age, weight, height). Pearson correlation was used in the Food Fre-quency in relation to nutritional state. Signiicance of 5% was adopted for all tests (p<0.05).17
RESULTS
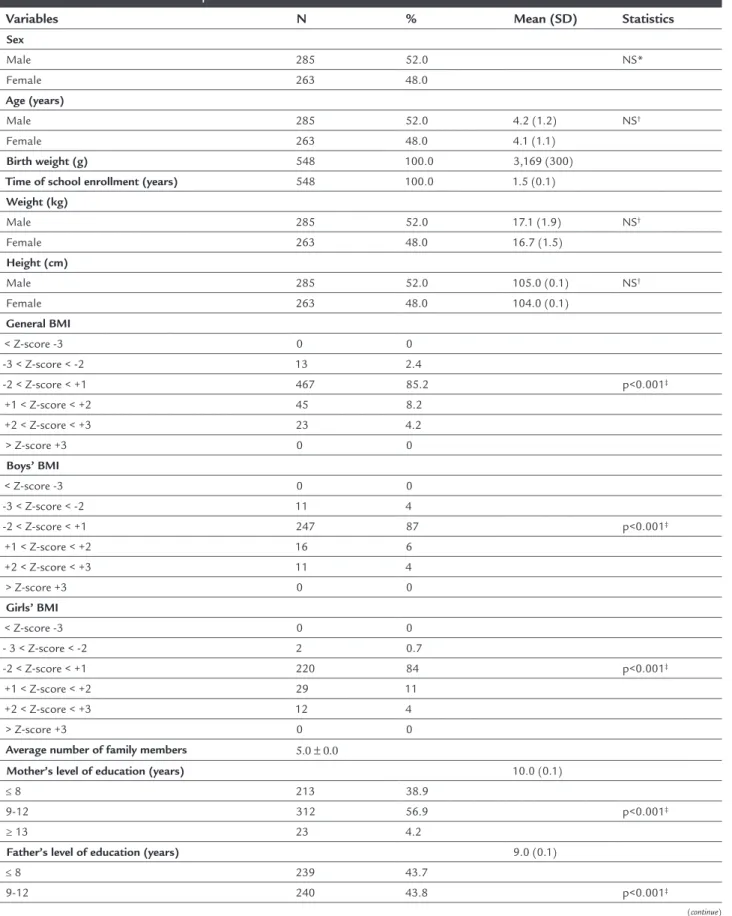
The sample was composed of 548 preschoolers aged be-tween 2 and 5 years originating from day care centers located in the city’s four zones. Fifty-two percent of the participants were male and 48% female, without a sig-niicant difference in the χ2 test, as per Table 1.
It can also be noted in Table 1 that the average age was 4 years and 2 months, and there was no signiicant difference (p=0.874) between age and sex. The birth weight was around 3.169 kg in the group of children studied and the average time enrolled at the school was 1 year and 6 months.
The average was ive people per family. Regarding the mother and father’s level of education, the average time of education of the mother was around 10 years, while the fathers were formally educated for 9 years on average. The stratum between 9 and 12 years of study presented the highest frequency in both variables re-lated to level of education.
As for family income, most families (59.7%) were in the stratum between 1 and 2 minimum wages, with only 10.2% families above this level, meaning that this popula-tion was characterized as being low income, a proile which is to be expected of preschoolers originating from public institutions.
Table 2 shows the results in absolute igures and per-centage referring to the housing conditions of the children participating in the study. The data showed an average of six rooms per residence which, when making a ratio of rooms to people, shows an approximate average of one room per person.
With respect to the type of housing, masonry/brick houses were predominant (95.8%), and only 4.2% of hous-es were made of rammed earth. In relation to power sup-ply, 100% of dwellings had electricity. The water supply from the public network was 97.8% indoors and only 2.2% outside of the home. The result also showed that 100% of homes were served by oficial garbage collection. It was noted with respect to sanitation that 88.7% of households were connected to public wastewater network and only 11.3% were served by a septic tank. In relation to the access roads, 53.5% of the families lived in regions with streets that were not paved.
Food consumption of the preschoolers is shown in Table 3 as percentages based on the responses given by the parents/guardians with regards to the foods consumed the most by the children.
We noted that the daily consumption of fruits and vegetables, chicken, eggs, beef liver, giblets and seafood was infrequent, which characterizes the presence of a monotonous diet, deicient in essential nutrients such as proteins of high biological value, vitamins, minerals, and unsaturated fatty acids essential for this growth phase.
We did not note the consumption of fast food in the group, probably because of the less favorable economic stratum and/or the age group in which they were found, which reduces access to this type of food.
Table 4 shows the results of the correlation between food consumption and nutritional status. It was observed that foods with a moderate positive correlation with risk of/excess weight were: soft drinks, butter and margarine, fried foods, coffee, pasta and artiicial juices. Meanwhile,
milk and dairy products, cookies, cakes, pies, sausages, breads and chocolate milk showed a strong correlation with risk and excess weight.
DISCUSSION
In relation to birth weight, a similar study found a fre-quency of overweight that was 64% higher in children who had a birth weight ≥ 3.9 kg.18 This suggests that the
mean (3.169 kg) obtained in this study may have been a protective factor for the overweight condition.
A study with 1,544 children of public day care centers revealed a mean of 4.6 persons per household,19 a value
close to that observed in our study. However, it indicated six years of maternal schooling and ive years for the father, lower values than those found in our research.
The years of education of the mother were closer to the level veriied in research assessing 132 children at day care centers in Rio de Janeiro, in the Brazilian state of Rio de Janeiro, which obtained a mean of 8.1 (± 3.05) years of schooling.20 However, this was well above that reported
in other studies assessing the prevalence and determinants of overweight among children and adolescents in the Brazilian state of Pernambuco, where the mean was four years of study for mothers.21
In our case, the time of formal education can be con-sidered as relatively positive, given that we studied a low--income group, which creates the expectation of lower educational levels. There are discrepancies in the literature with regard to maternal education and the occurrence of overweight and obesity among children, given that such schooling increases the chances of parents entering the labor market, leading to increased family income. On the other hand, it is believed that a higher level of education can contribute by creating greater concern with the health of the child, including the encouragement of physical activity and consumption of healthier food, in addition to facilitating access to better quality foods.22
It is possible to note a positive association between the mother’s level of education being greater than or equal to seven years of study and the occurrence of overweight among preschoolers.18 A study of 1,187 schoolchildren in
Divinópo-lis, state of Minas Gerais, Brazil, showed that the children of mothers with more than eight years of study had a 1.62 (1.19-2.19) times greater chance of being overweight than those whose mothers had eight years of study or less.23
Several studies have shown that in economically less developed regions/states the proportion of obesity rises with increasing income,21,24,25 which may justify the absence
TABLE 1 Characterization of the preschool children studied.
Variables N % Mean (SD) Statistics
Sex
Male 285 52.0 NS*
Female 263 48.0
Age (years)
Male 285 52.0 4.2 (1.2) NS†
Female 263 48.0 4.1 (1.1)
Birth weight (g) 548 100.0 3,169 (300)
Time of school enrollment (years) 548 100.0 1.5 (0.1)
Weight (kg)
Male 285 52.0 17.1 (1.9) NS†
Female 263 48.0 16.7 (1.5)
Height (cm)
Male 285 52.0 105.0 (0.1) NS†
Female 263 48.0 104.0 (0.1)
General BMI
< Z-score -3 0 0
-3 < Z-score < -2 13 2.4
-2 < Z-score < +1 467 85.2 p<0.001‡
+1 < Z-score < +2 45 8.2 +2 < Z-score < +3 23 4.2
> Z-score +3 0 0
Boys’ BMI
< Z-score -3 0 0
-3 < Z-score < -2 11 4
-2 < Z-score < +1 247 87 p<0.001‡
+1 < Z-score < +2 16 6 +2 < Z-score < +3 11 4
> Z-score +3 0 0
Girls’ BMI
< Z-score -3 0 0
- 3 < Z-score < -2 2 0.7
-2 < Z-score < +1 220 84 p<0.001‡
+1 < Z-score < +2 29 11 +2 < Z-score < +3 12 4
> Z-score +3 0 0
Average number of family members 5.0 ± 0.0
Mother’s level of education (years) 10.0 (0.1)
≤ 8 213 38.9
9-12 312 56.9 p<0.001‡
≥ 13 23 4.2
Father’s level of education (years) 9.0 (0.1)
≤ 8 239 43.7
9-12 240 43.8 p<0.001‡
TABLE 1 (Cont.) Characterization of the preschool children studied.
Variables N % Mean (SD) Statistics
≥ 13 35 6.3
No information 34 6.2
Family’s monthly income
< 1 165 30.1
1-2 327 59.7 p<0.001‡
≥ 3 56 10.2
*χ2 test; †: Student’s t-test; ‡ Kruskal-Wallis test; 5% signiicance level. NS: non signiicant; <Z-score -3: extremely thin; >Z-score -3 and <Z-score -2: thin; >Z-score -2 and <Z-score +1: normal weight;
>Z-score +1 and <Z-score +2: risk of excess weight; >Z-score +2 and <Z-score +3: excess weight; >Z-score +3: obesity; BMI: body mass index.
TABLE 2 Socioeconomic variables of the preschoolers’ families.
Variables N % Mean (SD)
Rooms per residence 6.0 (0.0)
Type of residence
Rammed earth 23 4.2
Bricks/cement 525 95.8
Electricity
Yes 548 100.0
No – –
Public water supply
Indoors 536 97.8
Out of the house 12 2.2
Garbage collection
Yes 548 100.0
No – –
Public wastewater
Sewage 486 88.7
Septic tank 62 11.3
Paved street
Yes 255 46.5
No 293 53.5
Child was ill in the last 15 days
Yes 100 18.2
No 448 81.9
Symptoms presented
Diarrhea 8 8.0
Coughing 33 33.0
Fever 59 59.0
Control of parasitic diseases
Yes 10 1.8
No 538 98.2
Use of medication
Yes 58 10.6
TABLE 3 Percentage of food items consumed by preschoolers.
Food item Consumes Does not consume
Chocolate milk 91.7 8.3
Rice 100.0 –
Tapioca pancake, couscous 79.5 20.5
Wafers, cakes, sweet pies 94.1 5.9
Coffee 78.9 21.1
Broths and soups 74.2 25.8
Red meat 97.1 2.9
Poultry 87.4 12.6
Breakfast cereals 77.8 22.2
Chocolate and ice cream 77.7 22.3
Processed meats 83.3 16.7
Flours 72.4 27.6
Beans 99.4 0.6
Bovine liver 59.5 40.5
Fried food 87.0 13.0
Fruit 98.5 1.5
Vegetables 75.9 14.1
Yogurt 86.9 13.1
Milk and dairy products 94.1 5.9
Pasta 78.3 21.7
Butter and margarine 95.4 4.6
Giblets 39.2 60.8
Porridge 61.8 38.2
Egg 82.2 17.8
Bread 98.5 1.5
Seafood 73.6 26.4
Formula 65.5 34.5
Ham 68.6 31.4
Soft drinks 90.2 9.8
Artiicial fruit juices 82.8 17.2
Natural fruit juices 89.8 10.2
Potatoes 76.1 23.9
group showed that children from families with an income of 2 to 3 minimum wages are twice as likely (OR 2.23, 95CI 1.34-3.72) to be overweight than those belonging to families with incomes of up to one minimum wage.26
Therefore, income is one of the factors that could encourage the consumption of healthier foods by increas-ing access to such, meanincreas-ing that diet may be a protective factor for overweight. However, the most appropriate choices do not depend exclusively on income but also family eating habits, level of education, and the avail-ability of time for the preparation of food, among others. Considering monetary income as an indicator of Food and Nutrition Security (FNS), it is assumed that increased income may help to create a favorable environment for food security.27
The results of this study show that the excess weight of the children studied is well below the national average (36.4%),3 as opposed to research where 578 children from
public day care centers in the urban region of São Paulo, state of São Paulo, Brazil, were evaluated (intervention study), indicating the prevalence of a 28.9% risk of overweight
and obesity. There was no signiicant difference when com-paring different age strata.28 The research also noted a 20.8%
risk of overweight, 5.2% overweight and 12.7% obesity in 403 preschoolers from the private education network in Teresina, state of Piauí, Brazil.29 Closer results were observed
by researchers who assessed 1,435 children from the urban and rural zones of Pernambuco, Brazil, and determined a prevalence of 9.5% overweight and 3.8% obesity.21
The National Demography and Health Survey showed a prevalence of 7.8% of some degree of overweight among children aged under 5 years, associating this condition with the early introduction of foods, consumption of processed foods and sedentary lifestyle.30
In quilombo communities, a 6.0% prevalence of obe-sity was found by analyzing 724 children in the preschool age range from quilombo communities.31 The closest
results to the present study were observed in research that indicated an 8.2% prevalence of overweight and 2.5% of obesity.32 Most studies show that overweight has a
high-er prevalence than obesity, with a variation in these results with respect to age group and sex.32,33
TABLE 4 Correlation between food consumption and nutritional status of the preschool children.
Consumption of food item Nutritional status
Thin Normal weight Risk of/Excess weight
r2 r2 r2
Rice 0.236 0.657* 0.256
Beans – 0.721* 0.287
Fruit – 0.756* 0.143
Bread – 0.453 0.723*
Red meat 0.218 0.856* 0.212
Butter, margarine – 0.687* 0.651*
Wafers, cakes, sweet pies 0.298 0.489 0.832* Milk and dairy products – 0.721* 0.854*
Chocolate milk – 0.218 0.722*
Soft drinks – 0.254 0.698*
Natural fruit juices – 0.465 0.176
Poultry – 0.854* 0.356
Fried food – 0.111 0.602*
Yogurt – 0.643* 0.231
Vegetables – 0.643* 0.115
Processed meats – 0.634* 0.754*
Artiicial fruit juices – 0.287 0.376
Pasta – 0.367 0.432
Coffee – 0.898* 0.643*
Smoothies – 0.549 –
Considering that we studied children from all regions of the city, the results obtained are satisfactory with regard to housing conditions, given that almost the entire sam-ple is served by basic services such as water supply, elec-tricity and garbage collection, but insufficient basic sanitation. It is known that access to such services may inluence the child’s general health conditions and, there-fore, their nutritional status.
In general, certain reasons for the results observed in this study may be proposed, including the improve-ment of population’s living conditions, probably due to certain welfare programs, as well as greater access to healthcare. In addition to these, it is worth mentioning the protective effect due to the presence of these children in the day care centers, where the food provided must meet 30% of the daily nutritional requirements, distrib-uted in at least two meals.34
The relationship between attendance at the day care center and the nutritional status of preschool children has been gaining interest in the current scenario, given that the children spend most of their day at such institu-tions, meaning that day care centers are responsible for providing most daily meals and, consequently, the supply of nutrients.26 In addition, these institutions no longer
have merely a “supporting role” and have assumed an important function in child education, including the promotion of health actions that interfere in the nutri-tional status of preschool children.
The qualitative analysis of the children’s diet does not allow us to infer about quantitative adequacy. How-ever, it does enable an assessment of the diversity of the diet, given that it is known that a diversiied diet is as-sociated with greater quantitative adequacy, as it implies the intake of various nutrients.
The assessment of the usual consumption of food allows us to predict the risk that the consumption of certain foods can entail in the development of certain diseases, as it is possible to identify the cumulative effect of several nutrients simultaneously on health.35
According to Vilela et al.,36 food choices are
extreme-ly important to proper growth and development because the quality and quantity of food ingested interferes with the supply of nutrients and nutritional status. The food consumption proile of the group under study was char-acterized by frequent intake of foods considered as tra-ditional, such as “rice and beans,” which is typical of the Brazilian culture, as well as other fundamental foods for appropriate child growth and development, such as milk and dairy products and red meat, which are important
sources of protein, in addition fruits, which are sources of essential vitamins and minerals.
When analyzing which foods are consumed the most in Brazil, it was noted that those with the greatest fre-quency of use throughout the national territory and in all levels of family income were rice, beans, coffee, bread and beef, respectively.37 This data is in concordance with
the results of this study with regard to the foods rice, beans, bread and red meat.
Similar results were observed in a study38 analyzing
the dietary intake of public and private schoolchildren in São Luís, Brazil. The foods consumed the most were rice (97.6%), bread (77.6%), beans (61.6%), butter/marga-rine (61.1%), and beef (59.6%).
Another unfavorable aspect observed in the diet of these children was the large number of children frequent-ly consuming soft drinks to the detriment of the consump-tion of natural fruit juices and smoothies. Several reasons can be suggested as determinants, including convenience and lower cost. Excessive consumption of soft drinks and industrialized juices, foods with low levels of vitamins and minerals and high levels of additives and sugars, is a concern, given that drinks are capable of increasing the energy content of the diet and encouraging the emergence of obesity and related complications.39
The parents’ choice of which foods to offer their chil-dren may be due to a lack of suficient knowledge about the most important foods for the nutrition and develop-ment of these children and the association between the consumption of certain foods withsocial status and higher purchasing power because they are constantly exposed by the media.
In general, it could be said that this is not a very di-versiied diet, which can also be seen in a study that showed the consumption of a diet with little variety, with a high intake of cereals and low consumption of fruits, legumes and vegetables.31
Although ours is a low-income population, the vast majority of those responsible for the children reported the frequent consumption of food declared as being high cost. This fact is not in agreement with research that shows a trend of reduced consumption of foods such as meat, milk and dairy products, fruits, vegetables and legumes the lower the family income, due to the high cost of these foods.40
associa-tion is easily justiied by the inverse correlaassocia-tion between the cost of food and its energy density.41
Research conducted with children using the public health network in Aracaju, Brazil, indicated high food con-sumption of cereals, meat, sugars, oils and fats and low consumption of fruits and vegetables.42 In the group under
study it was also possible to note that the milk and dairy products food group was the one with the greatest share in the diet of this population, probably for dealing with chil-dren aged 6-35 months, a period where parents prioritize a milk-based diet, in the form of porridge, mash and purees.42
Considering the correlation between food consumption and nutritional status, a similar result was observed, espe-cially the excessive consumption of soft drinks and artiicial juices as risk factors for overweight in preschool age.18
On the other hand, studies show that the frequent consumption (three times per week) of fruits and vegetables showed a protective effect in the development of overweight and obesity, considering children between 5 and 9 years.43,44
For some authors,36,45 the study of the diet with
vari-ous combinations of food rather than the consumption of individual food items or the intake of nutrients may be of greater interest, considering that foods are not con-sumed in isolation and relect each individual’s choice for a particular lifestyle.
CONCLUSION
The results of our study were positive regarding the prev-alence of overweight and obesity among the group of preschoolers, showing prevalence well below the nation-al average. In relation to food intake, it should be noted that the presence of some foods like cookies, cakes, pies and chocolate milk is more frequent than ideal, and these foods were declared by a large proportion of children. It is noteworthy that these are foods high in sugars, which undermines the concept of healthy eating and may favor the emergence of overweight and obesity.
Given these results, food and nutrition policies that encourage the consumption of healthy foods and maintain the consumption of basic traditional foods such as rice and beans are necessary, while at the same time encourag-ing a reduction in the consumption of processed foods that are high in sodium, saturated fat and simple sugars.
ACKNOWLEDGMENTS
Thanks to the Coordination of Improvement of Higher Level Personnel (CAPES) for the master’s degree scholar-ship awarded, the Municipal Department of Education, and the principals, professors, parents/guardians and children for their participation.
RESUMO
Excesso de peso e obesidade em pré-escolares: prevalência e relação com consumo alimentar
Objetivo: Determinar a prevalência de excesso de peso e obesidade em pré-escolares de instituições públicas de ensino e sua relação com consumo alimentar.
Método: Estudo transversal com crianças de 2 a 5 anos, de ambos os sexos, atendidas em creches municipais. Co-letaram-se dados socioeconômicos, demográicos e antro-pométricos, para cálculo do índice de massa corpórea (IMC) por idade. Os dados sobre consumo alimentar foram ava-liados por meio de Questionário de Frequência Alimentar. Utilizaram-se os testes do χ2, Kruskal-Wallis, t de Student
e correlação de Pearson, com nível de signiicância de 5%.
Resultados: Das 548 crianças, 52% eram do sexo mascu-lino, com média de idade de 4,2 anos. A maioria das fa-mílias apresentou renda entre 1 e 2 salários mínimos (59,7%) e escolaridade materna de 10 anos. Os parâmetros antropométricos não apresentaram diferença signiicati-va entre os sexos. Segundo o IMC/I, veriicou-se que a maioria das crianças estava eutróica (85,2%); 8,2%, com risco de excesso de peso; 4,2%, com excesso de peso. Os alimentos mais consumidos foram: arroz (100%), feijão (99,4%), pães (98,5%), frutas (98,5%), carne vermelha (97,1%), manteiga e margarina (95,4%), bolachas, bolos, tortas doces (94,1%), leite e derivados (94,1%), achocola-tado (91,7%) e refrigerantes (90,2%). Os alimentos consu-midos que apresentaram forte correlação (r > 0,7) com o risco/excesso de peso foram: pães; bolachas, bolos, tortas doces; leite e derivados; achocolatados e embutidos.
Conclusão: Observaram-se baixa prevalência de excesso de peso e ausência de obesidade entre o público pesqui-sado. O risco de excesso de peso foi maior entre as meni-nas. O estudo mostrou desvios no consumo alimentar.
Palavras-chave: excesso de peso, obesidade, pré-escolar, consumo alimentar.
REFERENCES
1. Xavier MO, Bielemann RM, Maciel FV, Neutzling MB, Gigante DP. Variação temporal no excesso de peso e obesidade em adolescentes de escola privada do Sul do Brasil. Rev Bras Atividade Física Saúde. 2014; 19(1):74-85. 2. World Health Organization (WHO). Childhood overweight and obesity on
the rise. Geneva: WHO; 2010.
3. Instituto Brasileiro de Geograia e Estatística (IBGE). POF 2008 2009 - Antropometria e estado nutricional de crianças, adolescentes e adultos no Brasil. IBGE; 2010.
4. Antunes A, Moreira P. [Prevalence of overweight and obesity: in Portuguese children and adolescents]. Acta Med Port. 2011; 24(2):279-84.
community-based obesity prevention interventions among adolescents. BMJ Open. 2015; 5(1):e006586.
6. Caetano MC, Ortiz TT, Silva SG, Souza FI, Sarni SO. Complementary feeding: inappropriate practices in infants. J Pediatr (Rio J). 2010; 86(3):196-201. 7. Owen CG, Martin RM, Whincup PH, Smith GD, Cook DG. Effect of infant
feeding on the risk of obesity across the life course: a quantitative review of published evidence. Pediatrics 2005; 115(5):1367-77.
8. Spinelli MGN, Morimoto JM, Freitas APG, Barros CM, Dias DHS, Pioltine MB, et al. Estado nutricional e consumo alimentar de pré-escolares e escolares de escola privada. Ciência & Saúde. 2013; 6(2):94-101.
9. Silva JB, Silva FG, Medeiros HJ, Roncalli AG, Knackfuss MI. Estado nutricional de escolares do semi-árido do Nordeste brasileiro. Rev Saúde Pública. 2009; 11(1):62-71.
10. Cameron N. Anthropometric measurements. In: Cameron N, editor. The measurement of human growth. London: CroomHelm; 1984. p. 56-99. 11. Jelliffe DB, Jelliffe EFP. Community nutritional assessment with special
reference to less technically developed countries. 2. ed. London: Oxford University Press; 1989.
12. World Health Organization. WHO child growth standards: Length/height--for-age, weightLength/height--for-age, weight-for-length, weight-for-height and body mass index-for-age. Methods and development. WHO (nonserial publication). Geneva: WHO; 2006.
13. Brasil. Ministério da Saúde. Secretaria de Atenção à Saúde. Departamento de Atenção Básica. Orientações para a coleta e análise de dados antropométricos em serviços de saúde: Norma Técnica do Sistema de Vigilância Alimentar e Nutricional - SISVAN / Ministério da Saúde, Secretaria de Atenção à Saúde, Departamento de Atenção Básica. Brasília: Ministério da Saúde; 2011.
14. World Health Organization – WHO, Anthro 2011 for Personal Computers Manual. Software for assessing growth and development of the world’s children. World Health Organization; 2011.
15. Brandão SASM. Excesso de peso, obesidade, consumo alimentar e atividade física em pré-escolares de Teresina-PI. 2014 [dissertation]. Teresina: Universidade Federal do Piauí; 2014.
16. SPSS, Statistical Package for the Social Sciences – SPPS, versão 17.0; 2006. 17. Andrade DF, Ogliori PJ. Estatística para as ciências agrárias e biológicas:
com noções de experimentação. 2. ed. Florianópolis: Editora da UFSC; 2010. p. 470.
18. Silveira JAC, Colugnati FAB, Cocetti M, Taddei JAAC. Secular trends and fac-tors associated with overweight among Brazilian preschool children: PNSN--1989, PNDS-1996, and 2006/07. J Pediatr (Rio J). 2014; 90(3):258-66. 19. Shoeps DO, Abreu LC, Valenti VE, Nascimento VG, Oliveira AG, Gallo PR,
et al. Nutritional status of pre-school children from low income families. Nutr J. 2011; 10:43.
20. Azevedo ECC, Dias FMRS, Diniz AS, Cabral PC. Consumo alimentar de risco e proteção para as doenças crônicas não transmissíveis e sua associação com a gordura corporal: um estudo com funcionários da área de saúde de uma universidade. Cienc Saúde Coletiva. 2014; 19(5):1613-22.
21. Leal VS, Lira PIC, Oliveira JS, Menezes RCE, Sequeira LAS, Arruda Neto MA, et al. [Overweight in children and adolescents in Pernambuco State, Brazil: prevalence and determinants]. Cad Saúde Pública. 2012; 28(6):1175-82. 22. Gopinath B, Baur AL, Burlutsky G, Robaei D, Mitchell P. Socioeconomic,
familial and perinatal factors associated with obesity in Sydney schoolchildren. J Pediatrics Child Health. 2012; 48(1):44-51.
23. Souza MCC, Tibúrcio JD, Bicalho JMF, Rennó HMS, Dutra JS, Campos LG, et al. Fatores associados à obesidade e sobrepeso em escolares. Texto Contexto Enferm. 2014; 23(3):712-9.
24. Guedes DP, Miranda Neto JT, Almeida MJ, Silva AJRM. Impacto de fatores sociodemográicos e comportamentais na prevalência de sobrepeso e obesidade de escolares. Rev Bras Cineantropom Desemp Hum. 2010; 12(4):221-31.
25. Alencar MSS, Barros SEL, Borges IS, Cavalcante KN, Melo MTSM, Nunes IFOC et al. Adequacies and inadequacies in the anthropometric and dietetic proiles of preschool children. J Hum Growth Dev. 2016; 26(2):234-242.
26. Pereira AS, Peixoto NGA, Nogueira Neto JF, Lanzillotti HS, Soares EA. Estado nutricional de pré-escolares de creche pública: um estudo longitudinal. Cad Saúde Colet. 2013; 21(2):140-7.
27. Segall-Corrêa AM, Marin-Leon L, Helito H, Pérez-Escamilla R, Santos LMP, Paes-Sousa R. Transferência de renda e segurança alimentar no Brasil: análise dos dados nacionais. Rev Nutr. 2008; 21(Suppl 0):S39-51.
28. Nascimento VG, Silva JPC, Machado TC, Bertoli CJ, Valenti VE, Leone C. Preschool children and excess weight: the impact of a low complexity intervention in public day care centers. J Hum Growth Dev. 2013; 23(3):1-7. 29. Costa MJM, Araújo MLLM, Araújo MAM, Moreira-Araújo RSR. Excesso de peso e obesidade em pré-escolares e a prática de atividade física. Rev Bras Ciencia Mov. 2015; 23(3):70-80.
30. Brasil. Ministério da Saúde. Secretaria de Ciência, Tecnologia E Insumos Estratégicos - Departamento de Ciência e Tecnologia. Pesquisa Nacional de Demograia e Saúde da Criança e da Mulher – PNDS 2006 [Relatório]. Brasília: Ministério da Saúde; 2008.
31. Leite FMB, Ferreira HS, Bezerra MKA, Assunção ML, Horta BL. Consumo alimentar e estado nutricional de pré-escolares das comunidades remanescentes dos quilombos do estado de Alagoas. Rev Paul Pediatr. 2013; 31(4):444-51.
32. Pereira LL, Furlanetto C, Ferreira LM, Trespach SS, Silva MA, Ceretta LB. Prevalência de sobrepeso e obesidade infantil entre lactentes, pré-escolares e escolares em uma área de abrangência do PET-SAÚDE. Arq Catarin Med. 2012; 41(4):9-14.
33. Simon VGN, Souza JMP, Leone CS, Souza SB. Prevalência de sobrepeso e obesidade em crianças de dois a seis anos matriculadas em escolas particulares no município de São Paulo. Rev Bras Cresc Desenvolv Hum. 2009; 19(2):211-8.
34. Brasil. Ministério da Educação. Fundo Nacional de Desenvolvimento da Educação. Ministério da Educação. Resolução/CD/FNDE nº 26, de 17 de junho de 2013. Dispõe sobre o atendimento da alimentação escolar aos alunos da educação básica no âmbito do Programa Nacional de Alimentação Escolar – PNAE; 2013.
35. Nobre LN, Lamounier JA, Franceschini SC. Sociodemographic, anthropometric and dietary determinants of dyslipidemia in preschoolers. J Pediatr (Rio J). 2013; 89(5):462-9.
36. Vilela AAF, Sichieri R, Pereira RA, Cunha DB, Rodrigues PRM, Gonçalves--Silva RMV, et al. Dietary patterns associated with anthropometric
indica-tors of abdominal fat in adults. Cad Saúde Pública. 2014; 30(3):502-10. 37. Souza AM, Pereira RA, Yokoo EM, Levy RB, Sichieri R. Alimentos mais
consumidos no Brasil: Inquérito nacional de alimentação 2008-2009. Rev Saúde Pública. 2013; 47(1):190S-9S.
38. Conceição SIO, Santos CJN, Silva AAM, Silva JS, Oliveira TC. Consumo alimentar de escolares das redes pública e privada de ensino em São Luís, Maranhão. Rev Nutr. 2010; 23(6):993-1004.
39. Rampersaud GC, Bailey LB, Kauwell GPA. National survey beverage consumption data for children and adolescents indicate the need to encourage a shift toward more nutritive beverages. J Am Diet Assoc. 2003; 103(1):97-100. 40. Panigassi G, Segall-Corrêa AM, Marin-León L, Pérez-Escamilla R, Maranha LK, Sampaio MFA. Insegurança alimentar intrafamiliar e peril de consumo de alimentos. Rev Nutr. 2008; 21(Suppl 0):135s-44s.
41. Drewnowski A, Specter SE. Poverty and obesity: the role of energy density and energy costs. Am J Clin Nutr. 2004; 79(1):6-16.
42. Alves CRL, Santos LC, Goulart LMHF, Castro PR. Complementary feeding of children in the second year of life. Rev Paul Pediatria. 2012; 30(4):499-506.
43. Enes CC, Slater B. [Obesity in adolescence and its main determinants]. Rev Bras Epidemiol. 2010; 13(1):163-71.
44. Oliveira AM, Cerqueira EM, Souza JS, Oliveira AC.[ Childhood overweight and obesity: inluence of biological and environmental factors in Feira de Santana, BA]. Arq Bras Endocrinol Metab. 2003; 47(2):144-50.