1
Universidade Federal da Paraíba, Centro de Ciências da Saúde, Departamento de Nutrição. Campus I, Cidade Universitária, s/n., Castelo Branco, 58059-900, João Pessoa, PB, Brasil. Correspondência para/Correspondence to: JS AQUINO. E-mail: <[email protected]>.
2
Universidade Federal de Pernambuco, Centro de Ciências da Saúde, Departamento de Nutrição. Recife, PE, Brasil.
3
Universidade Federal do Piauí, Centro de Ciências da Saúde, Departamento de Nutrição. Picos, PI, Brasil.
Food insecurity and socioeconomic, food
and nutrition profile of schoolchildren living
in urban and rural areas of Picos, Piauí
Insegurança alimentar e perfil socioeconômico,
alimentar e nutricional de escolares de áreas
urbana e rural do município de Picos, Piauí
Jailane de Souza AQUINO1
Leopoldina Augusta Souza SEQUEIRA-DE-ANDRADE2
Patrícia Elaine Bellini Alencar da SILVA3
Alciene Pacheco da SILVA3
Cid Rangel de Sousa VIEIRA3
Pedro Israel Cabral de LIRA2
A B S T R A C T
Objective
This study aimed to determine the prevalence of food insecurity among schoolchildren living in urban and rural areas of Picos,Piauí associated with the socioeconomic profile of families and their food intake and nutritional status.
Methods
Study participants were families with children aged 7-10 years enrolled in municipal schools, totaling 342 families/schoolchildren. The study was conducted at school facilities through interviews with mothers - or guardians - using a questionnaire based on the Brazilian Food Insecurity Scale and socioeconomic variables and food frequency questionnaire. The nutritional status of children was assessed using the following indexes: weight/age, height/age and body mass index/age.
Results
insecurity (p≤0.01). In urban areas, higher percentage of food insecurity was associated to lower educational levels (p≤0.05). Dietary intake and nutritional status of schoolchildren were not associated with food insecurity condition of families.
Conclusion
The percentage of families at food insecurity, as well as the food consumption and nutritional status of schoolchildren were similar between urban and rural areas, characterized as a homogeneous population in terms of socioeconomic conditions.
Indexing terms: Food consumption. Food security. Nutritional status. Socioeconomic indicators.
R E S U M O
Objetivo
Determinar a prevalência de insegurança alimentar em famílias com escolares de áreas urbana e rural do município de Picos, Piauí, relacionando-a com o perfil socioeconômico das famílias, com o consumo alimentar e o estado nutricional dos escolares.
Métodos
Participaram do estudo famílias com escolares entre 7 e 10 anos matriculados na rede municipal de ensino, totalizando 342 famílias/escolares. O estudo foi conduzido na própria escola, mediante entrevista com as mães ou responsáveis, utilizando-se questionários baseados na Escala Brasileira de Insegurança Alimentar e variáveis socioeconômicas das famílias e de frequência alimentar dos escolares. O estado nutricional dos escolares foi avaliado quanto aos índices: peso/ idade, altura/idade e índice de massa corporal/idade.
Resultados
A prevalência de insegurança alimentar foi elevada e similar para as áreas rural e urbana: 84,3% e 83,3% respectivamente. No geral, a menor renda familiar e o consumo de água sem tratamento estiveram associados à maior frequência de insegurança alimentar (p≤0,01). Na área urbana, observa-se um maior percentual de insegurança alimentar para os menores níveis de escolaridade (p≤0,05). O consumo alimentar e o perfil nutricional dos escolares não estiveram associados à condição de insegurança alimentar de suas famílias.
Conclusão
O percentual de famílias em insegurança alimentar bem como o perfil de consumo alimentar e nutricional dos escolares foram similares entre as áreas urbana e rural, caracterizando-se como uma população homogênea quanto às condições socioeconômicas.
Termos de indexação: Consumo de alimentos. Segurança alimentar e nutricional. Estado nutricional.
Indicadores socioeconômicos.
I N T R O D U C T I O N
Food and nutrition security is defined as “the everyone’s right to regular and permanent access to quality food in sufficient quantity, without compromising access to other essential needs based on health-promoting food practices that respect cultural diversity and are socially, economically and environmentally sustainable”1 (p.15). This condition must be ensured in a context of full access to other fundamental rights such as education, housing, health and social welfare within an autonomous and sustainable
development process based on the exercise of ethical and culturally acceptable labor activity2.
Food insecurity can be measured through food and nutrition surveillance, food intake surveys and local information systems. Food insecurity also involves important psychosocial components such the concern or uncertainty of whether or not there will be food next month3.
insecurity in groups or populations at risk at local, regional or national levels4. Children are the population group most vulnerable to food insecurity, since the nutritional consequences are more immediate and serious, and also because, when a child has nutritional problems due to dietary deficiency, it could be inferred that adults in the household have been feeding insufficiently for some period of time5.
From the nutritional point of view, there is no doubt about the importance of proper nutrition to ensure growth and development, especially during childhood, and in adulthood, proper nutrition plays the role of promoting and maintaining health and well-being. When submitted to severe dietary restrictions, children are exposed to nutritional deficiencies and exhibit poor growth conditions, contributing to increased vulnerability to infections and deficiencies in the maturation of the nervous system and mental and intellectual development, causing morphological and functional imbalances which, depending on intensity and duration, may be irreversible6.
Few studies have addressed the association between food insecurity and place of residence7-9. Some studies have provided explanations for spatial variations and access to food, and reported that residents in urban areas have greater access to goods and services essential for health maintenance than residents of rural areas10. However, in a study conducted in the state of
Amazonas, the forms of food insecurity showed a trend of lower prevalence in rural areas (68.7%) when compared with urban area of Manaus (AM), (89.1%), especially the severe form of food insecurity, with 28.2% in rural areas compared to 44.6% in urban areas11.
In this context, the aim of this study was to determine the prevalence of food insecurity among schoolchildren living in urban and rural areas of Picos (PI), relating it to the socioeconomic profile of families, as well as the food consumption and nutritional status of schoolchildren.
M E T H O D S
This is a cross-sectional study including families with children aged 7-10 years. The sample size was calculated based on the universe of 4,398 children in the age group of interest enrolled in 64 municipal schools in urban and rural areas of
Picos (PI), adopting a significance level of 95% for a prevalence of 20% of moderate and severe food insecurity, average value found for the state of Piaui12, with a sampling error of ± 4.5% (Epi-Info version 6.04b), taking into account a loss of approximately 20%, totaling 342 students/ families with sample representativeness for the municipality. This municipality has population of 73,414 inhabitants and area of 534.715 km2 and is located 330 km away from the state capital13.
Municipal schools were selected according to areas enclosed by the Department of Education of Picos (PI). For data collection, students’ parents were called and those who agreed to participate in the study signed the Informed Consent Form. The study was approved by the Ethics Committee on Human Research of the Universidade Federal do Piauí (nº 0176.0.045.000-08). The team of interviewers was previously trained for the application of questionnaires and data collection was carried out from August 2009 to February 2010. Initially, the socioeconomic questionnaire was applied to parents or guardians, containing variables such as family income, living conditions (sewage service, garbage collection, access to treated water, etc.), educational level and participation in government income transfer programs.
response to the food insecurity questionnaire scores 1 point, and the sum is the scale score, ranging from 0 to 15 points as follows: security 0; mild insecurity 1-5 points; moderate insecurity 6-10 points and severe insecurity 11-15 points in families with children under 18 years of age14.
The Food Frequency Questionnaire was also applied to parents or guardians as an interview, assessing the consumption of 54 foods, divided into the following groups: cereals, pasta, legumes, fruits, eggs, vegetables, roots and tubers, meats, dairy products, sweets and fats. The consumption frequency was classified as “rarely”, “less than once a month”, “from one to three times a month,” “once a week”, “from two to four times a week”, “once a day”, “two or more times a day. “Rarely” was defined as occasional consumption or no consumption15.
To assess the nutritional status, weight and height were measured by trained Nutrition students. For weight, Tanita digital scale (São Paulo, Brazil) with capacity of up to 150 kg and 100 g precision was used, and children were weighed barefoot and with minimal clothing. Height was measured with the use of measuring tape adhered to wall without footers and a wooden square, according to recommendations of Lohman et al.16. For this measure, the tape was attached to the wall and children were placed upright, barefoot, with upper limbs along the body and heels, back and head touching the wall. Children were classified according to their nutritional status as recommended by World Health Organization (WHO)17, using the Height/ Age (H/A), Weight/Age (W/A) and Body Mass Index/Age (BMI/A) ratios. Children with Z-scores greater than 2.0 above the median of the reference population were considered obese; overweight with Z-score greater than 1.0 above the median of the reference population and low weight those with Z-scores 2.0 below the median of the reference population. Children with Z-scores below 2.0 were considered with growth deficit.
For analysis of the anthropometric data, the Anthro-Plus software version 3.2.2 was used.
To verify the existence of association between place of residence according to food insecurity (outcome variable) and socioeconomic and anthropometric variables and dietary intake (independent variables), the Chi-square test was used, adopting significance level of p≤0.05. The Epi Info software version 6.04b was used for analyses.
R E S U L T S
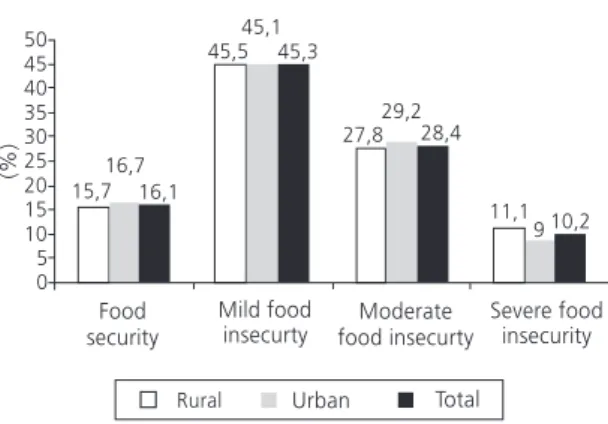
Figure 1 shows that the prevalence of food insecurity was high and similar for rural and urban areas (84.3% and 83.3%, respectively), and moderate and severe food insecurity values were 38 9% and 38.2%, respectively.
Table 1 shows that for the entire sample (n=342), in families with lower income, there is a higher prevalence of food insecurity (p≤0.01), with similar behavior among families living in rural and urban areas. Regarding the educational level of the family head, there is a higher percentage of food insecurity for the lowest educational levels, especially illiterates, only in the urban area (p≤0.05).
Consumption of treated water was associated with lower frequency of food
insecurity, unlike households that consume untreated water in both rural and urban areas (p≤0.01). Regarding the type of housing in the urban area, the lowest percentage of food insecurity occurred in households with worst construction conditions (mud, canvas and other materials), which seems a contradictory situation, probably due to the small number of households in this condition (16%).
Most of the families receive financial resources from government income transfer programs, with more than 80% of families living
in urban and rural areas of Picos (PI) receiving these resources.
The dietary intake of students for the total sample (Figure 2) showed no statistically significant difference with respect to food insecurity, the same occurring for rural and urban areas (data not shown).
Considering the foods analyzed, it was observed that the most consumed foods are cereals, sugars and fats. Roots, eggs, miscellaneous (ice cream, soft drinks, processed juices) and vegetables in this order are among Table 1. Food insecurity classification according to the socioeconomic characteristics and housing conditions of families with
schoolchildren living in urban and rural areas of the city of Picos (PI), 2009.
Gender of family head
Male Female
Income
<1 MW
≥1 MW
Income transfer programs
Yes No
Educational level of family head
Illiterate
Incomplete elementary school Full high school or more
Type of housing
Masonry Other type Garbage collection Public Other Water supply Public network Other system Water consumption
Treated, bottled and boiled Tap water Sewage system Public network Other system 160 182 231 111 274 68 78 192 72 286 56 281 60 248 94 104 238 90 252 15.6 16.5 ** 12.6 23.4 15.3 19.1 10.3 16.7 20.8 15.0 21.4 16.4 15.0 17.3 12.8 *** 28.8 10.5 18.9 15.1 84.4 83.5 87.4 76.6 84.7 80.9 89.7 83.3 79.2 85.0 78.6 83.6 85.0 82.7 87.2 71.2 89.5 81.1 84.9 Variables
n=342 FS % FI %
Total 91 107 142 56 160 37 56 110 32 160 38 155 42 111 87 55 143 43 155 15.4 15.9 † 12.7 23.2 14.4 21.6 14.3 17.3 12.5 15.6 15.8 16.1 14.3 17.1 13.8 ** 27.3 11.2 11.6 16.8 84.6 84.1 87.3 76.8 85.6 78.4 85.7 82.7 87.5 84.4 84.2 83.9 85.7 82.9 86.2 72.7 88.8 88.4 83.2
n=198 FS % FI %
Rural 69 75 89 55 114 31 22 82 40 126 18 126 18 137 07 49 95 47 97 015.9 017.3 † 012.4 023.6 016.7 016.1 * 000.0 015.9 027.5 * 014.3 033.3 016.7 016.7 017.5 000.0 ** 030.6 009.5 † 025.5 012.4 084.1 082.7 087.6 076.4 083.3 083.9 100.0 084.1 072.5 085.7 066.7 083.3 083.3 082.5 100.0 069.4 090.5 074.5 087.6
n=144 FS % FI %
Urban
Note: †p
≤0.10; *p
≤0.05; **p
≤0.01; ***p
≤0.001.
the less consumed foods by schoolchildren. Among the protein sources, beans and dairy products are more consumed than meats and eggs. High consumption of coffee and beans was observed, exceeding 56% and 75%, respectively. However, less than 50% of children consume fruits and vegetables at least once a day. Regarding the study outcome, children at food security consume a little more meat and vegetables than children at food insecurity, although without significant differences.
Table 2 shows that there was no statistical difference for anthropometric indicators of
Figure 2. Food consumed by schoolchildren (n=342) at least once a day, according to food insecurity. Picos (PI), 2009. Note: p<0.05.
Table 2. Nutritional profile of schoolchildren according to the food insecurity classification and place of residence, Picos (PI), 2009.
BMI/age* Low weight Normal weight Overweight
Weight/age* Weight deficit Normal weight
Height/age* Height deficit Normal height
14 289 39
21 307
14 (4.1) 328 (95.9)
03.6 85.5 10.9
09.1 90.9
05.5 94.5
04.2 84.3 11.5
05.9 94.1
03.8 96.2 Anthropometric variables
n=342 FS % FI %
Total
7 168
23
11 180
7 191
03.2 87.1 09.7
09.7 90.3
03.2 96.8
03.6 84.4 12.0
05.0 95.0
03.6 96.4
n=198 FS % FI %
Rural
7 121
16
10 127
7 137
04.2 83.3 12.5
08.3 91.7
08.3 91.7
05.0 84.2 10.8
07.1 92.9
04.2 95.8
n=144 FS % FI %
Urban
Note: *p<0.05.
FS: Food Security; FI: Food Insecurity; BMI: Body Mass Index.
schoolchildren living in rural and urban areas, either when associated with food insecurity, probably due to the low prevalence of anthropometric deficit with values between 6.4% and 4.1%.
D I S C U S S I O N
In the present study, no difference was observed in the prevalence of food insecurity among families with children living in urban and rural areas of Picos (PI). However, the percentages of the most severe forms of food insecurity were higher than the average for families with children under 18 years of age in the state of Piauí, which was 10.6% for moderate food insecurity and 6.9% for severe food insecurity in the urban area, and 15.9 and 10.7% in rural areas. Similarly, moderate and severe food insecurity was higher than the average found for children aged 4 to 7 and 8 to10 years, of 26.9% and 18.8%, respectively, in the state of Piauí12.
found that families living in the urban area of
Manaus (AM) had higher prevalence of food insecurity compared to those living in rural areas. In a study conducted by the United States Departament of Agriculture, highest prevalence of food insecurity was detected in large cities and in rural areas17, since individual perception of food insecurity and socioeconomic indicators play an important role, regardless of place of residence, whether rural or urban9.
Similarity in the prevalence of food insecurity of families living in urban and rural areas of Picos (PI) with income less than 1 minimum wage (87.3 to 87.6%), near 85.4%, was observed, which corroborates the results by Yuyama et al.11 for families living in the urban area of Manaus (AM) with income less than 1 minimum wage.
In the present study, low income and low educational level of the family head were associated with higher prevalence of food insecurity. According to Sales-Costa et al.18, income and education are determinants of food insecurity, since low family income and educational level significantly contribute to increasing food insecurity, as well as the availability of treated water and sewage system, since they are associated with the provision of basic public services.
In a study conducted in Duque de Caxias
(RJ), sanitary conditions were not associated with perception of food insecurity; however, the consumption of treated water was positively associated with food security18, which result is similar to the present study, in which the consumption of treated, bottled or boiled water, whether in urban or rural areas, was decisive and significantly higher (p≤0.01) among families in food security.
Government income transfer programs were not able to influence the income of these families, and most of them have monthly income less than one minimum wage. According to the 2004 National Household Survey12, levels of food insecurity - mild, moderate or severe - affected 66% of families with at least one beneficiary of
government income transfer programs, and the authors claim that there is a relevant contribution of income transfer programs to reduced inequality, poverty alleviation and improvement of social conditions of the population. However, according to Anschau et al.19, the high prevalence of food insecurity among beneficiaries of income transfer programs as compared to non-beneficiaries of the same social stratum indicates the need for better understanding the circumstances that characterize the lives of those families.
Regarding food consumption in Picos (PI), vegetables and meats were the most sensitive to food insecurity in urban or rural areas, although without statistical significance. Different result was observed by Yuyama et al.11 in the Amazon region, where rural riverside families consume more grains, fruits, vegetables, roots, oil and meat than families living in urban areas. According to Segall-Côrrea3 and Panigassi et al.20, as food insecurity conditions are more severe, the consumption of fruits, vegetables, meats, and dairy products is lower, and this behavior is uniform in all Brazilian regions, except for the Amazon region, where hunting, fishing and collection of regional fruits increase the food availability.
The study by Conceição et al.23 with children aged 9-16 years enrolled in private and public schools in the state of Maranhão also found high consumption of sugar and sweets (69.4%) and oils and fats (65.6%); however, the consumption of this food group by schoolchildren evaluated here was even higher, with more than 89.0% consuming oils and fats and 92.0% consuming sugars and sweets at least once a day.
Similar results were obtained by Antunes
et al.24, in which children under 3 years at food insecurity showed high consumption of coffee, being higher among children with the most severe forms of food insecurity. Antunes et al.24 also observed that the consumption of fruits, vegetables, and dairy products was below recommendations for children in situation of food security or insecurity.
It is noteworthy that some foods cannot be consumed due to various reasons such as unpleasant taste, difficulty of finding food; difficulty in eating; price; not having the habit or time to eat25, moreover, one should take into account the limitations of methodologies for measuring food consumption in line with food insecurity8.
The population of students living in rural or urban areas of Picos (PI) was fairly homogeneous regarding anthropometry, with similarities in the forms of malnutrition (deficits and excesses) for most students, despite the condition of food insecurity largely shown by the families of these children. Segall-Corrêa3 explained that the anthropometric measure is an important indicator of nutritional status; however, it assesses food insecurity indirectly, and eventually obtains normal values for weight, height and Body Mass Index (BMI) in families in situation of food insecurity. Accordingly, Oliveira et al.26 reported that in populations with high levels of poverty, low Human Development Index and high prevalence of food insecurity, the exclusive use of anthropometric indicators may reveal a situation apparently quite more favorable than reality.
Some studies suggest a relationship between obesity and food insecurity and claim that food insecurity does not increase the chances of being overweight in childhood; however, they may increase in adulthood27 and others that suggest an association between malnutrition and food insecurity7 discuss that these relationships are directly related to differences in dietary patterns that may exist among children in conditions of food insecurity, as many high-calorie foods cost less than healthier ones.
According to Oliveira & Lima Filho28 malnutrition and obesity often coincide in families with food and nutrition insecurity, causing the average amplitude of BMI of families increase according to food insecurity, considering that food security levels positively impact anthropometric indexes.
The study by Pellegrini et al.29 with schoolchildren aged 10-17 years enrolled in public schools in the states of Santa Catarina and Rio Grande do Sul showed higher percentage of normal weight children (82.3%) and lower percentage of overweight students (6.7%) in urban areas, with 11.0 - 11.7% of malnourished children living in rural and urban areas, with no statistical difference for this nutritional status among students of different places of residence. This result is quite similar to that found in the present study, in which schoolchildren living in rural areas showed nutritional status similar to those living in urban areas.
C O N C L U S I O N
The prevalence of food insecurity was similar between urban and rural areas in the city of Picos (PI). Among associated factors, low family income and consumption of untreated water contributed to the higher percentage of families in conditions of food insecurity.
Dietary intake and nutritional status of schoolchildren were not associated with the condition of food insecurity among students. Further studies should be carried out to better characterize the population at food insecurity, taking into account the constant changes in the socioeconomic and environmental conditions, food habit and lifestyle of the population, and the development and implementation of public policies in the field of food and nutrition.
A C K N O W L E D G M E N T S
To the Department of Education of the City of Picos (PI) and the Universidade Federal do Piauí for logistical support, and the children and parents who voluntarily participated in this study. To Conselho Nacional de Desenvolvimento Científico e Tecnológico for the productivity scholarship to Pedro Israel Cabral de Lira.
C O N T R I B U T O R S
JS AQUINO conducted the collection and interpretation of data, drafting of the manuscript. LAS SIQUEIRA-DE-ANDRADE conducted the statistical analysis and critical revision of the manuscript. PEB ALENCAR DA SILVA conducted the collection and tabulation of data. AP SILVA conducted the collection and tabulation of data. CRS VIEIRA conducted the collection and tabulation of data. drafting of the manuscript. PIC LIRA conducted the statistical analysis, drafting and critical revision of the manuscript.
R E F E R E N C E S
1. Conselho Nacional de Segurança Alimentar e Nutricional. Documento base: 3ª Conferência
Na-cional de Segurança Alimentar e NutriNa-cional. Brasí-lia: Consea; 2007.
2. Brasil. Ministério das Relações Exteriores. A segu-rança alimentar e nutricional e o direito humano à alimentação no Brasil. Brasília: Ipea; 2002. 3. Segall-Corrêa AM. Insegurança alimentar medida
a partir da percepção das pessoas. Estud Av. 2007; 21(60):143-54. doi: 10.1590/S0103-401420070 00200012
4. Kepple AW, Segall-Corrêa AM. Conceituando e medindo segurança alimentar e nutricional. Ciênc Saúde Colet. 2011; 16(1):187-99. doi: 10.1590/ S1413-81232011000100022
5. Kuku O, Gundersen C, Garasky S. Differences in food insecurity between adults and children in Zimbabwe. Food Policy. 2011; 36(2):311-7. doi: 10.1016/j.foodpol.2010.11.029
6. Cruz GF, Santos RS, Carvalho CMRG, Moita GC. Avaliação dietética em creches municipais de Teresina, Piauí, Brasil. Rev Nutr. 2001; 14(1):21-32. doi: 10.1590/S1415-52732001000100004 7. Gray VB, Cossman JS, Powers EL. Stunted growth
is associated with physical indicators of malnutrition but not food insecurity among rural school children in Honduras. Nutr Res. 2006; 26(11):549-55. doi: 10.1016/j.nutres.2006.09.009
8. Champagne CM, Casey PH, Connel CL, Stuff JE, Gosset JM, Harsha DW, et al. Poverty and food intake in rural America: Diet quality is lower in food insecure adults in the Mississippi delta. J Am Diet Assoc. 2007; 107(11):1886-94. doi: 10.1016/ j.jada.2007.08.003
9. Dean WR, Sharkey JR. Food insecurity, social capital and perceived personal disparity in a predominantly rural region of Texas: An individual-level analysis. Soc Sci Med. 2011; 72(9):1454-62. doi: 10.1016/ j.socscimed.2011.03.015
10. Jensen L, McLaughlin DK, Slack T. Rural poverty: The persisting challenge. Challenges for rural America in the twenty-first century. University Park (PA): Pennsylvania State University; 2003. 11. Yuyama LKO, Aguiar JPL, Pantoja L, Maeda RN,
Melo T, Alencar FH, et al. Segurança/insegurança alimentar em famílias urbanas e rurais no estado do Amazonas: I. Validação de metodologia e de instrumento de coleta de informação. Acta Amaz. 2007; 37(2):247-52. doi: 10.1590/S0044-59672 007000200011
14. Segall-Corrêa AM, Perez-Escamilla R, Marin-Leon L, Sampaio MFA, Panigassi G, Maranha LK. Acompanhamento e avaliação da Segurança Alimentar de famílias brasileiras: validação de metodologia e de instrumento de coleta de infor-mação (urbano/rural): relatório técnico. Campinas: Unicamp; 2004.
15. Cintra IP, Von Der Heyde MED, Schmitz BA, Franceschini SCC, Taddei JA, Sigulem DM. Métodos de inquéritos dietéticos. Cad Nutr. 1997; 13:11-23. 16. Lohman TG, Roche AF, Martorell R. Anthropometrics standardization reference manual. Champaign (IL): Human Kinetics Books; 1988.
17. World Health Organization. Anthro for personal computers. Version 2, 2007: Software for assessing growth and development of the world’s children. Geneva: WHO; 2007 [cited 2011 Feb 20]. Available from: <http://www.who.int/childgrowth/software/ en/>.
18. Salles-Costa R, Pereira RA, Vasconcellos MTL, Veiga GV, Marins VMR, Jardim BC, et al. Associação entre fatores socioeconômicos e insegurança alimentar: estudo de base populacional na região metro-politana do Rio de Janeiro, Brasil. Rev Nutr. 2008; 21(Suppl):99-109.
19. Anschau FR, Matsuo T, Segall-Côrrea AM. Insegu-rança alimentar entre beneficiários de programas de transferência de renda. Rev Nutr. 2012; 25(2):177-89. doi: 10.1590/S1415-52732012000200001 20. Panigassi G, Segall-Correa AM, Marin-Leòn L,
Pèrez--Escamilla R, Maranha LK, Sampaio MFA. Insegu-rança alimentar intrafamiliar e perfil de consumo de alimentos. Rev Nutr. 2008; 21(Suppl 1):S135-44. doi: 10.1590/S1415-52732008000700012 21. D’Innocenzo S, Marchioni DML, Prado MS, Matos
SMA, Pereira SRS, Barros AP, et al. Condições socioeconômicas e padrões alimentares de crianças de 4 a 11 anos: estudo SCAALA - Salvador/Bahia. Rev Bras Saúde Mater Infant. 2011; 11(1):41-9. doi: 10.1590/S1519-38292011000100005
22. Triches RM, Giugliane ERJ. Obesidade, práticas ali-mentares e conhecimentos de nutrição em esco-lares. Rev Saúde Pública. 2005; 39(4):541-7. 23. Conceição SIO, Santos CJN, Silva AAM, Silva JS,
Oliveira TC. Consumo alimentar de escolares das redes pública e privada de ensino em São Luís, Maranhão. Rev Nutr. 2010; 23(6):993-1004. doi: 10.1590/S1415-52732010000600006
24. Antunes MML, Schieri R, Salles-Costa R. Consumo alimentar de crianças menores de três anos resi-dentes em área de alta prevalência de insegurança alimentar domiciliar. Cad Saúde Pública. 2010; 26(8):1642-50. doi: 10.1590/S0102-311X2010 000800017
25. Salles-Costa R. Avaliação alimentar em Duque de Caxias (RJ). Estud Av. 2007; 21(60):135-42. 26. Oliveira JO, Lira PIC, Andrade SLLS, Sales AC, Maia
SR, Batista Filho M. Insegurança alimentar e estado nutricional de crianças de São João do Tigre, no Semi Árido do Nordeste. Rev Bras Epidemiol. 2009; 12(3):413-23. doi: 10.1590/S1415-790X2009000 300010
27. Mantin KS, Ferris AM. Food insecurity and gender are risk factors for obesity. J Nutr Educ Behav. 2007; 39:31-6. doi: 10.1016/j.jneb.2006.08.021
28. Oliveira LDS, Lima Filho DO. Modelo de segurança alimentar e nutricional e seus determinantes socioeconômicos e comportamentais. Cad Gestão Pública Cid. 2011; 16(59):1-20.
29. Pelegrini A, Silva DAS, Petroski EL, Glaner MF. Estado nutricional e fatores associados em escolares domiciliados na área rural e urbana. Rev Nutr. 2010; 23(5):839-46. doi: 10.1590/S1415-527320100 00500014