1
Universidade Federal de Pernambuco, Centro de Ciências da Saúde, Programa de Pós-Graduação em Saúde da Criança e do Adolescente. Av. Prof. Moraes Rego, 1235, Cidade Universitária, 50670-901, Recife, PE, Brasil. Correspondência para/
Correspondence to: BNS SILVA. E-mail: <[email protected]>. 2
Universidade Federal de Pernambuco, Centro de Ciências da Saúde, Programa de Pós-Graduação em Nutrição. Recife, PE, Brasil.
3
Associação de Assistência à Criança Deficiente, Setor de Fonoaudiologia. Recife, PE, Brasil. 4
Universidade Federal de Pernambuco, Centro de Ciências da Saúde, Curso de Medicina. Recife, PE, Brasil.
Article based on the master’s thesis of BNS SILVA, entitled: “Perfil antropométrico e consumo alimentar de crianças com para-lisia cerebral”. Universidade Federal de Pernambuco; 2015.
Malnutrition frequency among cerebral
palsy children: Differences in onset of
nutritional intervention before or
after the age of five years
Frequência de desnutrição em crianças com
paralisia cerebral
:
diferenças entre começar
a intervenção nutricional antes
ou após cinco anos de idade
Bruna Nolasco Siqueira SILVA1
Kátia Galeão BRANDT1
Poliana Coelho CABRAL2
Vanessa Van Der Linden MOTA3
Mateus Morais Aires CAMARA4
Margarida Maria de Castro ANTUNES1
A B S T R A C T
Objective
To evaluate the frequency of malnutrition and food consumption of children with cerebral palsy according to the age at the beginning of speech and hearing rehabilitation treatment.
Methods
measurement of the children were taken: weight, knee height, arm circumference and triceps skinfold. Weight, estimated height and body mass index were classified into Z-scores according to the World Health Organization curves. Brachial circumference, triceps skinfold and arm circumference were classified according to Frisancho. The 24-hour recall was used to calculate intake of calories, proteins, calcium, iron, vitamin A, and zinc using the NutriWin software.
Results
A total of 68 patients were evaluated. Children older than five had a higher frequency of malnutrition when weight (p=0.02) and arm circumference (p<0.001) were considered, although there was less triceps malnutrition (p=0.002). These also had lower calorie consumption per kg/day, protein/kg/day and calcium than the younger children.
Conclusion
The greatest nutritional impairment after the age of five suggests that nutritional and speech therapy interventions could have a greater effect if they were performed before that age.
Keywords: Cerebral palsy. Child. Eating behavior. Food consumption. Malnutrition.
R E S U M O
Objetivo
Avaliar frequência da desnutrição e consumo alimentar de crianças com paralisia cerebral de acordo com a idade do início do tratamento de reabilitação fonoaudiológica e nutricional.
Métodos
Foram incluídas crianças de 2 a 11 anos com diagnóstico de paralisia cerebral e que tinham até três meses de reabilitação fonoaudiológica e nutricional em dois centros de referência em Recife, Pernambuco. Submetidas a medidas de peso, altura do joelho, circunferência do braço e dobra cutânea tricipital. Peso, estatura estimada e índice de massa corporal foram classificados em escore-Z pelas curvas da Organização Mundial da Saúde. Circunferência braquial, dobra cutânea tricipital e circunferência muscular do braço foram classificados segundo Frisancho. Utilizou-se o recordatório das 24 horas para calcular consumo de calorias, proteínas, cálcio, ferro, vitamina A e zinco, pelo software NutriWin®.
Resultados
Foram avaliados 68 pacientes. Crianças maiores que cinco anos tiveram maior frequência de desnutrição quando se considerava peso (p=0,02) e ou circunferência muscular do braço (p<0,001) apesar de menor desnutrição pela dobra tricipital (p=0,002). Estas também tinham menor consumo de calorias/kg/dia, proteína/kg/dia e cálcio do que os menores.
Conclusão
O maior comprometimento nutricional a partir de cinco anos sugere que intervenções nutricionais e fonoaudioló-gicas poderiam ter maior efeito caso fossem realizadas antes dessa idade.
Palavras-chave: Paralisia cerebral. Criança. Comportamento alimentar. Consumo de alimentos. Desnutrição.
I N T R O D U C T I O N
Cerebral palsy, the most common cause of physical disability in children, is characterized by permanent disorders of posture and movement [1] and it affects between 2–2.5 per thousand live births worldwide [2]. Cerebral palsy is not progressive, however, due to its motor sequelae and eating difficulties, these children can develop nutritional impairments that prevent
early brain development and plasticity [3], leading to impaired health conditions, quality of life and cognitive performance [4].
the nutritional status of these individuals [5]. Nutritional factors due to insufficient intake of nutrients are mainly caused by dysphagia and eating difficulties, being more prominent in the severe forms of the disease [6]. Its treatment is accomplished with stimuli and motor rehabilitation, adequate food consumption (by nutritional support) [7], posture adaptation, consistency, and utensils use [8]. The absence or delay in treatment for eating difficulties potentially aggravate the malnutrition factor and may increase morbidity and mortality [9].
In 2011, Brooks et al. [9] published
the growth curves of the nutritional status of 102,163 measurements of weight from 25,500 children and adolescents with cerebral palsy, using anthropometric records from 1988 to 2002, which proved the evolutionary nature of nutritional deficit. They observed a decline in the growth curves of children with cerebral palsy in relation to the healthy children, which was more prominent over the course of years in the most severe cases [9]. It is difficult to determine how much of the nutritional damage is inherent to the disease and inevitable, and how much would be the result of inadequate nutrition, rehabilitation and caregiving.
In developing countries, children with cerebral palsy do not have adequate access to treatment due to high costs and complexity [8]. The magnitude of the negative impact of the absence of treatment on the nutritional status and health of children under unfavorable socioeconomic conditions is still unknown. This knowledge could portray the natural evolution of the disease, helping to better understand the critical moments of intervention and severity of nonintervention. In this context, this study was designed to evaluate the nutritional status through the anthropometric classification and food consumption of children with cerebral palsy in a low-income population according to when nutritional and rehabilitation treatment began.
M E T H O D S
A case series study was carried out at the Department of Pediatric Gastroenterology
of the Hospital das Clínicas of the Universidade
Federal de Pernambuco (HC–UFPE) and at the
Speech and Hearing Clinic of the Associação
de Assistência à Criança Deficiente (AACD, Association for the Assistance of Disabled
Children) in Recife (PE). Both services serve
economically disadvantaged children in the state of Pernambuco and neighboring states and are currently considered as reference centers for the rehabilitation and treatment of children with cerebral palsy in the region.
Patients included in the study had been attending both services for a maximum of three months. They had sought the AACD for physical and speech therapy. When they presented severe eating difficulties, they were referred to the Department of Pediatric Gastroenterology to discuss different tube feeding. The age of arrival of the child at the two services was determined by the age of referral, family initiative, and possibility of access.
Children between the ages of two and eleven were evaluated from August 2014 to March 2015; the exclusion criteria were those with genetic syndromes, chromosomal disorders, cardiac, metabolic, neurodegenerative diseases and other diseases that affect growth; in addition, those on corticosteroids or other medications that impair growth were also excluded.
The characterization of participants included the following variables: gender, age,
family income (last month’s income per person
Classifications of cerebral palsy type and degree of motor impairment were performed by a neuropediatrician or physiotherapist at AACD. The Cerebral palsy type was classified as spastic, dyskinetic, and patients with both types. They were reassessed and classified as spastic or dyskinetic for analysis purposes. There were no patients with ataxia or hypotonia in the study group. The Gross Motor Function Classification System [10] was used to assess the degree of motor impairment. It is divided into 5 levels according to the severity and location of impairment. The most severe is level 5 in which the patient presents no cervical control. Prolonged feeding time was considered when feeding was greater than or equal to 30 minutes per meal [8].
The variables weight, estimated height, Arm Circumference (AC), Arm Muscle Circumference (AMC) and Triceps Skinfold Thickness (TST) were used for the anthropometric assessment. The caregiver and patient were weighed on an
electronic scale (Filizola®, São Paulo, SP, Brazil)
and the child’s weight was found by subtracting
the weight of the caregiver. Stature was estimated by knee height measurement using
a child stadiometer (Cardiomed®, Biogênese
Comércio de Artigos Médicos Ltda, Curitiba, Paraná, Brazil) placed at heel base and at the head of the fibula. Later, the estimated height was calculated using the specific equation for 2-12-year old patients with motor disabilities, where: height (cm) = (2.69 x knee length) + 24.2 [8].
The circumference measurements were performed using an inelastic measuring tape (Cardiomed®) and TST with Cescorf® (Porto
Alegre, Rio Grande do Sul, Brazil) scientific adipometer [10], both classified according to Frisancho [11]. The AMC was calculated as AC (cm) - π X [TST (mm) ÷ 10] [10]. All the measurements were carried out by the researcher in charge, the measurement protocol of three measurements was followed, and the arithmetic mean of the two closest ones was performed.
The estimated Body Mass Index (BMI) was
calculated using the following formula: weight2/
height. The weight/age, estimated height/age, BMI/age indices were classified into Z-scores according to the World Health Organization curves [12].
To evaluate food consumption, a 24-hour recall method was used to assess the description of all foods and the amount of food consumed by each child 24 hours prior to the interview. The same was done by the researcher responsible and the amount of food consumed was
calculated by the Nutwin software, Universidade
Federal de São Paulo. The following items were analyzed: calorie, protein, carbohydrate, lipid, iron, calcium, zinc and vitamin A. Subsequently, calorie and protein intake per kg of body weight per day was calculated according to the weight measured on the day of the evaluation.
Data storage and analysis were performed using Epi Info (Centers of Disease Control and Prevention, Atlanta, Georgia, United States) version 6.04 and Statistical Package for the Social Sciences (SPSS Inc., Chicago, Illinois, United States) statistics software version 19.0. The frequencies were described as percentage and the difference between the Chi-square
test and the Fisher’s exact test were analyzed,
when necessary. The continuous variables were expressed as mean and Standard Deviation (SD) or by median ranges (25th and 75th percentiles). A Bartlet test was used to show the homogeneous distribution of the sample for age and inhomogeneity for consumption parameters, which were then compared using the nonparametric Mann-Whitney test. For the
analyses, p≤0.05 was considered significant.
began rehabilitation after the age of five and, therefore, a cut-off point at 5 years was adopted for the other analyses.
The study was approved by the Human Research Ethics Committee of the Health Sciences Center at UFPE under Protocol CAAE 26144414.8.0000.5208. The parents of the
participants signed the term of Free and Informed Consent.
R E S U L T S
The study included 68 children with a mean age of 5.16 years (SD=2.45), 33 (48.5%)
Table 1. Sociodemographic, clinical and nutritional characterization of 68 children with cerebral palsy from the Hospital das Clínicas/ Associação de Assistência à Criança Deficiente in the city of Recife (PE), Brazil, distributed according to age group, 2015.
Caracteristics <5 years (n=33) ≥5 years (n=35) Total p
n % n % n %
Gender
Males 25 75.8 22 62.9 47 69.1 0.250*
Females 8 24.2 13 37.1 21 30.9
Monthly family income (n=67)
≤0.5 26 78.8 19 55.9 45 67.2 0.046*
>0.5 7 21.2 15 44.1 22 32.8
Receives food formula from government
Yes 25 75.8 24 68.6 49 72.1 0.509*
No 8 24.2 11 31.4 19 27.9
Classification of cerebral palsy (n=56)
Spastic 12 44.4 14 48.3 26 46.4 0.774*
Dyskinetic 15 55.6 15 51.7 30 53.6
Gross motor function classification system (n=54)
Slight/Moderate (I-III) 5 20.8 8 26.7 13 24.1 0.618*
Severe (IV-V) 19 79.2 22 73.3 41 75.9
Presence of convultion
Yes 5 15.2 12 34.3 17 25.0 0.069*
No 28 84.8 23 65.7 51 75.0
Eating difficulties
Yes 25 75.8 23 65.7 48 70.6 0.364*
No 8 24.2 12 34.3 20 29.4
Tube-feeding route
Oral 28 84.8 29 82.9 57 83.8 0.824*
Probe or gastrostomy 5 15.2 6 17.1 11 16.2
Feeding time per meal (n=65)
<30 minutes 20 64.5 26 76.5 46 70.8 0.290*
≥30 minutes 11 35.5 8 23.5 19 29.2
Use of medication for gastroesophageal reflux (n=67)
Yes 10 30.3 7 20.6 17 25.4 0.743*
No 23 69.7 27 79.4 50 74.6
were younger than five years, with a prevalence of 46.0% for the spastic-type Cerebral palsy, 76.0% of the children had severe motor impairment (GMFCS IV and V) and 25.0% had seizures. As for the sociodemographic conditions, twenty-four (35.7%) were residents
of the Agreste and Sertão region in the state
of Pernambuco; 16.0% had no running water at home and 29.7% of the mothers were illiterate or presented reading difficulties. When comparing the clinical and sociodemographic characteristics among children who began treatment before the age of five, no differences were observed, except for family income, which was lower among those who were younger than five; and a trend for higher frequency of seizures
were found in children older than five (p=0.069)
(Table 1).
Table 2. Caloric and macronutrient intake of 68 children with cerebral palsy from the Hospital das Clínicas/Associação de Assistência à Criança Deficiente in the city of Recife (PE), Brazil, distributed according to age group, 2015.
Age group kcal/day (kcal) kcal/kg/day (kcal) Ptn/day (g) Ptn/kg/day (g) Carbohydrates (g) Lipids (g)
<5 years
Median 1497.19 121.72 55.49 4.26 238.10 39.64
P25:P75 1063.62–1752.14 91.77–159.25 39.00–68.24 3.21–6.65 134.25–264.68 29.67–56.43
≥5 years
Median 1486.50 83.85 58.50 3.29 227.62 40.19
P25:P75 1164.98–1823.41 56.05–119.59 43.28–85.06 2.16–4.14 178.69–271.26 24.66–57.75
p* 0.9462 0.0019 0.4505 0.0144 0.9755 0.6454
Note: *Mann-Whitney test.
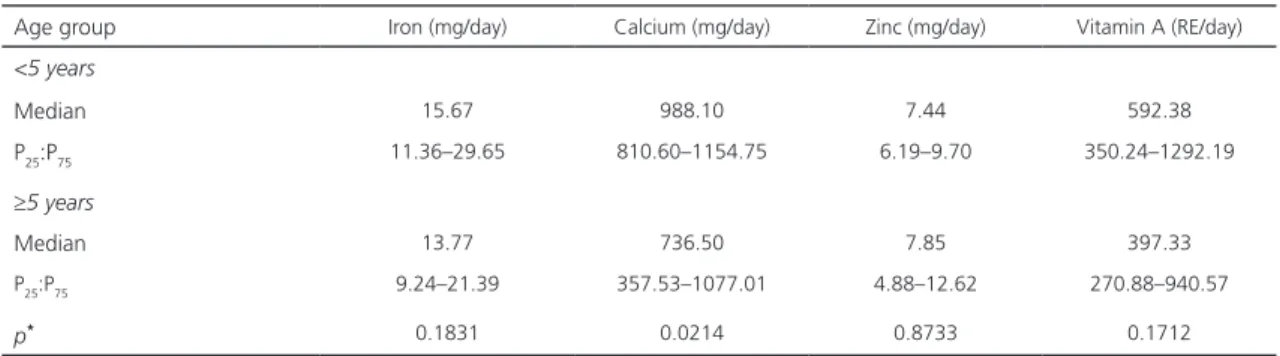
Table 3. Micronutrient intake of 68 children with cerebral palsy from the Hospital das Clínicas/Associação de Assistência à Criança Deficiente in the city of Recife (PE), Brazil, distributed according to age group, 2015.
Age group Iron (mg/day) Calcium (mg/day) Zinc (mg/day) Vitamin A (RE/day)
<5 years
Median 15.67 988.10 7.44 592.38
P25:P75 11.36–29.65 810.60–1154.75 6.19–9.70 350.24–1292.19
≥5 years
Median 13.77 736.50 7.85 397.33
P25:P75 9.24–21.39 357.53–1077.01 4.88–12.62 270.88–940.57
p* 0.1831 0.0214 0.8733 0.1712
Note: *Mann-Whitney test.
Regarding food consumption (Tables 2 and 3), the children older than five presented
lower intake of energy per kcal/kg (p=0.002)
and protein/kg/day (p=0.014). In addition, older
children had lower calcium intake (p=0.021) and
a trend for lower levels of iron (p=0.183) and
vitamin A (p=0.171).
Table 4 shows the anthropometric classifications according to the two age groups, showing that children older than five were more malnourished according to the
weight-for-age classification (p=0.026) and arm
muscle circumference (p=<0.001), although
Table 4. Anthropometric characteristics, by age group, of 68 children with cerebral palsy from the Hospital das Clínicas/Associação de Assistência à Criança Deficiente in the city of Recife (PE), Brazil, 2015.
Caracteristics <5 years ≥5 years Total p
n % n % n %
Weight-for-age Z-score
Low weight (<Z-score -2) 5 15.2 12 40.0 17 27.0 <0.026**
Adequate and high weight (≥Z-score -2) 28 84.8 18 60.0 46 73.0
Estimated height/age Z-score
Short stature (<Z-score -2) 9 27.3 17 48.6 26 38.2 <0.071**
Adequate stature (≥ Z-score -2) 24 72.7 18 51.4 42 61.8
Estimated BMI/age Z-score
Thinness (<Z-score -2) 14 42.4 15 42.9 29 42.6 <0.971**
Eutrophy and excess weight (≥Z-score -2) 19 57.6 20 57.1 39 57.4
Percentile for triceps skinfold
Malnutrition (<91% adequacy) 30 90.9 20 57.1 50 73.5 <0.002** Eutrophy and excess weight (≥91% adequacy) 3 9.1 15 42.9 18 26.5
Percentile for brachial circumference
Malnutrition (<91% adequacy) 18 54.5 18 51.4 36 52.9 <0.797**
Eutrophy and excess weight (≥91% adequacy) 15 45.5 17 48.6 32 47.1
Percentile for arm muscle circumference
Malnutrition (<91% adequacy) 5 15.2 20 57.1 25 36.8 <0.001**
Eutrophy and excess weight (≥91% adequacy) 28 84.8 15 42.9 43 63.2
Note: *Chi-square test; **Fisher
’s Exact test.
children (p=0.002). After the age of five, children
tended to present reduced stature according to
age group (p=0.071).
D I S C U S S I O N
In this study, greater impairment in weight, lean body mass, and height was found in children who started nutritional support and motor rehabilitation after the age of five, although they had more subcutaneous fat. In addition, older children also had lower dietary intake of protein, calories per kilo, calcium, vitamin A, and iron. The research was conducted with patients in unfavorable socioeconomic situations: approximately 70% of the patients had a family income lower than half a minimum wage per person, 30% of the caregivers were illiterate or presented reading difficulties, and
23% of the patients were from Agreste and
Sertão regions in the state of Pernambuco, which are areas with higher poverty rates. These two last aspects are not shown in the results.
The high incidence of eating difficulties among children (70.6%), low access to public health services for rehabilitation treatment and clinical-nutritional monitoring (due to the unfavorable socioeconomic context), and factors related to family caregivers could explain the low food consumption and the changes in the body composition of these children.
the weight-for-age percentiles of children with severe cerebral palsy are lower than the general population, thus, according to the authors, preschoolers are apparently less nutritionally compromised [9]. Although these growth curves were developed in an economically favored population, similar data have been described in Uganda [13] and Mexico [14].
As found in the present study, age-related reduction in lean mass had already been
described by other authors. Caram et al. [15],
in the city of São Paulo, found that there is a
negative correlation between the percentage of body protein and age and muscle mass reduction may be a result of malnutrition, through muscular atrophy, interfering with immunity, increasing diseases, and impairing the respiratory muscle function.
The decrease in lean mass reflects nutritional factors and primary cerebral palsy alterations, such as neuromotor dysfunction that induces sarcomere reduction, fiber size, lipid content, collagen and muscle capillary density, thus altering the final muscle composition [16]. Neuroendocrine changes and immobility also interfere in the stimulation of muscle trophism [17]. In our patients, we also observed that the older children had a lower caloric-protein intake than the younger ones, which possibly could have had an impact on muscle impairment.
Interestingly, despite the advancement of malnutrition with age, we found a lower impairment of subcutaneous fat in older children. This finding, as described by some authors, is variable among studies and it depends on the severity and degree of immobility to which the patient is exposed [18]. Other studies that evaluated Mexican children in 2017 corroborated our findings. They concluded that school children had higher values of subcutaneous fat when compared with preschool children [19]. The authors suggest that the increase in subcutaneous fat could be explained by the physiology of adiposity in childhood, since there could be an increase in adipose reserves as a
form of preparation for the pubertal growth in this age group [20].
Another finding was the significant trend for stature impairment in children older
than 5 years (p=0.07). Although linear growth
is explained by multiple factors, including neuroendocrine factors, it can negatively interfere in height, lower weight load on bones, and food intake deficit [2]. Our patients, who began treatmet later, probably receive less attention and care from the family, leading to less body movement stimuli and consequently greater bed immobilization. In addition, as previously mentioned, these children had lower intake of calories, proteins and calcium, which are nutritional factors imperative for bone growth.
Regarding calcium, the recommendation of daily intake for the age is practically double the median consumption observed in the study, showing that the intake of this micronutrient in this group of patients is possibly insufficient for bone mass formation and growth. In part, the changes in consumption could be explained by the eating difficulties of children with severe cerebral palsy. However, we did not observe a difference in the frequency of eating difficulties, use of alternative tube feeding, and feeding time in older and younger children. This may suggest that there could be other factors for the absence of higher calorie and protein intake, which is expected over time, such as the higher frequency of seizure episodes in children who began rehabilitation later.
In the context of a developing country, the late arrival of low-income children for rehabilitation and nutrition services may be caused by family neglect or access difficulties. The present study did not aim to access healthcare services, caregiving or neglect of children with cerebral palsy, factors that are complex per se.
However, it is known that children with eating difficulties require great effort from caregivers to ensure adequate nutrient intake who need to dedicate more time to their diet and specific dietary adjustments. It may be assumed that as the child ages, the family becomes depleted and if nutritional monitoring is not provided by a specialized health team, there will be inadequate food intake, and thus greater impairment of nutritional status. Finally, we suggest further studies be conducted to better evaluate the interference of family caregivers in food consumption and nutritional rehabilitation related to the changes in body composition of children with cerebral palsy during childhood.
A C K N O W L E D G M E N T S
We thank all the patients and their caregivers who made this dream a reality.
C O N T R I B U T O R S
KG BRANDT, PC CABRAL and MMC ANTUNES contributed to conception and design, analysis and interpretation of data, revision and approval of the final version of the article. VVDL MOTA contributed to conception and study design. MMA CAMARA contributed to data collection and analysis.
R E F E R E N C E S
1. Rosenbaum P, Paneth N, Leviton A, Goldstein M, Bax M, Damiano D, et al. A report: The definition and classification of cerebral palsy. Dev Med Child Neurol. 2007;109(Suppl.):8-14.
2. Bell KL, Boyd RN, Tweedy SM, Weir KA, Stevenson RD, Davies PSW. A prospective, longitudinal study of growth, nutrition and sedentary behaviour in
young children with cerebral palsy. BMC Public Health. 2010;10(179):2-12.
3. Rempel G. The importance of good nutrition in children with cerebral palsy. Phys Med Rehabil Clin N Am. 2015;26(1):39-56.
4. Araújo LA, Silva LR. Anthropometric assessment of patients with cerebral palsy: Which curves are more appropriate? J Pediatr. 2013;89(3):307-14.
5. Bell KL, Boyd RN, Tweedy SM, Weir KA, Stevenson RD, Davies PSW. A prospective, longitudinal study of growth, nutrition and sedentary behaviour in young children with cerebral palsy. BMC Public Health. 2010;10(179):1-12.
6. Rempel G. The Importance of good nutrition in children with cerebral palsy. Phys Med Rehabil Clin N Am. 2015;26(1):39-56.
7. Penagini F, Mameli C, Fabiano V, Brunetti D, Dilillo D, Zuccotti, G. Dietary intakes and nutritional issues in neurologically impaired children. Nutrients. 2015;7(11):9400-15.
8. Adams MS, Khan NZ, Begum SA, Wirz SL, Hesketh T, Pring TR. Feeding difficulties in children with cerebral palsy: Low-cost caregiver training in Dhaka, Bangladesh. Child Care Health Dev. 2012;38(6):878-88.
9. Brooks J, Day S, Shavelle R, Strauss D. Low weight, morbidity, and mortality in children with cerebral palsy: New clinical growth charts. Pediatrics. 2011;128(2):299-307.
10. Palisano R, Rosenbaum P, Walter S, Russell D, Wood E, Galuppi B. Development and reliability of a system to classify gross motor function in children with cerebral palsy. Dev Med Child Neurol. 1997;39(4):214-23.
11. Frisancho AR. New norms of upper limb fat and muscle areas for assessment of nutritional status. Am J Clin Nutr. 1981;34(11):2540-5.
12. World Health Organization. Child growth standards: The WHO Child Growth Standards. Geneva: WHO; 2007 [cited 2015 Jan 10]. Available from: www.who.int/childgrowth/en/
13. Wilmshurst JM, Badoe E, Wammanda R D, Mallewa M, Kakooza-Mwesige A, Venter A, et al.
Chilg neurology services in Africa. J Child Neurol. 2011;26(12):1555-63.
14. Veja-Sanchez R, Gomez-Aguilar ML, Haua K, Rozada G. Weight-based nutritional diagnosis of Mexican children and adolescents with neuromotor disabilities. BMC Research Notes. 2012;5:218.
16. Mathewson MA, Lieber RL. Pathophysiology of muscle contractures in cerebral palsy. Phys Med Rehabil Clin N Am. 2015;26(1):57-67.
17. Stevenson RD. Use of segmental measures to estimate stature in children with cerebral palsy. Arch Pediatr Adolesc Med. 1995;149(6):658-62.
18. Fisher-Pipher S, Kenyon LK, Westman M. Improving balance, mobility, and dual-task performance in an adolescent with cerebral palsy: A case report. Physiother Theory Pract. 2017;33(7):586-95.
19. Iñiguez JA, Vásquez-Garibay EM, García-Contreras A, Romero-Velarde E, Troyo-Sanroman
R. Assessment of anthropometric indicators in children with cerebral palsy according to the type of motor dysfunction and reference standard. Nutr Hosp. 2017;34(2):315-22
20. Koyama S, Ichikawa G, Kojima M, Shimura N, Sairenchi T, Arisaka O. Adiposity rebound and the development of metabolic syndrome. Pediatrics. 2014;133(1):114-9.