Anthropometric Measures as Predictors of Cardiovascular Disease
Risk Factors in the Urban Population of Iran
Reza Gharakhanlou
1, Babak Farzad
2, Hamid Agha-Alinejad
1, Lyn M. Steffen
3, Mahdi Bayati
1Department of Physical Education and Sports Sciences, Faculty of Humanities, Tarbiat Modares University1, Tehran, Iran; Exercise Physiology Division, Faculty of Physical Education & Sports Science, Tarbiat Moallem University2, Tehran, Iran; Division of Epidemiology & Community Health, School of Public Health, University of Minnesota3, Minneapolis, USA
Abstract
Background: Overweight and obesity are an important public health problem in society, due to their association with various chronic diseases.
Objective: The purpose of this study is to determine the prevalence and distribution of overweight and obesity, using different anthropometric measurements and to identify the best anthropometric indicator which is most closely related to cardiovascular disease (CVD) risk factors in an Iranian urban population.
Methods: This cross-sectional study was conducted with 991 men and 1188 women aged 15 to 74 years. Body mass index (BMI), waist circumference (WC), waist-to-hip ratio (WHR), waist-to-height ratio (WHtR) and percentage of body fat were measured. A fasting blood specimen was obtained. CVD risk factors, including fasting blood glucose, triglycerides, total cholesterol (Tchol), low-density (LDL-C) and high-density-lipoprotein cholesterol (HDL-C) were assessed.
Results: Based on BMI, more than 49% of men and 53% of women were either overweight or obese with 10.2% of men and 18.6% of women being obese. In both men and women, the prevalence of overweight was greater among 40-49 year olds and the prevalence of obesity was greater among those 50+ years. Using the multiple regression analysis, BMI, WHtR and WHR explained the highest percentage of variation of triglycerides, Tchol/HDL-C ratio and LDL-C in men, respectively, whereas WHR explained the highest percentage of variation of triglycerides and WC explained the highest percentage of variation of Tchol/HDL-C ratio and LDL-C in women.
Conclusion: Our data indicated that WHR and WHtR were the anthropometric indicators that best predicted CVD risk factors in men and WHR and WC in women. (Arq Bras Cardiol 2012;98(2):126-135)
Keywords: Body weights and measures; body weight; cardiovascular diseases; risk factors; urban population; Iran.
Mailing address: Reza Gharakhanlou •
Tarbiat Modares University, Jalal Al Ahmad St. Tehran, Iran E-mail: [email protected]
Manuscript received June 20, 2011; revised manuscript received on August 11, 2011; accepted on August 24, 2011.
Iran is an urbanized city-state country in the Middle East Region and is considered to be a country in nutrition transition. Like most countries that have undergone rapid economic and demographical transition, non-communicable diseases, especially cardiovascular disease, are the major cause of mortality and morbidity in Iran with a high prevalence reported5. On the other
hand, although abdominal visceral adipose tissue measured by computed tomography (CT) or magnetic resonance imaging may more accurately reflect body fat distribution to predict metabolic risks6,7, the inherent high cost and radiation hazard prevent their
use in large-scale epidemiological studies or self-assessments. Various indicators for obesity have been described over the last 25 years or so8. Body mass index (BMI) is often used to reflect total
body fat while the waist circumference (WC), waist to hip ratio (WHR), and waist to height ratio (WHtR) are used as surrogates for central body fat9,10. Recent studies have shown that WC is the best
simple anthropometric measure of abdominal visceral adipose tissue, and may be the best indicator for predicting cardiovascular risks11-13. Since there are marked gender differences in regional
body fat distribution, the anthropometric indicators may also vary in applicability by sex.
Introduction
The prevalence of overweight and obesity is rapidly increasing in developing as well as in industrialized countries1,2. Unhealthy diets and physical inactivity are the
main contributors to overweight and obesity, which are among the leading risk factors for major non-communicable diseases. Previous research has consistently shown that both absolute total body fat and central distribution of body fat are closely associated with the risks of diabetes, hypertension, hyperlipidemia and cardiovascular disease (CVD)3. Cardiovascular disease mortality is about 3-fold
Whereas the prevalence of obesity has been increasingly reported in all regions of the world, the status of the prevalence of obesity as a better predictor of cardiovascular risk factors in an urban population of Iran is unknown. Therefore, this study was designed to: (1) provide baseline data on the prevalence and distribution of overweight and obesity, using anthropometric measurements in the population from urban cities in Iran; and (2) determine the relationships between selected cardiovascular risk factors and anthropometric indicators and to identify the anthropometric indicator most closely related to CVD risk factors and whether the magnitude of association varies with gender in the study population.
Methods
Study Population
The study individuals were recruited through a random telephone survey14 from 7 big cities of Iran based on their
populations and invited to one of the appointed health screen centers to undergo anthropometric examination and laboratory tests. In this cross-sectional study, 2179 healthy individuals aged 15 to 74 years (991 men and 1188 women) without any previous systemic diseases or medications related to body weight change or affecting glucose and lipid levels, were included in our study and completed blood tests and anthropometric measurements. The individuals were divided by gender and age (into five age groups: 15–19, 20–29, 30–39, 40–49 and 50+ years old). All the individuals were volunteers and gave their consent for participation into the study, whose protocol was approved by the Ethics Committee of the School of Medical Sciences of Tarbiat Modares University and was in accordance with the Declaration of Helsinki.
Anthropometric measures
The following anthropometric variables were evaluated in all individuals: weight, height, BMI, WC, WHR, WHtR, sum of three-point skinfolds and percentage of body fat. For height, the individuals were instructed to stand as straight as possible with their back against a wall-mounted vertical ruler. Feet were flat on the floor with shoes removed. Weight was measured to the nearest 100 g using a calibrated balance beam scale and with the individual standing and wearing underwear only. BMI was calculated as weight/height squared (kg/m2)12 and
was classified into five categories: underweight (BMI < 18.5 kg/m2), normal weight (BMI 18.5–24.9 kg/m2), overweight
(BMI 25.0–29.9 kg/ m2) and obese (BMI ≥ 30.0 kg/m2)15.
Circumferences were measured to the nearest millimeter using a flexible tape. WC was taken at the end of normal expiration, with the measuring tape positioned at the midway between the lower rib and the iliac crest. Men with waist circumference of < 94, 94–101.9 and ≥ 102 cm were classified as normal weight, overweight and obese, respectively, while women were classified in the same obesity categories based on WC < 80, 80–87.9 and ≥ 88 cm. Hip circumference was measured at the level of maximal protrusion of the gluteal muscles. WHR was calculated as WC (cm) divided by hip circumference (cm) and WHtR was calculated as WC (cm) divided by height (cm). Men with WHR < 0.90, 0.90–0.99 and ≥ 1.0 were classified
as normal weight, overweight or obese, respectively, while women were classified in the same categories based on WHR of < 0.80, 0.80–0.84 and ≥ 0.851. Skinfold thickness (Chest,
abdominal, midthigh for men and triceps, suprailium, midthigh for women) was measured in triplicate to the nearest mm, on the right side of the body by Holtain Skinfold Caliper (Holtain Ltd, Crymmych, Dyfed, UK). The mean of three measurements represented the value for each site. Percentage of body fat (PBF) was calculated using the three-site equation16,17.
Blood sampling and analysis
Blood samples were collected between 7:00 am and 9:00 am after a 12-hour overnight fast. Serum total cholesterol (Tchol) and triglycerides (TGs) were measured using enzymatic colorimetric tests with cholesterol esterase and cholesterol oxidase and glycerol phosphate oxidase, respectively. High-density lipoprotein cholesterol (HDL-C) was measured using the same method after precipitating apolipoprotein B containing lipoproteins with phosphotungstic acid. Serum glucose concentration was assayed using the enzymatic colorimetric method with the glucose oxidase technique (Chemistry analyzer, Roche/Hitachi 904, with Pars Azmoun kits, Tehran, Iran). Inter- and intra-assay coefficients of variations were 2 and 0.5% for Tchol and 1.6 and 0.6% for TGs and both 2.2% for serum glucose, respectively. Low-density lipoprotein cholesterol (LDL-C) was calculated from the serum Tchol, TGs, and HDL-C concentrations expressed in mg/dl using the Friedwald formula18 if TGs concentration
is lower than 400 mg/dl.
Statistical analysis
All variables are presented as mean and standard deviation or percentage. Independent t-test and repeated-measures analysis of variance (ANOVA) were used to compare quantitative variables between the two groups (men and women) and more than two groups, respectively. Age-adjusted partial correlation coefficients were calculated to investigate the association between anthropometric variables and cardiovascular risk factors. Multiple regression analysis (stepwise method) of the data was carried out. All tests for statistical significance were two-tailed and performed assuming a type I error probability of ≤ 0.05. All data were analyzed by the SPSS software package (SPSS for Windows; SPSS Inc., Chicago, IL, USA; Version 16.00).
Results
Anthropometric measurements
Prevalence of overweight and obesity
Irrespective of age or measures used, women had a higher prevalence of obesity than men (Table 2). Based on BMI, almost half of men and over 50% of women were either overweight or obese with 10.2% of men and
18.6% of women in the obese category. The prevalence of BMI obesity increased with age until 50+ yrs. This trend was more pronounced among women (main effect for age-gender interaction p = 0.001). The difference in the prevalence of obesity between men and women was particularly large in the older age group (50+ years). Table 1 - Anthropometric variables by gender and age groups in the urban population of Iran
n Height Weight WC BMI WHR WHtR PBF
Men
15-19 139 170.2±7.9* 62.2±12.0* 74.5±8.9 21.4±3.1 0.82±0.05* 0.43±0.06 11.2±5.7*
20-29 204 174.9±5.8* 72.8±10.9* 82.2±8.8* 23.7±3.2 0.85±0.05* 0.48±0.09 15.0±6.6*
30-39 327 170.8±6.8* 76.6±12.8* 91.1±10.9* 26.0±3.8 0.92±0.06* 0.51±0.06 25.3±7.2*
40-49 200 170.3±6.9* 79.1±13.5* 96.3±8.9* 26.8±3.0* 0.96±0.05* 0.54±0.06 29.9±6.5*
50+ 121 169.6±7.4* 74.9±12.6* 95.5±10.9 25.9±3.9* 0.97±0.07* 0.56±0.06* 30.2±6.9*
Total 991 171.7±7.2* 72.0±13.3* 88.5±12.4* 25.0±3.9* 0.91±0.07* 0.49±0.08* 22.7±9.7*
Women
15-19 145 160.4±5.1 57.3±9.8 72.7±9.0 21.9±3.8 0.78±0.06 0.45±0.07 26.9±9.9
20-29 193 161.5±5.3 60.8±11.5 77.9±11.6 23.4±4.3 0.79±0.08 0.48±0.07 27.1±9.6
30-39 427 159.2±5.9 66.6±11.7 84.2±11.4 26.1±4.7 0.81±0.08 0.52±0.07 31.5±6.9
40-49 283 159.5±6.1 71.2±10.8 89.2±11.0 27.7±4.3 0.83±0.08 0.54±0.07 35.1±5.9
50+ 140 156.5±6.0 69.9±11.1 96.0±12.6 28.4±4.8 0.91±0.10 0.60±0.09 36.1±6.1
Total 1188 159.5±5.9 65.9±12.1 84.3±13.1 25.8±4.9 0.82±0.09 0.52±0.08 31.5±8.2
WC - Waist Circumference in cm; BMI - Body Mass Index in kg/m2; WHR - Waist-to-Hip Ratio; WHtR - Waist-to-Height Ratio; PBF - Percentage of Body Fat.
*Signiicantly different from women values (p < 0.01). All values are expressed as mean±SD.
Table 2 - Prevalence (%) of obesity by body mass index, waist circumference and waist-to-hip ratio in men and women aged 15 and above
Age groups n BMI
Overweight Obese
WC Overweight Obese
WHR Overweight Obese
Men
15-19 139 9.3 2.8 3.6 1.4 10.7 2.1
20-29 204 23.5 4.4 9.3 3.9 22.0 1.0
30-39 327 45.8 13.7 23.2 16.8 59.3 11.6
40-49 200 63.0 12.5 36.5 26.5 56.5 35.0
50+ 121 44.6 14.8 28.9 24.7 56.1 32.2
Total 991 39.4 10.2 21.0 14.9 43.8 15.3
Women
15-19 145 12.4 2.7 14.4 5.5 18.6 15.8
20-29 193 21.7 6.7 22.8 15.5 24.8 23.3
30-39 427 40.9 17.3 30.6 32.3 21.3 32.5
40-49 283 42.7 28.6 28.2 54.7 21.5 45.2
50+ 140 37.8 35.7 26.4 66.4 17.1 71.4
Total 1188 34.4 18.6 26.3 35.7 21.0 36.7
BMI - Overweight was deined as BMI between 25–29.9 and obesity as BMI ≥ 30 kg/m2 in men and women. WC - Overweight was deined based on WC 94–101.9 cm and 80–87.9 in men and women respectively and obesity based on WC ≥ 102 cm in men and ≥ 88 cm in women. WHR - Overweight was deined based on WHR 0.90–0.99 and WHR 0.80–0.84 in men and women respectively and obesity based on WHR ≥ 1 in men and ≥ 0.85 in women. BMI - Body Mass Index ; WC - Waist
Cardiovascular risk factors
Glucose, TGs and Tchol/HDL-C ratio were significantly higher in men, while LDL-C and HDL-C were significantly higher in women (p < 0.05; Table 3). The mean values of glucose, Tchol and TGs increased significantly in ascending age groups in men, while values of Tchol, TGs, LDL-C and Tchol/HDL-C ratio increased significantly in ascending age groups in women (p < 0.05).
Anthropometric indicators and cardiovascular risk factors based on BMI groups
The mean values of weight, WC, WHR, WHtR and PBF increased significantly in ascending BMI categories in both genders (p < 0.001; Table 4). In addition, significant differences were observed in cardiovascular risk factors according to different BMI groups in men (p < 0.05), while it was just significant in Tchol/HDL-C ratio for women.
Correlation between anthropometric measurements WC, BMI, WHR and WHtR were strongly correlated in both sexes (p ≤ 0.001; Table 5), suggesting that measures of obesity based on these parameters will provide comparable information. However, PBF showed a weaker correlation with the other anthropometric measurements in women.
Correlation between anthropometric measurements and cardiovascular risk factors
In men, a highly significant correlation was found between WC, BMI, WHR and WHtR on the one hand and serum lipid values on the other hand (p < 0.05; Table 6). When adjustments were made for both age and BMI, there were just
significant correlations between WC, WHR, WHtR and HDL-C and between WC and Tchol/HDL-C ratio (p < 0.05). When adjustments were made for both age and WC, there were just significant correlations between BMI, WHR, WHtR and triglycerides (data not shown in table; p < 0.05). There were weaker correlations between anthropometric measurements and serum lipid values in women. WC, WHR and WHtR had significant correlations with most of the serum lipid values (p < 0.05). When adjustments were made for both age and BMI, there were just significant correlations between WC, WHtR and Tchol/HDL-C ratio and between WHR and triglycerides (p < 0.05). When adjustments were made for both age and WC, there were just significant correlations between WHR and triglycerides (data not shown in table; p < 0.05).
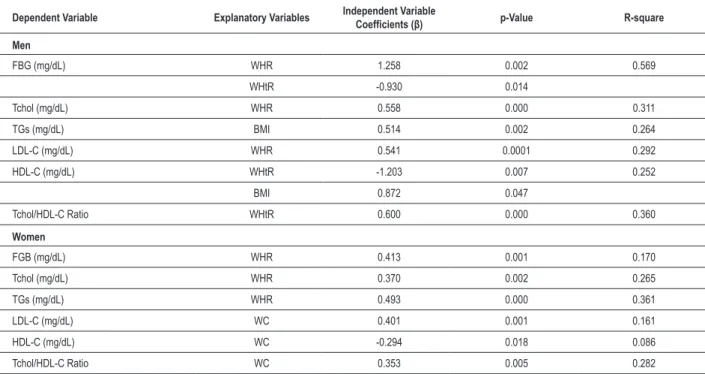
Independent determinants of cardiovascular risk factors In men, WHR was a significant predictor for glucose, Tchol and LDL-C, whereas WHtR was a significant predictor for glucose, HDL-C and Tchol/HDL-C ratio (Table 7). On the other hand, BMI was a significant predictor for triglycerides and HDL-C. The percentage of variation of glucose and lipid levels explained by these parameters, however, was modest. WHR explained 7.4% of glucose variation, 31.1% of Tchol variation and 29.2% of LDL-C variation. WHtR explained 9.3% of glucose, 15.2% of HDL-C and 36% of Tchol/HDL-C ratio variation. BMI explained 26.4% of triglyceride and 10% of HDL-C variation. In women, WHR was a significant predictor for glucose, Tchol and triglycerides, whereas WC was a significant predictor for LDL-C, HDL-C and Tchol/HDL-C ratio. WHR explained 17% of glucose, 20.4% of Tchol and 31.7% of triglyceride variation. WC explained 16.1% of LDL-C, 8.6% of HDL-C and 22.7% of Tchol/HDL-C ratio variation.
Table 3 - Cardiovascular risk factors by gender and age groups in urban population of Iran
FBG Tchol TGs LDL-C HDL-C Tchol/HDL-C Ratio
Men
15-19 84.2±8.7 154.7±35.1 140.4±99.2 80.5±26.8 45.5±12.3* 3.72±1.7
20-29 81.5±6.1 181.4±45.6 119.0±61.7 110.6±42.2 44.0±11.5* 4.32±1.4*
30-39 90.5±11.3 189.4±41.9 167.0±56.6* 101.6±30.7 45.9±17.1 4.43±1.3
40-49 95.3±14.0* 193.1±33.5 182.7±66.0* 105.9±29.6 39.7±11.1* 5.70±3.5*
50+ 108.0±18.4 211.6±32.9 202.2±77.6 102.9±25.3 40.3±10.5 5.75±2.6
Total 91.2±14.1* 186.1±40.9 163.0±73.3* 101.1±32.2* 43.3±13.4* 4.78±2.3*
Women
15-19 81.9±12.4 154.0±31.3 90.4±48.3 88.9±25.0 56.7±10.5 2.78±0.6
20-29 80.4±6.1 173.1±44.7 100.2±32.5 107.3±35.0 53.0±11.9 3.34±0.7
30-39 86.4±15.6 187.0±42.2 130.5±56.3 118.1±33.5 47.5±12.5 4.09±1.0
40-49 86.7±10.9 186.1±41.4 128.1±58.2 119.2±31.6 48.4±10.2 3.97±1.1
50+ 91.1±23.5 201.0±59.8 178.2±82.4 121.9±46.4 50.1±19.9 4.77±2.5
Total 85.2±14.0 180.4±44.6 123.5±60.5 112.0±34.9 50.5±12.8 3.79±1.3
Table 4 - Comparison of anthropometric measurements and cardiovascular risk factors according to BMI groups in both men and women
Underweight Normal Weight Overweight Obese
n 29 470 391 101
Men
Weight 49.3±5.1* 65.2±7.7* 80.9±7.7* 94.6±11.4*
Height 167.9±6.8* 171.9±7.2* 172.2±6.8* 171.0±8.5*
WC 67.4±5.0* 80.3±8.0* 95.3±6.4* 106.8±9.4*
WHR 0.80±0.04* 0.86±0.06* 0.95±0.05* 0.98±0.06*
WHtR 0.40±0.02* 0.46±0.07 0.54±0.06 0.60±0.06
PBF 8.7±3.5* 16.8±7.9* 28.2±6.8* 31.8±5.7*
FBG 85.4±12.2 88.2±15.3 92.1±11.7 103.1±14.4*
Tchol 154.4±31.5 170.5±38.0 199.1±37.7 210.7±39.7
TGs 75.2±16.3 140.0±67.1 176.1±64.6* 248.1±58.1*
LDL-C 88.6±27.4 90.5±31.5* 113.3±31.7 97.0±23.6
HDL-C 50.6±4.7 45.9±16.4 42.4±9.3* 32.3±13.6*
Tchol/HDL-C Ratio 3.03±0.39 4.04±1.47 4.88±1.34* 8.37±5.15*
n 46 508 410 224
Women
Weight 46.3±3.8 57.3±6.2 69.2±5.9 81.9±9.8
Height 162.6±5.0 160.8±5.4 159.1±5.6 156.7±6.5
WC 64.3±4.3 76.3±8.3 87.9±8.4 100.2±10.7
WHR 0.73±0.04 0.79±0.07 0.83±0.08 0.88±0.09
WHtR 0.39±0.02 0.47±0.06 0.54±0.05 0.62±0.07
PBF 17.7±6.9 28.2±7.9 34.4±5.8 37.8±5.1
FBG 78.8±5.2 82.9±10.4 88.6±18.3 85.8±13.1
Tchol 141.8±18.4 175.7±41.2 187.5±47.4 186.8±46.6
TGs 76.2±33.9 114.0±54.3 127.2±56.0 144.4±73.5
LDL-C 85.4±21.4 105.9±32.7 118.2±33.8 119.5±39.4
HDL-C 57.2±9.5 52.7±13.9 48.4±12.1 48.5±12.1
Tchol/HDL-C Ratio 2.54±0.60 3.53±1.12 4.16±1.70 3.97±1.04
BMI groups were deined by: Underweight, < 18.5; Normal weight, 18.5 – 24.9; Overweight, 25 – 29.9; Obese, ≥ 30 kg/m2. *Signiicantly different from women values (p < 0.05). All values are expressed as mean±SD. WC - Waist Circumference; WHR - Waist-to-Hip Ratio; WHtR: waist-to-height ratio; PBF - Percentage of body fat; FBG - fasting blood glucose; Tchol - total cholesterol; TGs - triglycerides; LDL-C - Low-density lipoprotein-cholesterol; HDL-C - High-density lipoprotein-cholesterol.
Table 5 - Age-adjusted partial correlation coeficient among anthropometric measures in urban population of Iran
Men Women
WC BMI WHR WHtR PBF
Waist Circumference – 0.769 0.716 0.871 0.459
Body Mass Index 0.859 – 0.335 0.723 0.529
Waist/Hip Ratio 0.769 0.581 – 0.666 0.282
Waist/Height Ratio 0.712 0.625 0.568 – 0.499
Percentage of Body Fat 0.740 0.622 0.583 0.479 –
All coeficients signiicantly different (p < 0.001). WC - Waist Circumference; BMI - Body Mass Index; WHR - Waist/Hip Ratio; WHtR - Waist/Height Ratio; PBF - Percentage
Table 6- Age-adjusted partial correlation coefficient among anthropometric measures and cardiovascular risk factors in men and women
Men WC BMI WHR WHtR PBF
FBG 0.083 0.072 0.052 0.125 0.002
Tchol 0.389*** 0.364*** 0.374*** 0.363* 0.210*
TGs 0.440*** 0.515*** 0.473*** 0.582*** 0.305**
LDL-C 0.271** 0.251* 0.297** 0.277 0.039
HDL-C -0.415*** -0.318** -0.374*** -0.430** -0.238*
Tchol/HDL-C 0.499*** 0.470*** 0.444*** 0.537*** 0.219*
Women
FBG 0.118 0.111 0.154 0.138 0.051
Tchol 0.224* 0.130 0.226* 0.271* 0.028
TGs 0.270** 0.205* 0.368*** 0.272* 0.029
LDL-C 0.251* 0.185 0.176 0.288* 0.010
HDL-C -0.232* -0.182 -0.119 -0.204 -0.126
Tchol/HDL-C 0.276** 0.159 0.230* 0.282* 0.047
*p < 0.05, ** p < 0.01, *** p < 0.001. WC - Waist Circumference; BMI – Body Mass Index; WHR - Waist-to-Hip Ratio; WHtR: waist-to-height ratio; PBF - Percentage of body fat; FBG - fasting blood glucose; Tchol - total cholesterol; TGs - triglycerides; LDL-C - Low-density cholesterol; HDL-C - High-density lipoprotein-cholesterol.
Table 7 - Multiple regression analysis of relationship between anthropometric variables and cardiovascular risk factors in men and women
Dependent Variable Explanatory Variables Independent Variable Coeficients (β) p-Value R-square
Men
FBG (mg/dL) WHR 1.258 0.002 0.569
WHtR -0.930 0.014
Tchol (mg/dL) WHR 0.558 0.000 0.311
TGs (mg/dL) BMI 0.514 0.002 0.264
LDL-C (mg/dL) WHR 0.541 0.0001 0.292
HDL-C (mg/dL) WHtR -1.203 0.007 0.252
BMI 0.872 0.047
Tchol/HDL-C Ratio WHtR 0.600 0.000 0.360
Women
FGB (mg/dL) WHR 0.413 0.001 0.170
Tchol (mg/dL) WHR 0.370 0.002 0.265
TGs (mg/dL) WHR 0.493 0.000 0.361
LDL-C (mg/dL) WC 0.401 0.001 0.161
HDL-C (mg/dL) WC -0.294 0.018 0.086
Tchol/HDL-C Ratio WC 0.353 0.005 0.282
Discussion
The International Obesity Task Force reported that the Middle East is one of the regions with the highest prevalence rates of obesity worldwide19. In our study, prevalence of
overweight as defined by BMI increased to a peak of 63.0% and 42.7% in the 40–49 y age group in men and women, respectively. Prevalence of obesity as calculated by BMI continued to increase to a maximum of 14.8 and 35.7% in the 50+ y age group in men and women, respectively. In addition, central obesity is a recognized predictor of coronary artery disease, and men usually have a higher WC and WHR than women3; however, we found that central obesity was more
frequent in the women of any age groups. The prevalence of general overweight and obesity in this population (BMI ≥ 25 kg/m2, males 49.6% and females 53%) is higher than that
among the urban population of Cameroon (males 28.1% and females 48.1%)2. Based on these findings, overweight
and obesity were of high prevalence in the adult urban population of Iran and the prevalence of obesity in women of any age groups was higher than that of men. Ideal BMI for the prevention of cardiovascular disease is considered to be 22.6 and 21.1 for men and women, respectively20. In this study,
the mean BMI of each sex-age group was above these cutoff points. The results of few studies conducted in some cities of Iran showed large differences.
A study in Tehran, the capital of Iran, showed much higher prevalence rates of general and abdominal obesity; 67% of women and 29% of men were obese and abdominal obesity was detected in 93% of women and 74.1% of men21.
Hosseinpanah et al22 studied the prevalence of obesity in a
follow-up study in district 13 of Tehran. The prevalence of general obesity was 15.8, 18.6 and 21% in men and 31.5, 37.7 and 38.6% in women in phases I, II and III, respectively, while the prevalence of abdominal obesity in men was 36.5, 57.2 and 63.3% and in women was 76.7, 83.8 and 83.6% in the three periods mentioned. These results showed an increasing trend of obesity in the adult Tehranian population over 6.6 years of follow-up. Prevalence rates in various studies from the Middle East show considerable variation.
In a study conducted in Egypt, the prevalence of obesity was 40.6% among women living in urban areas23. The prevalence
of obesity among Turkish women and men was 32.4% and 14.1%24, whereas the prevalence of abdominal obesity was
29.4% (38.9% among women and 18.1% among men)25.
A recent national study in Lebanon demonstrated that the prevalence of overweight was higher in men than in women, i.e. 57.7% vs. 49.4%, respectively, but obesity was more prevalent in women (18.8%) than in men (14.3%)26. Similarly,
the prevalence of overweight was higher in men than women, i.e. 39.4% vs. 34.4%, respectively, but obesity was more prevalent in women (18.6%) than in men (10.2%) in our study. Results from CT indicate that central obesity, especially intra-abdominal fat accumulation, is a critical variable in the study of the ratio of body fat distribution to metabolic complications3. Despite the close association between
central adiposity and cardiovascular risks, there is still some controversy regarding the best anthropometric measure for central adiposity. Since there are marked gender differences in regional body fat distribution, the anthropometric indicators
may also vary in applicability by sex. In this study, we compared the correlations between five obesity parameters (BMI, WC, WHR, WHtR and PBF) and selected cardiovascular risk factors. The anthropometric measurements, except PBF, were strongly correlated with each other in this study. The correlations of indices of overall and central obesity are highly suggestive of an association between increased overall obesity (as measured by BMI) with increased abdominal obesity.
Després et al have reported that the regional distribution of body fat, especially an excessive deposition of abdominal fat, was associated with low concentrations of HDL-C.3 In
the Canadian Heart Health Survey, Ledoux et al27 found
that anthropometric measures were moderately associated with the presence of high blood pressure, dyslipidemia and diabetes mellitus in adults and that BMI as well as waist circumference and WHR played a roughly equal role. Of all risk factors measured for CVD in this study, increased TGs and Tcho/HDL-C ratio were significantly associated with most of the anthropometric indices in both men and women; however, the correlations were more pronounced in men. Using computed tomographic scanning to measure adipose tissue, WC is found to be a better estimate of abdominal visceral adipose accumulation than WHtR and may be a better predictor of multiple cardiovascular risk factors than WHR10.
Based on the results of multiple regression analysis in our study, BMI, WHtR and WHR explained the highest percentage of variation of TGs, Tcho/HDL-C ratio and LDL-C in men, respectively, whereas WHR explained the highest percentage of variation of TGs and WC explained the highest percentage of variation of Tcho/HDL-C ratio and LDL-C in women. Ho et al14 found that BMI in men and WHR in women were
the important anthropometric indices to predict metabolic syndrome (hypertension or diabetes or dislipidemia). Furthermore, the relationship between anthropometric indices and cardiovascular risk factors may be age-specific. Rimm et al28, for instance, found in a large prospective study of US
men, that before the age of 65 y, BMI was the best predictor of coronary heart disease, whereas in men aged ≥ 65 y the WHR was a better predictor of risk. Goodman-Gruen and Barret-Connor29 found that after the age of 80 y, WHR is a
poor method of assessing central or visceral adiposity and waist circumference is a better measure of fat distribution. The Iowa Women’s Health Study cohort30 examined the relation
of both self-reported WHR and BMI with 5-year mortality in a cohort of older women. They showed that WHR is strongly and positively associated with risk of death in a monotonic dose-response fashion. Onat and coworkers31 reported that only
WHR was independently associated with coronary morbidity in women. In another study, Ward et al32 reported that WHR
involved and a high ratio that may be obtained in an individual with a small hip circumference or a low ratio in an individual with a large hip circumference for the same abdominal girth3.
On the other hand, the lack of a standard body location for measuring WC makes comparison with other studies difficult. Standard methodology is necessary to obtain reliable measures of abdominal circumference. It has also been reported that the association between WC and risk factors for cardiovascular disease may be population-dependent8. Furthermore, in
the elderly, waist circumference measurements may be overestimated and be inaccurate, since the laxity of abdominal muscles, which is typical in the elderly, is likely to undermine the predictive value of abdominal circumferences33. Therefore,
no single cut-off point of WC is optimal for all ages and for different cardiovascular risk factors.
Conclusions
The study provided insights into the relationship between age, sex, overweight and obesity using a variety of anthropometric measures. Our results highlighted the high prevalence of general and abdominal overweight and obesity in both sexes of urban populations of Iran as defined by the WHO criteria and provided evidence to support the establishment of intervention programs to manage and prevent obesity-related disorders such as diabetes and hypercholesterolemia. There currently is an increasing rate of urbanization in developing countries, which may have an
impact on obesity and its associated CVD risk factors in the future. In addition, the association of anthropometric indices and cardiovascular risk factors varied with gender. Our data indicated that WHR and WHtR were the anthropometric indicators that best predicted CVD risk factors in men and WHR and WC in women living in Iran.
Acknowledgements
This study was funded by the Sport Sciences Research Center (SSRC-850607). We would like to acknowledge the study participants and field workers for their participation in the hard work of this study.
Potential Conflict of Interest
No potential conflict of interest relevant to this article was reported.
Sources of Funding
There were no external funding sources for this study.
Study Association
This study is not associated with any post-graduation program.
References
1. WHO Investigators. Obesity: preventing and managing the global epidemic. Report of a WHO consultation. World Health Organ Tech Rep Ser 2000; 894:i-xii, 1-253.
2. Kamadjeu RM, Edwards R, Atanga JS, Kiawi EC, Unwin N, Mbanya JC. Anthropometry measures and prevalence of obesity in the urban adult population of Cameroon: an update from the Cameroon Burden of Diabetes Baseline Survey. BMC Public Health. 2006 Sep 13;6:228.
3. Després JP, Moorjani S, Lupien PJ, Tremblay A, Nadeau A, Bouchard C. Regional distribution of body fat, plasma lipoproteins, and cardiovascular disease. Arteriosclerosis. 1990;10(4):497-511.
4. Seidell JC, Verschuren WM, van Leer EM, Kromhout D. Overweight, underweight, and mortality: a prospective study of 48287 men and women. Arch Intern Med. 1996;156(9):958-63.
5. Azizi F, Ghanbarian A, Momenan AA, Hadaegh F, Mirmiran P, Hedayati M, et al. Prevention of non-communicable disease in a population in nutrition transition: Tehran Lipid and Glucose Study phase II. Trials. 2009 Jan 25;10:5.
6. Fujioka S, Matsuzawa Y, Tokunaga K, Tarui S. Contribution of intra-abdominal fat accumulation to the impairment of glucose and lipid metabolism in human obesity. Metabolism. 1987;36(1):54-9.
7. Caprio S, Hyman LD, McCarthy S, Lange R, Bronson M, Tamborlane WV. Fat distribution and cardiovascular risk factors in obese adolescent girls: importance of the intra-abdominal fat depot. Am J Clin Nutr. 1996;64(1):12-7.
8. Molarius A, Seidell JC. Selection of anthropometric indicators for classification of abdominal fatness--a critical review. Int J Obes Relat Metab Disord. 1998;22(8):719-27.
9. Mueller WH, Wear ML, Hanis CL, Emerson JB, Barton SA, Hewett-Emmett D, et al. Which measure of body fat distribution is best for epidemiologic research? Am J Epidemiol. 1991;133(9):858-69.
10. Pouliot MC, Després JP, Lemieux S, Moorjani S, Bouchard C, Tremblay A, et al. Waist circumference and abdominal sagittal diameter: best simple anthropometric indexes of abdominal visceral adipose tissue accumulation and related cardiovascular risk in men and women. Am J Cardiol. 1994;73(7):460-8.
11. Lemieux S, Prud’homme D, Bouchard C, Tremblay A, Després JP. A single threshold value of waist girth identifies normal-weight and overweight subjects with excess visceral adipose tissue. Am J Clin Nutr. 1996;64(5):685-93.
12. Dobbelsteyn CJ, Joffres MR, MacLean DR, Flowerdew G. A comparative evaluation of waist circumference, waist-to-hip ratio and body mass index as indicators of cardiovascular risk factors. The Canadian Heart Health Surveys. Int J Obes Relat Metab Disord. 2001;25(5):652-61.
13. Olinto MT, Nacul LC, Gigante DP, Costa JS, Menezes AM, Macedo S. Waist circumference as a determinant of hypertension and diabetes in Brazilian women: a population-based study. Public Health Nutr. 2004;7(5):629-35.
14. Ho SC, Chen YM, Woo JL, Leung SS, Lam TH, Janus ED. Association between simple anthropometric indices and cardiovascular risk factors. Int J Obes Relat Metab Disord. 2001;25(11):1689-97.
15. Physical status: the use and interpretation of anthropometry. Report of a WHO Expert Committee. World Health Organ Tech Rep Ser. 1995;854:1-452.
17. Jackson AS, Pollock ML, Ward A. Generalized equations for predicting body density of women. Med Sci Sports Exerc. 1980;12(3):175-81.
18. Friedewald WT, Levy RI, Fredrickson DS. Estimation of the concentration of low-density lipoprotein cholesterol in plasma, without use of the preparative ultracentrifuge. Clin Chem. 1972;18(6):499-502.
19. James PT, Leach R, Kalamara E, Shayeghi M. The worldwide obesity epidemic. Obes Res. 2001;9(Suppl 4):228S-233S.
20. Kannel WB, D’Agostino RB, Cobb JL. Effect of weight on cardiovascular disease. Am J Clin Nutr. 1996;63(3 Suppl):419S-422S.
21. Azadbakht L, Mirmiran P, Shiva N, Azizi F. General obesity and central adiposity in a representative sample of Tehranian adults: prevalence and determinants. Int J Vitam Nutr Res. 2005;75(4):297-304.
22. Hosseinpanah F, Barzin M, Sarbakhsh-Eskandary P, Mirmiran P, Azizi F. Trends of obesity and abdominal obesity in Tehranian adults: acohort study. BMC Public Health. 2009 Nov 23;9:426.
23. Galal OM. The nutrition transition in Egypt: obesity, under nutrition and the food consumption context. Public Health Nutr. 2002;5(1A):141-8.
24. Yumuk VD, Hatemi H, Tarakci T, Uyar N, Turan N, Bagriacik N, et al. High prevalence of obesity and diabetes mellitus in Konya, a central Anatolian city in Turkey. Diabetes Res Clin Pract. 2005;70(2):151-8.
25. Erem C, Arslan C, Hacihasanoglu A, Deger O, Topbas M, Ukinc K, et al. Prevalence of obesity and associated risk factors in a Turkish population (Trabzon city, Turkey). Obes Res. 2004;12(7):1117-27.
26. Sibai AM, Hwalla N, Adra N, Rahal B. Prevalence and covariates of obesity in Lebanon: findings from the first epidemiological study. Obes Res. 2003;11(11):1353-61.
27. Ledoux M, Lambert J, Reeder BA, Després JP. Correlation between cardiovascular disease risk factors and simple anthropometric measures. Canadian Heart Health Surveys Research Group. CMAJ. 1997;157(Suppl 1):S46-53.
28. Rimm EB, Stampfer MJ, Giovannucci E, Ascherio A, Spiegelman D, Colditz GA, et al. Body size and fat distribution as predictors of coronary heart disease among middle-aged and older US men. Am J Epidemiol. 1995;141(12):1117-27.
29. Goodman-Gruen D, Barrett-Connor E. Sex differences in measures of body fat and body distribution in the elderly. Am J Epidemiol. 1996;143(9):898-906.
30. Folsom AR, Kaye SA, Sellers TA, Hong CP, Cerhan JR, Potter JD, et al. Body fat distribution and 5-year risk of death in older women. JAMA. 1993;269(4):483-7
31. Onat A, Sansoy V, Uysal O. Waist circumference and waist-to-hip ratio in Turkish adults: interrelation with other risk factors and association with cardiovascular disease. Int J Cardiol. 1999;70(1):43-50.
32. Ward KD, Sparrow D, Vokonas PS, Willett WC, Landsberg L, Weiss ST. The relationships of abdominal obesity, hyperinsulinemia and saturated fat intake to serum lipid levels: the Normative Aging Study. Int J Obes Relat Metab Disord. 1994;18(3):137-44.