Translation, adaptation, and validation of the
Sunderland Scale and the Cubbin & Jackson
Revised Scale in Portuguese
INTRODUCTION
Pressure ulcers (PUs) are considered a health care problem because of their impact on the quality of life and the high cost of treatment due to expenses incurred from the medical workforce, materials, and hospitalization. In the current economic context, the eicient use of resources is imperative, and concerns about healthcare quality and, consequently, patient safety are a reality.
herefore, it is crucial to prevent this phenomenon, beginning with the correct identiication of patients at risk. Risk assessment is an inherent requirement for prevention. Several factors contribute to the development
Bruno Sousa1
1. Neuro Critical Intensive Care Unit, Centro Hospitalar de Lisboa Central, EPE - Lisboa,
Portugal. Objective: To translate into Portuguese
and evaluate the measuring properties of the Sunderland Scale and the Cubbin & Jackson Revised Scale, which are instruments for evaluating the risk of developing pressure ulcers during intensive care.
Methods: his study included the
process of translation and adaptation of the scales to the Portuguese language, as well as the validation of these tools. To assess the reliability, Cronbach alpha values of 0.702 to 0.708 were identiied for the Sunderland Scale and the Cubbin & Jackson Revised Scale, respectively. he validation criteria (predictive) were performed comparatively with the Braden Scale (gold standard), and the main measurements evaluated were sensitivity, speciicity, positive predictive value, negative predictive value, and area under the curve, which were calculated based on cutof points.
Results: he Sunderland Scale exhibited 60% sensitivity, 86.7% speciicity, 47.4% positive predictive value, 91.5% negative predictive value, and 0.86 for the area under the curve. he Cubbin & Jackson Revised Scale exhibited 73.3% sensitivity, 86.7% speciicity, 52.4% positive predictive value, 94.2% negative predictive value, and 0.91 for the area under the curve. he Braden scale exhibited 100% sensitivity, 5.3% speciicity, 17.4% positive predictive value, 100% negative predictive value, and 0.72 for the area under the curve.
Conclusions: Both tools demonstrated reliability and validity for this sample. he Cubbin & Jackson Revised Scale yielded better predictive values for the development of pressure ulcers during intensive care.
This study was conducted in the Intensive Care Unit of the Hospital Santo António dos Capuchos, Centro Hospitalar de Lisboa Central, E.P.E - Lisboa, Portugal.
Conflicts of interest: None. Submitted on December 1, 2012 Accepted on June 23, 2013
Corresponding author:
Bruno Sousa
UCI Neurocríticos, Centro Hospitalar Lisboa Central, E.P.E. - Hospital São José Rua José António Serrano, 1150-199 Lisboa, Portugal
E-mail: [email protected]
ABSTRACT
Keywords: Validation studies; Risk assessment; Pressure ulcer/prevention & control; Pressure ulcer/nursing: Intensive care
Rev Bras Ter Intensiva. 2013;25(2):106-114
of PU with variable severity levels, which render the medical assessment diicult and cause the use of several risk assessment scales.(1)
Employing assessment scales that are suitable for all types of patients is an interesting idea because these instruments may be widely used and understood, thus easily facilitating the establishment of relationships and comparisons. here are multiple risk factors within the context of intensive care; thus, the scale used for risk assessment should not be one that is used for most patients but should be adapted to the speciicity of intensive care patients. he scale should present a greater breadth relative to the evaluation factors and be less general in terms of variability of the application ields, therefore yielding gains in precision, greater reliability, and greater ability to predict risk.(2,3)
Several risk assessment scales for the development of PUs have been introduced in health organizations.(4) Researchers conducting studies in intensive care units (ICUs) have concluded that the Cubbin & Jackson (C&J) scale is the one that should be used for the risk assessment of PU development in critical patients.(5-7)
he choice of this theme stems from the necessity of a tool (validated for Portuguese) for patients in intensive care, seeking thereby to improve health care and minimizing the harmful consequences and costs related to PUs. he goal of the present study was to translate, culturally adapt, and validate the Sunderland Pressure Sore Risk Calculator - Sunderland Scale(8)and the C&J(9) Revised Scale to Portuguese; to verify their measuring properties; and to compare them to the Braden Scale in terms of predictability, sensitivity, and speciicity.
METHODS
his study was approved by the Ethics Committee for Health of the Centro Hospitalar de Lisboa Central, E.P.E. Informed consent was obtained from the participants/families.
he present investigation was a predictive correlational study, conducted in a single intensive care unit (ICU) with eight polyvalent beds, which predominantly receives surgical and medical patients. he sample represented all users who were in the ICU
at the time of data collection using the scales and who consented to undergo the risk assessment for PU development.
he investigator completed the scale based on his observation of the patient during the medical care session, with no requirement for interventions that were not indicated or determined by the patient’s clinical situation. Unstable patients were not assessed.
he deinition of PUs from the Treatment and Prevention guidelines of the National Pressure Ulcer Advisor Panel/European Pressure Ulcer Advisor Panel (NPUAP/EPUAP) and the classiication from the International Classiication System of Pressure Ulcers were used.(10) he initial assessment occurred at admission or during the irst 24 hours, being repeated every 24 hours, and assessment was concluded when a PU developed or when the patient either died in the ICU or was discharged. he maximum monitoring length was 3 weeks (21 days). Data were collected from January to May 2012.
he data were entered and analyzed using the Statistical Package for the Social Science (SPSS®)
software, version 17, for descriptive analysis. Microsoft Excel® was used for contingency table construction; the
program Analyse-it® (integrated into Microsoft Excel)
was used for sensitivity, speciicity, and predictive value calculations (with their respective conidence intervals) for constructing curves using the Receiver Operating Characteristic (ROC) and for verifying the area under the curve (AUC) (with determination of the scales’ cutof points for better performance).
Translation and adaptation
Translation and cultural adaptation were performed based on recommendations that propose standardization that is comprised of the following
steps: translation and synthesis, back-translation
and synthesis, an expert committee, and a pretest. (11) Although directed at quality-of-life tools, the
propositions of these authors have been used for cross-cultural adaptations of various tools.(12)
analysis of the translated material was performed by the translators to reach a consensus on the translation outcome. he back-translation was conducted by a bilingual nurse whose native language is English and who was employed in the intensive care ield in Portugal, and by a bilingual translator whose native language is also English. he translators presented two diferent translations, which yielded a inal result after comparison. From the committee of experts, several alterations to both consensual translations were made, with terminology changes requiring the clariication of certain concepts, as expected.(11) After the adjustment recommended by the committee of experts the back-translation were sent to the authors of the original scale for comparison with the original scales. Next, a pretest was applied by a group of eight nurses, who were informed about the objectives of the protocol. he scale was applied to seven ICU patients after obtaining their informed consent.
After performing these steps, the inal versions of both scales in Portuguese (Tables 1 and 2) were achieved.
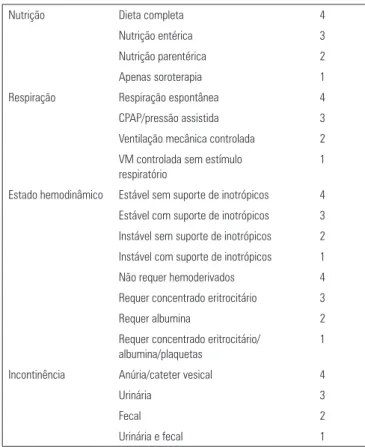
Table 2 - Cubbin & Jackson Revised Scale, Portuguese version
Table 1 - Sunderland Scale, Portuguese version
Continue... Pontuação
Condição médica Requer admissão 4
DM/Corticoterapia 3
Falência renal/diálise 2
Doença vascular 1
Peso Normal 4
Obesidade 3
Caquexia 2
Edema/anasarca 1
Pele Intacta 4
Eritema 3
Abrasão/escoriação 2
Necrose/exsudativa 1
Estado de consciência Acordado e alerta 4
Agitado/confuso 3
Sedado/apático 2
Coma/não responde 1
Temperatura corporal 36°C-37°C 4
37°C-37,5°C 3
>37,5°C 2
<36°C 1
... continuation
DM - diabetes mellitus; CPAP - continuous positive airway pressure; VM - ventlação mecânica. Alto risco pontuação ≤28; baixo risco ≥29.
Nutrição Dieta completa 4
Nutrição entérica 3
Nutrição parentérica 2
Apenas soroterapia 1
Respiração Respiração espontânea 4
CPAP/pressão assistida 3
Ventilação mecânica controlada 2
VM controlada sem estímulo respiratório
1
Estado hemodinâmico Estável sem suporte de inotrópicos 4 Estável com suporte de inotrópicos 3
Instável sem suporte de inotrópicos 2
Instável com suporte de inotrópicos 1
Não requer hemoderivados 4
Requer concentrado eritrocitário 3
Requer albumina 2
Requer concentrado eritrocitário/ albumina/plaquetas
1
Incontinência Anúria/cateter vesical 4
Urinária 3
Fecal 2
Urinária e fecal 1
Pontuação
Idade <40 4
40-55 3
55-70 2
>70 1
Peso Normal 4
Obesidade 3
Caquexia 2
Qualquer dos itens acima + edema/ anasarca
1
Antecedentes pessoais Nenhum 4
Moderados 3
Graves 2
Muito graves 1
Pele Intacta 4
Eritema (potencial perda de continuidade)
3
Abrasão/escoriação (superficial) 2
Necrose/exsudativa (profundas) 1
Rev Bras Ter Intensiva. 2013;25(2):106-114
Validation of the measuring tools
To proceed with validation of the scales, their measurement properties were tested.
he irst characteristic that a tool must possess is reliability, which is a property of measurement that is veriied by stability and internal consistency. Stability refers to the degree of concordance between two measurements taken at two diferent times. Internal consistency is deined as the degree to which the items of a tool measure the same concept.(13) In the present study, the internal consistency of the observed tools was veriied.
An instrument is valid when it measures what it is supposed to measure in a satisfactory manner.(14) Validity refers to the degree of precision with which the concept is represented by particular statements in the measuring tool.(13) here are several methods to verify the validity of a tool (face validity, content, criteria, and construct validity). In the present study, criteria validity and predictive validity were veriied and compared with the Braden Scale.
Psychometric-property analysis of the scales was performed with consideration of the cutof deined in the literature (Sunderland Scale=28, C&J Revised Scale=29, and Braden Scale=16). Contingency tables were created using the average scores of the patients who did not develop PU and the score on the day before PU onset, similar to the validation performed on a new scale that evaluated the risk of PU development.(15)
he calculated indicators were sensitivity, speciicity, positive and negative predictive values, precision, eiciency, Matthews’ correlation coeicient or coeicient
φ (phi), and AUCs obtained from the ROC curves.
RESULTS
he sample included 90 patients who were admitted to the ICU during the data collection period. he average age of the patients was 70 (69.9) years, with a minimum age of 18 years and a maximum age of 95 years. he sample consisted mainly of male patients (63.3%). he diagnoses leading to ICU admission were acute respiratory failure (35.6%), postoperative admission from elective (28.9%) or emergency (15.6%) surgery, and sepsis/septic shock (6%). he
... continuation
Mobilidade Deambula com ajuda 4
Muito limitada/levante para cadeirão 3 Imóvel mas tolera posicionamentos 2
Não tolera posicionamentos/totalmente dependente/decúbito ventral
1
Estado hemodinâmico Estável sem suporte de inotrópicos 4 Estável com suporte de inotrópicos 3
Instável sem suporte de inotrópicos 2 Instável com suporte de inotrópicos 1
Respiração Espontânea 4
CPAP/tubo em T 3
Ventilação mecânica 2
Exaustão respiratória 1
Necessidades de oxigênio
O2<40% - estável à mobilização 4 40%>O2<60% - estável à
mobilização
3
40%>O2<60% - gasimetria estável. Dessatura à mobilização
2
≥60% O2 - gasimetria instável. Dessatura em repouso
1
Nutrição Dieta completa 4
Dieta ligeira, dieta líquida, nutrição entérica
3
Nutrição parentérica 2
Apenas soroterapia 1
Incontinência Continente/anúria/cateter vesical 4
Urinária/sudorese profusa 3
Fecal/diarreia ocasional 2
Urinária e fecal/diarreia prolongada 1
Higiene Independente 4
Semi-dependente 3
Muito dependente 2
Completamente dependente 1
Classificação dos antecedentes pessoais
Nenhum Nenhum 4
Moderada Alterações cutâneas que afetem áreas suscetíveis à pressão
3
Graves Corticoides; artrite reumatoide; DM tipo 2; doenças auto-imunes; DPOC; doenças que limitem a mobilidade; insuficiência cardíaca congestiva
2
Muito graves Doença vascular periférica; DM tipo 1; síndrome compartimental; pessoa caída no domicílio previamente à admissão
1
most common admission diagnoses were postoperative, with 42 patients (46.7%), followed by medical services (17.8%), and emergency services (16.7%). he hematology and surgery services contributed to the sample with ten (11.1%) and eight (8.9%) patients, respectively. he average length of ICU stay was 6.14 days (standard deviation of 5.97 days, minimum of 1 day, and maximum of 36 days). Because surgery was the most common diagnosis, the following ICU discharge destination was observed: 49 (54.4%) patients were transferred to surgical services, 20 (22.2%) to medical services, 5 (5.6%) to hematology, and 14 (15.6%) eventually died.
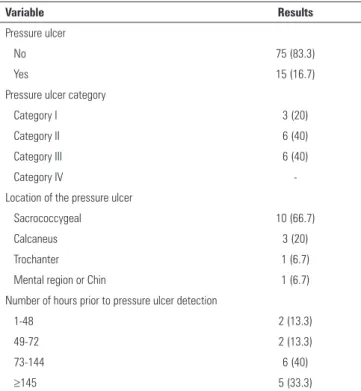
Fifteen (16.7%) patients developed PUs out of 90 included in this study, and the categories with the highest number of PUs were II and III, with six PUs each. he predominant region was the sacrococcygeal region, with 10 (66.7%) PUs. Regarding the elapsed time prior to PU development, 73.3% of the ulcers developed within 72 hours after admission to the ICU (Table 3).
condition,” “Incontinence,” and “Nutrition”) was observed to cause positive variations in Cronbach’s alpha. However, only “Nutrition” led to signiicant variation (Cronbach’s alpha = 0.75) due the sample’s size and homogeneity of the principle diagnosis (mainly surgical), for which nutrition begins at a later timepoint, all components of the scale were maintained because the total value was positive in terms of reliability (Table 4).
Table 3 - Characteristics of the pressure ulcers
Variable Results
Pressure ulcer
No 75 (83.3)
Yes 15 (16.7)
Pressure ulcer category
Category I 3 (20)
Category II 6 (40)
Category III 6 (40)
Category IV
-Location of the pressure ulcer
Sacrococcygeal 10 (66.7)
Calcaneus 3 (20)
Trochanter 1 (6.7)
Mental region or Chin 1 (6.7)
Number of hours prior to pressure ulcer detection
1-48 2 (13.3)
49-72 2 (13.3)
73-144 6 (40)
≥145 5 (33.3)
Results expressed in numbers (%).
Reliability analysis
he Cronbach alpha obtained for the Sunderland Scale was 0.702. he exclusion of three items (“Medical
Table 4 - Cronbach’s alpha; Sunderland Scale total statistics
Average of the scale if the item was
excluded
Variation of the scale if the item was
excluded
Corrected total item correlation
Cronbach’s alpha if the item was excluded
Medical condition
28.56 20.939 0.203 0.711
Weight 28.55 20.251 0.314 0.689
Skin 28.15 21.231 0.281 0.692
Consciousness 28.52 17.471 0.589 0.632
Temperature 28.67 18.660 0.426 0.668
Nutrition 30.36 24.510 -0.133 0.750
Breathing 28.53 17.976 0.615 0.631
Inotropics 28.18 18.196 0.723 0.620
Blood products 28.03 19.551 0.488 0.659
Incontinence 27.89 22.998 0.153 0.706
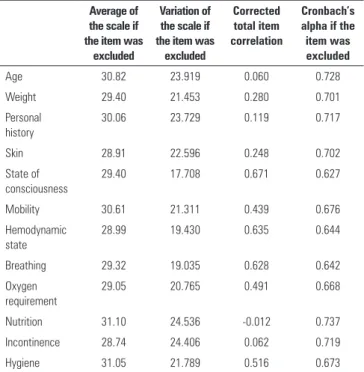
he Cronbach alpha of the C&J Revised Scale was 0.708. In this scale, similar to the Sunderland Scale, exclusion of most of the components would not be beneicial in terms of the scale’s reliability; only exclusion of the “Nutrition” component would produce a signiicant positive variation. However, as per the justiication used previously, all of the scale’s items were retained (Table 5).
Validity analysis
Rev Bras Ter Intensiva. 2013;25(2):106-114
correctly evaluated, regardless of whether the risk was high or low. The high-risk patients and those who developed PUs were correctly identified in 60% of the patients, and among those at low risk and who did not develop PU, 86.7% of the patients were correctly identified. The probability of a PU patient having been evaluated as high risk was 47.4%, and the probability of a non-PU patient having been evaluated as low risk was 91.5%. A phi coefficient greater than 0 indicated that the prediction was not random; if the value was less than 1, the prediction was not perfect. The ideal scale is that in which the balance between sensitivity and specificity is 100%, and the Sunderland Scale had a balance of 73.4%. Additionally, the positive likelihood ratio indicated that the patients assessed as high risk were 4.5 times more likely to develop PU.
Using the C&J Revised Scale, it was veriied that 81.1% of the patients were in the low risk category (Table 6). For the present sample, this scale (with a cutof described in the literature) presented a sensitivity of 73.3%, speciicity of 86.7%, precision of 84.4%, positive predictive value of 53.4%, negative predictive value of 94.2%, positive likelihood ratio of
5.50, negative likelihood ratio of 0.31, phi coeicient of 0.53, and eiciency of 80%. hus, 84.4% of the patients were correctly evaluated regardless of the risk involved. he high-risk patients who developed PU were correctly identiied in 73.3% of the cases, and among those who were low risk and did not develop PU, 89.7% were correctly identiied. he probability of a PU patient having been assessed as high risk was 52.4%, and the probability of a non-PU patient having being evaluated as low risk was 94.2%. A phi coeicient greater than 0 indicated that the prediction was not random; if the value was less than 1, the prediction was not perfect. he ideal scale is that in which the balance between sensitivity and speciicity is 100%, and the C&J Revised Scale had a balance of 80%. he positive likelihood ratio indicated that the evaluated patients assessed as high risk were 5.5 times more likely to develop PUs.
The use of the Braden Scale allowed for verifying that 95.5% of the patients were high risk (Table 6). For the present sample, the Braden Scale (with a cutoff described in the literature) had a sensitivity of 100%, specificity of 5.3%, precision of 21.1%, positive predictive value of 17.4%, negative predictive value of 100%, positive likelihood ratio of 1.06, negative likelihood ratio of 0, phi coefficient of 0.02, and efficiency of 52.7%. Only 22.2% of the patients were correctly evaluated, independently of their high- or low-risk status. All of the high-risk patients who developed PU were correctly identified, but with low sensitivity. This poor sensitivity did not allow for correct differentiation between patients with values below 50%, which resulted in poor predictive
capabilities.(16) The probability of a PU patient
having been evaluated as high risk was only 17.4%,
Table 5 - Cronbach’s alpha. Cubbin & Jackson Revised Scale total statistics
Average of the scale if the item was
excluded
Variation of the scale if the item was
excluded
Corrected total item correlation
Cronbach’s alpha if the item was excluded
Age 30.82 23.919 0.060 0.728
Weight 29.40 21.453 0.280 0.701
Personal history
30.06 23.729 0.119 0.717
Skin 28.91 22.596 0.248 0.702
State of consciousness
29.40 17.708 0.671 0.627
Mobility 30.61 21.311 0.439 0.676
Hemodynamic state
28.99 19.430 0.635 0.644
Breathing 29.32 19.035 0.628 0.642
Oxygen requirement
29.05 20.765 0.491 0.668
Nutrition 31.10 24.536 -0.012 0.737
Incontinence 28.74 24.406 0.062 0.719
Hygiene 31.05 21.789 0.516 0.673
Table 6 - Contingency table for the Sunderland Scale, Cubbin and Jackson Revised Scale, and Braden Scale
Sunderland Cubbin & Jackson Braden
UP (+)
UP (-)
Total UP (+)
UP (-)
Total UP (+)
UP (-)
Total
Risk (+)
9 10 19 11 10 21 15 71 86
Risk (-)
6 65 71 4 65 69 0 4 4
but the probability of a non-PU patient having been assessed as low risk was 100%. A phi coefficient only slightly higher than 0 indicated an almost random prediction. The Braden Scale achieved a balance of 52.7% between the sensitivity and specificity. In addition, the positive likelihood ratio was verified as indicating that the patients assessed as high risk were 1.06 times more likely to develop PUs.
Comparison of ROC curves
Using the data from the three scales, the following curves and ROC values were obtained: the AUC for the Sunderland Scale was 0.86%, with a 95% conidence interval (95% CI) of 0.77-0.95 (p<0.0001); the AUC for the C&J Revised Scale was 0.91%, with a 95% CI of 0.84-0.98 (p<0.0001); and the AUC for the Braden Scale was 0.72%, with a 95% CI of 0.56-0.87 (p<0.0032) (Figure 1).
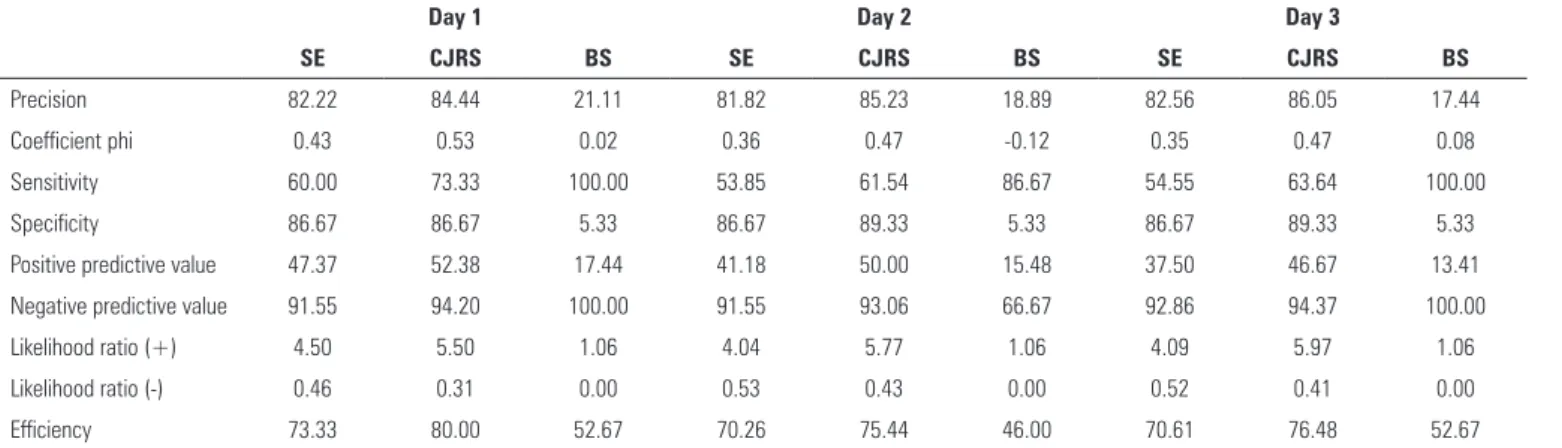
predictive values were obtained in the day preceding the occurrence of PUs. This result suggest that the assessment should be performed daily. In the C&J Revised Scale if surgery occurs 1 point should be deducted on the day of surgery.
DISCUSSION
Regarding the PU phenomenon, the present data were in agreement with the literature as to the location, with the sacrococcygeal region being the most representative,(5,17,18) and with regard to the time elapsed until PU formation, which was usually during the irst week of hospitalization.(19,20) In the literature, a higher incidence of category-I PUs and a lower incidence of category-III PUs were observed, which was not observed in the present study, wherein a predominance of category-II and category-III PUs was observed.(5,17)
Data from the second day of hospitalization were used for both scales in the reliability analysis. he second day was chosen because “the lower the variability of intra-subject responses and the greater the variability of inter-subject responses, the greater is the value of α.”(21) hus, a greater variation exists in the clinical evolution of the patients as well as a greater range of possible results. Cronbach’s alpha value obtained in the Sunderland Scale was 0.702, which “generally means that the tool or test is classiied as having adequate reliability when α is at least 0.70.”(21) he Cronbach alpha for the C&J Revised Scale was 0.708, which, as previously mentioned, is an appropriate reliability value.
Figure 1 - ROC curves for the Sunderland Scale, Cubbin & Jackson Revised Scale, and Braden Scale.
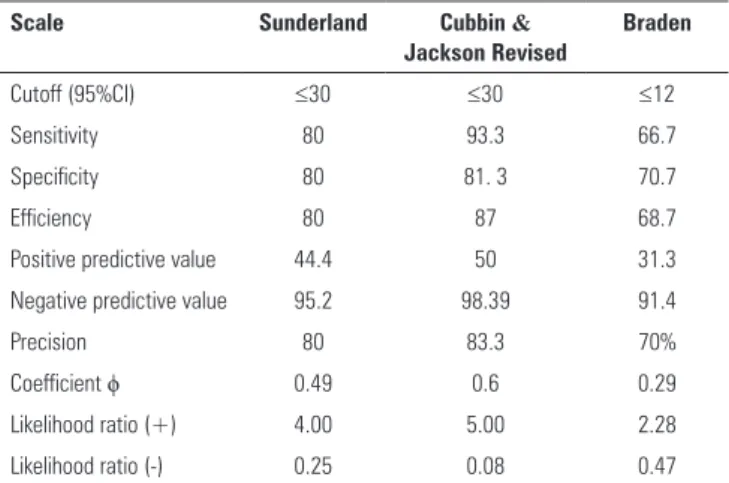
he use of ROC curves facilitated studying the scale behavior, in terms of sensitivity and speciicity, with diferent cutof points (Table 7). he use of a cutof point ≥30, in either the Sunderland Scale or the C&J Revised Scale, allowed for improved performance. he Braden Scale with a cutof point below that described in the Portuguese version also improved its predictive capabilities, but still kept below the value ranges for the two other scales.
Another concern raised in the literature is the assessment frequency. Table 8 shows that the best
Table 7 - Predictive properties of the scales with different cutoff points
Scale Sunderland Cubbin &
Jackson Revised
Braden
Cutoff (95%CI) ≤30 ≤30 ≤12
Sensitivity 80 93.3 66.7
Specificity 80 81. 3 70.7
Efficiency 80 87 68.7
Positive predictive value 44.4 50 31.3
Negative predictive value 95.2 98.39 91.4
Precision 80 83.3 70%
Coefficient ϕ 0.49 0.6 0.29
Likelihood ratio (+) 4.00 5.00 2.28
Likelihood ratio (-) 0.25 0.08 0.47
Rev Bras Ter Intensiva. 2013;25(2):106-114
Regarding the validity and considering the values obtained, the Sunderland Scale had acceptable predictive values for the development of PU in ICU patients, and thus this scale should be used. The same finding is true for the C&J Revised Scale, which was the scale that yielded the best overall values. The Braden scale, by the data obtained, suggests the necessity of intensifying nursing care in a greater number of patients who will not develop PU; therefore, its application should not be recommended, so that patients with a higher risk are provided with more available resources.
he inding obtained in this study are corroborated by the literature. Several studies comparing the Braden and C&J Scale in ICUs note that the C&J should be used based on the sensitivity, speciicity, predictive, and AUC values, and the C&J always yields better predictive values overall.(5,7,22)
Based on the ROC analysis and AUC values, it was verified that altering the cutoff points of the scales could improve their predictive capabilities, which has already been studied, especially for the Braden Scale.(23) However, given the sample used in
the present study, the decision was to maintain the recommendation of the original authors. Analysis of the predictive capabilities allows inferences about the necessity for constant monitoring, as the best overall values were observed within 24 hours preceding the development of PU, thus meeting the current recommendations.
he limitations of this study were the sample size, the type of ICU (i.e., not comprehensive, with homogeneity of diagnosis), and lack of inter-rater reliability veriication (because it will be essential that this tool yields the same results when used by diferent professionals).
CONCLUSIONS
he results suggest that the C&J Revised Scale should be used in ICUs because it yielded the best overall predictive values. his study contributed to the validation of tools appropriate for critical intensive care unit patients and thus identiies patients who require greater vigilance and intensity of care, thereby leading to better staf management and medical care.
Table 8 - Predictive properties of the scales in the days prior to pressure ulcer formation
Day 1 Day 2 Day 3
SE CJRS BS SE CJRS BS SE CJRS BS
Precision 82.22 84.44 21.11 81.82 85.23 18.89 82.56 86.05 17.44
Coefficient phi 0.43 0.53 0.02 0.36 0.47 -0.12 0.35 0.47 0.08
Sensitivity 60.00 73.33 100.00 53.85 61.54 86.67 54.55 63.64 100.00
Specificity 86.67 86.67 5.33 86.67 89.33 5.33 86.67 89.33 5.33
Positive predictive value 47.37 52.38 17.44 41.18 50.00 15.48 37.50 46.67 13.41
Negative predictive value 91.55 94.20 100.00 91.55 93.06 66.67 92.86 94.37 100.00
Likelihood ratio (+) 4.50 5.50 1.06 4.04 5.77 1.06 4.09 5.97 1.06
Likelihood ratio (-) 0.46 0.31 0.00 0.53 0.43 0.00 0.52 0.41 0.00
Efficiency 73.33 80.00 52.67 70.26 75.44 46.00 70.61 76.48 52.67
REFERENCES
1. Hidalgo P, Fernàndez F, Agreda J, Cuervo F. Valoración del riesgo de desarrollar úlceras por presión: uso clínico en España y metaanálises de la efectividad de las escales. Gerokomos. 2008;19(4):84-98.
2. Jull A, Griffiths P. Is pressure sore prevention a sensitive indicator of the quality of nursing care? A cautionary note. Int J Nurs Stud. 2010;47(5):531-3. 3. Papanikolaou P, Lyne P, Anthony D. Risk assessment scales for pressure
ulcers: a methodological review. Int J Nurs Stud. 2007;44(2):285-96. 4. Kottner J, Dassen T. Pressure ulcer risk assessment in critical care:
interrater reliability and validity studies of the Braden and Waterlow scales and subjective ratings in two intensive care units. Int J Nurs Stud. 2010;47(6):671-7.
5. Kim EK, Lee SM, Lee E, Eom MR. Comparison of the predictive validity among pressure ulcer risk assessment scales for surgical ICU patients. Aust J Adv Nurs. 2007;26(4):87-94.
6. Shahin ES, Dassen T, Halfens R. Predictive validity of pressure ulcer risk assessment tools in intensive care patients. Connect. 2007;5(3):75-9. 7. Jun Seongsook RN, Jeong Ihnsook RN, Lee Younghee RN. Validity of
pressure ulcer risk assessment scales; Cubbin and Jackson, Braden, and Douglas scale. Int J Nurs Stud. 2004;41(2):199-204.
8. Lowery MT. A pressure sore risk calculator for intensive care patients: ‘the Sunderland experience’. Intensive Crit Care Nurs. 1995;11(6):344-53. 9. Jackson C. The revised Jackson/Cubbin Pressure Area Risk Calculator.
Intensive Crit Care Nurs. 1999;15(3):169-75.
10. European Pressure Ulcer Advisory Panel and National Pressure Ulcer Advisory Panel. Prevention and treatment of pressure ulcers: quick reference guide. Washington DC: National Pressure Ulcer Advisory Panel; 2009. Available in http://gaif.net/sites/default/files/Guideline_Prevencao_ da_UPressao_PT.pdf
11. Beaton D, Bombardier C, Guillemin F, Ferraz M. Recommendations for the cross-cultural adaptation of health status measures. Illinois (USA): American Academy of Orthopedic Surgeons; 2002.
Objetivo: Traduzir para o português e avaliar as proprieda-des de medidas da Escala de Sunderland e da Escala Revista de Cubbin & Jackson, instrumentos cuja inalidade é avaliar o risco de desenvolvimento de úlceras por pressão em terapia intensiva.
Métodos: O estudo compreendeu os processos de tradução e de adaptação das escalas à língua portuguesa, bem como o processo de validação dos instrumentos em estudo. A amostra foi constitu-ída por 90 pacientes internados na unidade de terapia intensiva. Na avaliação da iabilidade, foram identiicados valores de alfa de Cronbach de 0,702 e de 0,708 para a Escala de Sunderland e a Escala Revista de Cubbin & Jackson, respectivamente. A validação de critério (preditiva) foi realizada comparativamente com a Escala de Braden (padrão-ouro), sendo as principais medidas avaliadas a sensibilidade, a especiicidade, o valor preditivo positivo, o valor preditivo negativo e a área sob uma curva, que foram calculadas com base nos pontos de corte deinidos pelos autores.
Resultados: A Escala de Sunderland obteve 60% de sen-sibilidade, 86,7% de especiicidade, 47,4% de valor preditivo positivo, 91,5% de valor preditivo negativo e 0,86 para a área sob uma curva. A Escala Revista de Cubbin & Jackson obteve 73,3% de sensibilidade, 86,7% de especiicidade, 52,4% de va-lor preditivo positivo, 94,2% de vava-lor preditivo negativo e 0,91 para a área sob uma curva. A Escala de Braden obteve 100% de sensibilidade, 5,3% de especiicidade, 17,4% de valor preditivo positivo, 100% de valor preditivo negativo e 0,72 para a área sob uma curva.
Conclusão: Ambos os instrumentos demonstram possuir
iabilidade e validade para a utilização. Nessa amostra, a Escala Revista de Cubbin & Jackson obteve melhores valores preditivos paradesenvolvimento de úlceras por pressão em terapia intensiva.
RESUMO
Descritores: Estudos de validação; Medição de risco;
Úlcera por pressão/prevenção & controle; Úlcera por pressão/ enfermagem; Terapia intensiva
12. Parent-Vachon M, Parnell LK, Rachelska G, Lasalle L, Nedelec B. Cross-cultural adaptation and validation of the Questionnaire for Pruritus Assessment for use in the French Canadian burn survivor population. Burns. 2008;34(1):71-92.
13. LoBiondo-Wood G, Haber J. Pesquisa em enfermagem: métodos, avaliação crítica e utilização. 4ª ed. Rio de Janeiro: Guanabara e Koogan; 2001. 14. McDowell I. Measuring health: a guide to rating scales and questionnaires.
3rd ed. New York: Oxford University Press; 2006.
15. Suriadi, Sanada H, Sugama J, Thigpen B, Subuh M. Development of a new risk assessment scale for predicting pressure ulcers in an intensive care unit. Nurs Crit Care. 2008;13(1):34-43.
16. Marôco J. Análise estatística com o SPSS Statistics. 5ª ed. Pero Pinheiro: ReportNumber; 2011.
17. Cox J. Predictors of pressure ulcers in adult critical care patients. Am J Crit Care. 2011;20(5):364-75.
18. Manzano F, Navarro MJ, Roldán D, Moral MA, Leyva I, Guerrero C, Sanchez MA, Colmenero M, Fernández-Mondejar E; Granada UPP Group. Pressure ulcer incidence and risk factors in ventilated intensive care patients. J Crit Care. 2010;25(3):469-76.
19. Fernandes LM. Efeitos de intervenções educativas no conhecimento e práticas de profissionais de enfermagem e na incidência de úlcera de pressão em centro de terapia intensiva [tese]. Ribeirão Preto: Escola de Enfermagem de Ribeirão Preto da Univerisdade de São Paulo; 2006. 20. Blanes L, Duarte IS, Calil JA, Ferreira LM. Avaliação clínica e epidemiológia
das úlceras por pressão em pacientes internados no Hospital São Paulo. Rev Assoc Med Bras. 2004;50(2):182-7.
21. Marôco J, Garcia-Marques T. Qual a fiabilidade do alfa de Cronbach ? Questões antigas e soluções modernas ? Lab Psicologia. 2006;4(1):65-90. 22. Machado SP. Aplicação de escalas de avaliação de risco para úlcera de
decúbito em pacientes de terapia intensiva [tese]. Niterói: Departamento de Enfermagem da Universidade Federal Fluminense; 2006.