Evaluating Cardiac Vagal Activity on a Conventional
Electrocardiogram
Flávia P. Teixeira
1, Djalma R. Ricardo
2, Claudia Lucia Barros de Castro
3, Claudio Gil S. de Araújo
1,3Graduate course in Physical Educaton at the Universidade Gama Filho1, Faculdade de Ciências Médicas e da Saúde de Juiz de Fora – SUPREMA2 and
CLINIMEX – Clínica de Medicina do Exercício3 – Juiz de Fora, MG - Rio de Janeiro, RJ - Brazil
Summary
Objective: To determine the viability of using a conventional electrocardiogram (ECG) tracing for assessment of CVA.
Methods: We retrospectively analyzed 1395 individuals (995 males), aged 46 ± 17.2 years (mean ± standard deviation) with conventional ECG tracings to measure the delta RR (which represents the difference in milliseconds (ms) between the greatest and smallest RR interval) and results of a second autonomic parasympathetic evaluation, the 4-second exercise test (T4s), that quantifies CVA by the cardiac vagal index (CVI). ROC curves were obtained to determine the values of Delta RR for a closer correlation with sensitivity and specificity for 1.20 and 1.95 ms, the low and high CVA cutoff points, respectively.
Results: The delta RR levels correlated significantly with those of the CVI (r=0.40; p<0.001). We identified ≤ 60 and ≥
120 ms as the best cutoff points for low and high CVA. Sensitivity was 75% and 57%, specificity was 62% and 79%, and the areas of the ROC curves were 0.76 and 0.74, respectively.
Conclusion: The visual measurement of delta RR on an ECG tracing seems to be a valid quick preliminary clinical evaluation of CVA and can be useful in medical offices, emergency units, or situations in which the use of more sophisticated methods may not be feasible, appropriate, or convenient.
Key word: Exercise test, electrocardiography, heart rate.
Mailing address: Claudio Gil S. de Araújo •
Clinimex - Rua Siqueira Campos, 93/101 22031-070 – Rio de Janeiro, RJ - Brazil E-mail: [email protected]
Manuscript received August 18, 2006; revised manuscript received August 18, 2006; accepted October 5, 2006.
Introduction
An adverse autonomic condition is frequently associated with a greater mortality risk due to cardiovascular causes and all causality1-4, primarily because of a decrease in cardiac vagal
activity (CVA)1,5-7. This lower vago-dependent cardioprotection
can be evaluated by the different heart rate (HR) behaviors, such as in situations of rest2 and exercise8-10. Therefore, HR
modulation has been widely used as a tool for analysis of the CVA, and is considered a potent and independent prognostic indicator of mortality11.
In clinical practice, CVA can be measured by different procedures such as heart rate variability (HRV) in the domains of time and frequency, on short and long electrocardiograph (ECG) tracings, by baroreflex sensitivity (BRS)12, and by diverse
maneuvers such as respiratory sinus arrhythmia (RSA)13 and the
initial and final transients of an exercise14,15. In this perspective,
Araújo et al16 proposed and validated a protocol called the
4-second exercise test (T4s) in order to evaluate, both reflectively and isolatedly, the CVA by means of the initial HR transient in a sudden dynamic exercise carried out under controlled respiratory conditions, expressed adimensionally by the cardiac vagal index (CVI). This pharmacologically validated16
and highly reliable17 test has been increasingly applied in areas
of clinical research and exercise medicine, proving extremely useful not only as a diagnostic tool18,19, but as a longitudinal
follow-up of CVA20 as well.
Several research groups17,21-23 have already showed that
the reduction of the CVA, measured by HRV, is the main predictor of complex arrhythmias such as sustained ventricular tachycardia, in a 24-hour ECG24, and even precedes episodes
of sudden death25. However, the possibility of evaluating the
CVA based on simple visual measurements of the duration of RR intervals on short conventional electrocardiographic tracings at rest, with no control of the respiratory pattern or influence of specific respiratory maneuvers, is not known.
The objective of this study was to test the viability of using conventional 10-second ECG tracings to assess the CVA, observing its sensitivity and specificity regarding CVI.
Methods
found in a publication by our research group28.
Delta RR measurement (conventional ECG) - We obtained the measurement of delta RR, based on a resting 10-second ECG (Schiller Cardiovit AT 10, Switzerland) in the supine position, with no respiratory control, after the patient had been at rest, by observing the long DII lead, at a 25 mm/s paper speed.
The delta RR on this tracing, expressed in ms, was obtained by the difference between the longest and the shortest RR intervals contained in this recording, excluding extrasystole or escape rhythm. The RR intervals were measured visually (sometimes with the aid of a millimeter lens) by a trained physician, using a 10 ms resolution (0.25 mm), before he was informed of the T4s result.
Statistics and data analysis procedure - Initially, normality and homoscedasticity of distribution were tested, validating the use of parametric statistics. In order to assess the association between the variables analyzed, we used Pearson’s product-moment correlation. The sample was subdivided into three subgroups according to the CVA measured on the T4s
by the CVI cutoff points (≤ 1.20, between 1.21 and 1.94, and ≥ 1.95) and variance analysis was used to observe the
differences between the means of delta RR among the three subgroups, followed by Bonferroni post hoc comparisons, whenever appropriate.
The ROC curves were calculated in order to determine the values of delta RR with the best sensitivity and specificity for the proposed cutoff points for a high and low CVA, respectively, CVIs of 1.20 and 1.95. The lower cutoff point was based on previous studies at our laboratory9,17, while the upper
cutoff point was based on the 95th percentile for CVI in the
young (between 18 and 35 years of age) and healthy sample of the extensive database of our laboratory. The analyses were performed with the SPSS statistics software, 13.0 version, All subjects evaluated were voluntarily submitted to an
exercise medicine assessment geared towards a clinical diagnosis or physical exercise orientation. This appraisal was comprised of a clinical visit that included a detailed medical history and physical examination, a conventional resting electrocardiogram, a 4-second exercise test (T4s), spirometry test and a maximal exercise cardiopulmonary test, all carried out during the same visit and in this order.
Additionally, before any of the procedures took place, subjects read and signed an informed consent form that had been previously approved by the Research Ethics Committee. Most subjects were light-skinned and came from a high socioeconomic bracket.
The 4-second exercise test -The T4s was pharmacologically validated16 for an isolated evaluation of the integrity of the CVA
through analysis of the initial HR transient (resting-exercise transition), and had already been used in studies conducted by our group16,26 and by other researchers27. The T4s consists
of pedaling as fast as possible on a lower-limb cycle-ergometer (Cateye EC-1600, Cat Eye, Japan) with no load, from the 4th
to the 8th second of a 12-second maximal inspiratory apnea.
During the T4s test, the patient’s feet are affixed to the pedals with toe clips. Under electrocardiographic monitoring (Elite Ergo PC 3.1.2.5, Micromed, Brazil) of one lead, generally CM5 or CC5, certain RR intervals are visually identified and subsequently measured during the maneuver with the help of software resources, using a 10 ms resolution. The T4s quantifies the CVA by means of the CVI, which represents the heart rate acceleration reflectively triggered by vagal cardiac inhibition. The CVI is expressed by the ratio between the RR interval immediately before exercise or the first RR interval of the exercise, whichever is longest (RRB), and the shortest RR interval during exercise (RRC). Generally, two maneuvers are performed, and the one that provides the greater CVI value is chosen. A more detailed explanation of the method may be
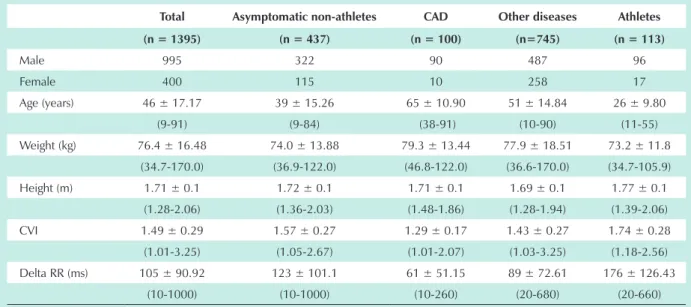
Table 1 - Sample description
Total Asymptomatic non-athletes CAD Other diseases Athletes
(n = 1395) (n = 437) (n = 100) (n=745) (n = 113)
Male 995 322 90 487 96
Female 400 115 10 258 17
Age (years) 46 ± 17.17 39 ± 15.26 65 ± 10.90 51 ± 14.84 26 ± 9.80 (9-91) (9-84) (38-91) (10-90) (11-55) Weight (kg) 76.4 ± 16.48 74.0 ± 13.88 79.3 ± 13.44 77.9 ± 18.51 73.2 ± 11.8
(34.7-170.0) (36.9-122.0) (46.8-122.0) (36.6-170.0) (34.7-105.9) Height (m) 1.71 ± 0.1 1.72 ± 0.1 1.71 ± 0.1 1.69 ± 0.1 1.77 ± 0.1
(1.28-2.06) (1.36-2.03) (1.48-1.86) (1.28-1.94) (1.39-2.06) CVI 1.49 ± 0.29 1.57 ± 0.27 1.29 ± 0.17 1.43 ± 0.27 1.74 ± 0.28
(1.01-3.25) (1.05-2.67) (1.01-2.07) (1.03-3.25) (1.18-2.56) Delta RR (ms) 105 ± 90.92 123 ± 101.1 61 ± 51.15 89 ± 72.61 176 ± 126.43
(10-1000) (10-1000) (10-260) (20-680) (20-660)
USA, except for the ROC curves that were calculated using Medcalc 7.3.0.1 version software, Belgium. Financial support was provided by the CNPq and FAPERJ.
Results
The values of delta RR showed a significant correlation with the CVI (r=0.40; p<0.001). Based on the cutoff points used for the CVI, 199 individuals were classified as having low CVA and 106 as having high CVA. When stratified by sample characteristics, we found that among the 113 athletes, only one had low CVA, and among the 100 subjects with CAD, only three had elevated CVA.
The values of the delta RR in ms, expressed as means (95% CI) in the three groups were 57 (51 - 63), 105 (100 - 110), and 188 (159 - 218). The results of the variance analysis and of the Bonferroni post hoc comparisons are shown on Figure 1.
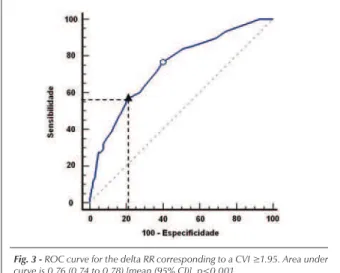
Analyzing the ROC curves, we identified ≤ 60 and ≥ 120
ms as the best cutoff points corresponding to the low (CVI
≤ 1.20) and high (CVI ≥ 1.95) CVAs, with sensitivity levels
of 75% and 57%, and specificity levels of 62% and 79%,
respectively. Curves and their respective areas are shown on Figures 2 and 3.
Figures 4 and 5 illustrate the resting ECG tracings,
Fig. 1 - Box-and-whiskers plot with the results of variance analysis for delta RR among the three subgroups divided by the CVI cutoff points. CVI- cardiac vagal index. * p < 0.001.
Fig. 2 - ROC curve for the delta RR corresponding to a CVI ≤1.20. Area under curve is 0.74 (0.72 to 0.76) [mean (95% CI)], p<0.001.
Fig. 3 - ROC curve for the delta RR corresponding to a CVI ≥1.95. Area under curve is 0.76 (0.74 to 0.78) [mean (95% CI)], p<0.001.
Fig. 4 - Male, 29 years old, weight 67 kg, height 1.68 m, professional athlete (field soccer).
objective of this research was to propose a simple, quick, non-invasive, and extremely practical strategy for the evaluation of CVA based on a conventional ECG tracing in emergency rooms, rescue vehicles, medical offices, or even non-medical environments such as sports arenas, home care, or airports.
An earlier study by our research group37 identified an
important correlation between the CVI and the duration of RR intervals on a resting ECG in athletes. Seeking to identify an electrocardiographic criterion for vagotonia, we used the ROC curve, showing that a mean of RR intervals over 990 ms would have sufficient accuracy (75%) to identify vagotonia, which was defined in that study as a CVI over 2.0 because of the smaller sample and the exclusive participation of athletes.
Our results corroborated the impression of a significant association between the CVI and the delta RR measurement on a resting ECG tracing without respiratory maneuvers in an intentionally ample and heterogeneous sample, encompassing healthy and non-healthy adults and athletes. This suggests that the information provided by this measurement is clinically relevant and may have wide practical applicability. We further note that the values proposed by the ROC curves for delta RR proved very robust for the populational extremes, i.e., subjects with CAD and healthy subjects, as shown in the results.
A practical question could be asked regarding the delta RR measurement. Is it necessary and feasible to measure with a 10 ms resolution in emergency situations? Considering that high and low CVAs are represented by 60 and 120 ms, respectively, it is simple to visually distinguish and measure these values (1.5 and 3 mm) on a long DII tracing, thus allowing an easy estimate of the CVA in several circumstances of the medical practice, even without carefully measuring the delta RR with the resolution adopted in our analysis.
We recognize, however, that control difficulties in producing an ECG tracing such as the time of decubitus, absence of noise, and the emotional state of the individuals analyzed, may constitute limitations to the external validity of the study. Nevertheless, considering the wide use of an ECG tracing in different clinical situations and the simplicity of the method we present, in contrast to the complexity of other methods currently available for the same purpose, we recognize the potential of the delta RR measurement as a practical method for a preliminary clinical evaluation of CVA.
We conclude that the visual measurement of delta RR in 10s of an ECG tracing in one single lead seems to be a valid tool for a simple and low-cost preliminary estimate of cardiac vagal integrity; this may prove to be potentially useful in situations where more sophisticated methods of autonomic evaluation may not be feasible, timely or convenient.
with measurements of delta RR, and of the T4s, with the measurement of the CVI, from two typical cases, one with a low CVA and the other with a high CVA.
Discussion
The rapid HR transient at the beginning of a passive29
or active exercise occurs exclusively by vagal removal, as was pharmacologically validated by Araújo et al16; it is the
physiological basis of the T4s. We know that the magnitude and part of the variability of the resting HR depend on the parasympathetic branch of the autonomic nervous system. Although they represent distinct physiological moments of autonomic activity, we noted an association between results found with these two methods for CVA evaluation.
In scientific literature we observe the proposition of diagnostic methods habitually stemming from the results obtained by ROC curves, considering as valid a method with a curve area greater than 0.5030. Additionally, the levels obtained
for sensitivity and specificity of the method proposed have great clinical relevance. Roche et al31 noted that the reduction
in HR variability in the time domain is a valid screening tool for the sleep apnea syndrome, with results of 89.7% in sensitivity and 98.1% in specificity.
In the past, the RSA was the most utilized method for CVA evaluation. The difference was measured between the RR intervals in distinct respiratory maneuvers. However, some years ago, Piepoli et al32 showed that the RSA could
be modified according to the baroreflex stimulation of arterial receptors, thus leading to the development and implementation of new methods.
At present, the main studies on the theme use spectral analysis methods with measurements in the time or frequency domains33, graphics of Poincaré, analysis of heart rate
turbulence34, and fractal analysis24. Nonetheless, there are
significant methodological differences, and some showed conflicting results that allowed criticism of the referred methods, such as that by Goldberger et al35, who suggested that
the baseline level of parasympathetic activity and the stimulus intensity determine the magnitude of the HR variability, by the effect observed in the sinus node. In fact, considering the multiplicity of factors that interfere in the autonomic components and are practically impossible to control by a 24-hour tracing, this makes the interpretation of these analyses even more difficult and limits their clinical use.
In a prior investigation conducted by specialists36, the
presence of RSA in a resting ECG was considered one of the criteria of greatest suspicion for an increased CVA. Thus, the
References
1. Kleiger RE, Miller JP, Bigger JT Jr, Moss AJ. Decreased heart rate variability and its association with increased mortality after acute myocardial infarction. Am J Cardiol. 1987;59:256-62.
2. La Rovere MT, Bigger JT Jr, Marcus FI, Mortara A, Schwartz PJ. Baroreflex sensitivity and heart-rate variability in prediction of total cardiac mortality after myocardial infarction. ATRAMI (Autonomic Tone and Reflexes After Myocardial Infarction) Investigators. Lancet. 1998;351:478-84.
3. Cole CR, Blackstone EH, Pashkow FJ, Snader CE, Lauer MS. Heart-rate recovery immediately after exercise as a predictor of mortality. N Engl J Med. 1999;341:1351-7.
4. Huikuri HV, Makikallio T, Airaksinen KE, Mitrani R, Castellanos A, Myerburg RJ. Measurement of heart rate variability: a clinical tool or a research toy? J Am Coll Cardiol. 1999;34:1878-83.
function in hypertensive and normotensive subjects: the importance of gender. Hypertension. 2001;37:1351-6.
6. La Rovere MT, Bersano C, Gnemmi M, Specchia G, Schwartz PJ. Exercise-induced increase in baroreflex sensitivity predicts improved prognosis after myocardial infarction. Circulation. 2002;106:945-9.
7. Robinson TG, Dawson SL, Eames PJ, Panerai RB, Potter JF. Cardiac baroreceptor sensitivity predicts long-term outcome after acute ischemic stroke. Stroke. 2003;34:705-12.
8. Araújo CG. Fast “ON” and “OFF” heart rate transients at different bicycle exercise levels. Int J Sports Med. 1985;6:68-73.
9. Ricardo DR, de Almeida MB, Franklin BA, Araújo CG. Initial and final exercise heart rate transients: influence of gender, aerobic fitness, and clinical status. Chest. 2005;127:318-27.
10. Rocha GR, Stein R, Guimarães MR, Ribeiro JP. Resposta cronotrópica ao teste cardiopulmonar após o uso de cimetidina. Arq Bras Cardiol. 2006;86:206-10.
11. Buch AN, Coote JH, Townend JN. Mortality, cardiac vagal control and physical training -- what’s the link? Exp Physiol. 2002;87:423-35.
12. Castro CL, Nobrega AC, Araújo CG. Autonomic cardiovascular tests: a critical review. II. Arq Bras Cardiol. 1992;59:151-8.
13. Castro CL, Nobrega AC, Araújo CG. Autonomic cardiovascular tests: a critical review. I. Arq Bras Cardiol. 1992;59:75-85.
14. Gibbons RJ. Abnormal heart-rate recovery after exercise. Lancet. 2002;359:1536-7.
15. Arena R, Guazzi M, Myers J, Peberdy MA. Prognostic value of heart rate recovery in patients with heart failure. Am Heart J. 2006; 151: 851 e7-13.
16. Araújo CG, Nobrega AC, Castro CL. Heart rate responses to deep breathing and 4-seconds of exercise before and after pharmacological blockade with atropine and propranolol. Clin Auton Res. 1992;2:35-40.
17. Araújo CGS, Ricardo DR, Almeida MB. Intra and interdays reliability of the 4-second exercise test. Braz J Sports Med. 2003;9:299-303.
18. Lazzoli JK, Soares PP, Nobrega AC, Araújo CG. Electrocardiographic criteria for vagotonia-validation with pharmacological parasympathetic blockade in healthy subjects. Int J Cardiol. 2003;87:231-6.
19. Lazzoli JK, Castro CLB, Nóbrega ACL, Araújo CGS. Acurácia de critérios para vagotonia no eletrocardiograma de repouso de 12 derivações: uma análise com curvas ROC. Rev Bras Med Esporte. 2002;8:50-8.
20. Castro CLB, Nóbrega ACL, Araújo CGS. Cardiac vagal activity is still depressed two years after acute myocardial infarction. Med Sci Sports Exerc. 1993;25: S106.
21. Huikuri HV, Seppänen T, Koistinen MJ, Juhani Airaksinen KE, Ikäheimo MJ, Castellanos A, et al. Abnormalities in beat-to-beat dynamics of heart rate before the spontaneous onset of life-threatening ventricular tachyarrhythmias in patients with prior myocardial infarction. Circulation. 1996;93:1836-44.
22. Anderson KP, Shusterman V, Aysin B, Weiss R, Brode S, Gottipaty V. Distinctive RR dynamics preceding two modes of onset of spontaneous sustained ventricular tachycardia. ESVEM Investigators: Electrophysiologic Study Versus Electrocardiographic Monitoring. J Cardiovasc Electrophysiol. 1999;10:897-904.
23. Shusterman V, Aysin B, Weiss R, Brode S, Gottipaty V, Schwartzman D, et al. Dynamics of low-frequency R-R interval oscillations preceding spontaneous ventricular tachycardia. Am Heart J. 2000;139:126-33.
24. Kleiger RE, Stein PK, Bigger JT Jr. Heart rate variability: measurement and clinical utility. Ann Noninvas Electrocardiol. 2005;10:88-101.
25. Brembilla-Perrot B, Ross M, Jacquemin L, Beurrier D, Houplon P, Danchin N. Analysis of heart rate variability before and at the moment of cardiac death. Arch Mal Coeur Vaiss. 1997;90:1477-84.
26. Nobrega AC, Castro CL, Araújo CG. Relative roles of the sympathetic and parasympathetic systems in the 4-s exercise test. Braz J Med Biol Res. 1990;23:1259-62.
27. Knopfli BH, Bar-Or O. Vagal activity and airway response to ipratropium bromide before and after exercise in ambient and cold conditions in healthy cross-country runners. Clin J Sport Med. 1999;9:170-6.
28. Almeida MB, Ricardo DR, Araújo CG. Variabilidade da freqüência cardíaca em um teste de exercício verdadeiramente máximo. Rev SOCERJ. 2005;18:534-41.
29. Nobrega AC, Araújo CG. Heart rate transient at the onset of active and passive dynamic exercise. Med Sci Sports Exerc. 1993;25:37-41.
30. Cotter K, Peipert JF. Can you handle the truth (and know it when you see it)? Understanding sensitivity, specificity, predictive values, and ROC curves. J Minim Invasive Gynecol. 2005;12:385-90.
31. Roche F, Gaspoz JM, Court-Fortune I, Minini P, Pichot V, Duverney D, et al. Screening of obstructive sleep apnea syndrome by heart rate variability analysis. Circulation. 1999;100:1411-5.
32. Piepoli M, Sleight P, Leuzzi S, Valle F, Spadacini G, Passino C, et al. Origin of respiratory sinus arrhythmia in conscious humans: an important role for arterial carotid baroreceptors. Circulation. 1997;95:1813-21.
33. Menezes Jr AS, Moreira HG, Daher MT. Análise da variabilidade da freqüência cardíaca em pacientes hipertensos antes e depois do tratamento com inibidores da enzima conversora da angiotensina II. Arq Bras Cardiol. 2004;83:165-8.
34. Moraes RS, Ferlin EL, Polanczyk CA, Rohde LE, Zaslavski L, Gross JL, et al. Three dimensional return map: a new tool for quantification of heart rate variability. Auton Neurosci. 2000;83:90-9.
35. Goldberger JJ, Challapalli S, Tung R, Parker MA, Kadish AH. Relationship of heart rate variability to parasympathetic effect. Circulation. 2001;103:1977-83.