Brain stem and cerebellum
volumetric analysis of Machado
Joseph disease patients
Sarah Teixeira Camargos, Wilson Marques-Jr., Antonio Carlos dos Santos
ABSTRACT
Machado-Joseph disease, or spinocerebellar ataxia type 3(MJD/SCA3), is the most frequent late onset spinocerebellar ataxia and results from a CAG repeat expansion in the ataxin-3 gene. Previous studies have found correlation between atrophy of cerebellum and brainstem with age and CAG repeats, although no such correlation has been found with disease duration and clinical manifestations. In this study we test the hypothesis that atrophy of cerebellum and brainstem in MJD/SCA3 is related to clinical severity, disease duration and CAG repeat length as well as to other variables such as age and ICARS (International Cooperative Ataxia Rating Scale). Whole brain high resolution MRI and volumetric measurement with cranial volume normalization were obtained from 15 MJD/ SCA3 patients and 15 normal, age and sex-matchedcontrols. We applied ICARS and compared the score with volumes and CAG number, disease duration and age. We found significant correlation of both brain stem and cerebellar atrophy with CAG repeat length, age, disease duration and degree of disability. The Spearman rank correlation was stronger with volumetric reduction of the cerebellum than with brain stem. Our data allow us to conclude that volumetric analysis might reveal progressive degeneration after disease onset, which in turn is linked to both age and number of CAG repeat expansions in SCA 3. Key words: CAG expansion, Machado-Joseph disease, MJD/SCA3, spinocerebellar ataxia, volumetry.
Análise volumétrica de cerebelo e tronco cerebral de pacientes com doença de Machado Joseph
RESUMO
Doença de Machado-Joseph, ou ataxia espinocerebelar tipo 3 (MJD/SCA3) é ataxia espinocerebelar de início tardio mais frequente e resulta de uma expansão da repetição CAG no gene da ataxina-3. Estudos precedentes encontraram correlação entre a atrofia do cerebelo e do tronco cerebral com a idade e número de expansões CAG. Tais correlações não foram encontradas em relação ao tempo de doença ou manifestações clínicas. Neste estudo testamos a hipótese de que a atrofia do cerebelo e do tronco encefálico em MJD/SCA3 está relacionada à gravidade clínica, duração da doença e número de repetições CAG, bem como com outras variáveis como a idade e a ICARS (escala cooperativa internacional de avaliação de ataxias). Foram realizados estudos de imagem pela ressonância magnética de alta resolução e volumetria com normalização de volume craniano de 15 pacientes portadores de MJD/SCA3 e 15 controles pareados por idade e sexo. Nós aplicamos a ICARS e correlacionamos com o escore de volumes e número de CAG, duração da doença e idade. Encontramos correlação significativa entre atrofia de tronco cerebral e cerebelo com duração da doença, repetição CAG, idade e grau de acometimento da doença. O índice de correlação de Spearman foi maior em relação à atrofia de cerebelo do que à atrofia de tronco. Nossos dados permitem concluir que a análise volumétrica pode revelar degeneração progressiva após o início da doença que, por sua vez, está ligada à idade e número de expansões CAG em SCA 3.
Palavras-chave: expansão CAG, doença de Machado-Joseph, MJD/SCA3, ataxia espino cerebelar, volumetria.
Correspondence
Antonio Carlos dos Santos Rua Tenente Catão Roxo 1076 14051-140 Ribeirão Preto SP - Brasil E-mail- acsantos@fmrp.usp.br
Support
This work was supported by FAEPA (Fundação de Amparo ao Ensino e Pesquisa do Hospital das Clínicas da Faculdade de Medicina de Ribeirão Preto), CAPES (Coordenação de Aperfeiçoamento de Pessoal de Nível Superior) and FAPESP (Fundação de Amparo a Pesquisa do Estado de São Paulo)
Received 1 September 2010
Received in final form 23 November 2010
The autosomal dominant spinocerebellar ataxias (SCA) constitute a large and heterogeneous group of late-onset diseases. To date, at least 29 of them have been mapped, and 15 genes have been identiied. An exonic unstable CAG repeat expansion is the most frequent mu-tation associated with this group of neurodegenerative disorders1.
Machado Joseph disease (MJD) or spinocerebellar ataxia type 3 (MJD/SCA3) seems to be the most common late-onset spinocerebellar ataxia in many world regions, including Germany, Brazil, Portugal, India, France, North America,Japan,Chinaand Taiwan1-5. In normal individuals, the gene contains between 12 and 44 CAG repeats, whereas most patients have between 61 to 87 CAG repeats6.
his disease has been consistently associated to the presence of cerebellar atrophy that was initially indirectly demonstrated by pneumoencephalography7. More re-cently, qualitative and quantitative magnetic resonance image (MRI) techniques provide a morphologic evalu-ation of the brain structures involved in this and other central nervous system diseases (CNS), allowing to study the progression of the abnormalities and possible corre-lations between gene defects, morphological changes and clinical phenotypes, leading to a better understanding of these diseases and their natural history8,9.
Since the identiication of the Ataxin 3 gene,several of such studies have been undertaken in MJD/SCA3. Some authors found a moderate olivary and cerebellar atrophy10, while others reported that cerebellar and brain stem atrophy are signiicantly more severe in SCA1 and SCA2, proposing that SCA2 and MJD/SCA3 could be distinguished by studying the velocity of the saccadic oc-ular movement and the diameter of the middle cerebellar peduncle11. Some authors reported that atrophy was age and disease-duration dependent, afecting moderately the cerebellum and more severely the brainstem, spe-cially the pontine tegmentum12. hese indings were not conirmed by others that found correlation with age at examination and CAG repeats but not with disease dura-tion and clinical severity8.his divergence increased with another study, which failed to ind correlation between CAG expansion and atrophy in a series of SCA1, SCA2 and SCA3 patients13. Cerebellar and pontine volume seems to be more involved in SCA7 than in MJD/SCA3 and SCA6, regardless of severity of symptoms or dura-tion of the disease14.
More recently, the interest have focused on pons and basal ganglia involvement. Interestingly, a study showed that the atrophic process is not uniform inside the pons, being the tegmentum more afected than the pontine base9.
In this study we tried to sort out the correlations
be-tween image indings with clinical and genetic data ap-plying volumetric MRI measurements of posterior fossa structures, aiming to more precisely deine the link be-tween morphology and function in MJD/SCA3.
METHOD
Subjects
Fifteen consecutive patients with molecularly proven MJD/SCA3, and ifteen healthy normal controls matched for gender and age, were studied after excluding those with history of alcohol abuse and any other systemic or neurological disease. Disease duration was measured as years elapsed since the irstmotor symptom, and dis-ease severity was measured with the International Co-operative Ataxia Rating Scale (ICARS)15. his study was approved by the Research Ethics Committee of our in-stitution, and all patients signed an informed consent.
Molecular analysis
Lymphocyte DNA was isolated according to routine technique. The MJD/SCA3 gene was amplified using PCR as described before6. PCR product was submitted to 4% polyacrylamide gel electrophoresis in an automatic gene sequencer (ABI PRISM 377 DNA SEQUENCER-USA). Peak product was analyzed in relation to base pair number. CAG expansion number was calculated according to the formula: (number of base pairs- 160)/3.
Image acquisition and processing
MRI was performed on a 1.5-T system (Magneton Vi-sion, Siemens, Erlanger, Germany). he study protocol included a fast-spin echo axial, double echo PD-T2-weighted and axial FLAIR sequence to screen for focal lesions, and T1-weighted, three-dimensional spoiled gradient-recalled acquisition sequence with 1 mm slice-thickness for volumetric measurements.
Segmentation and normalization
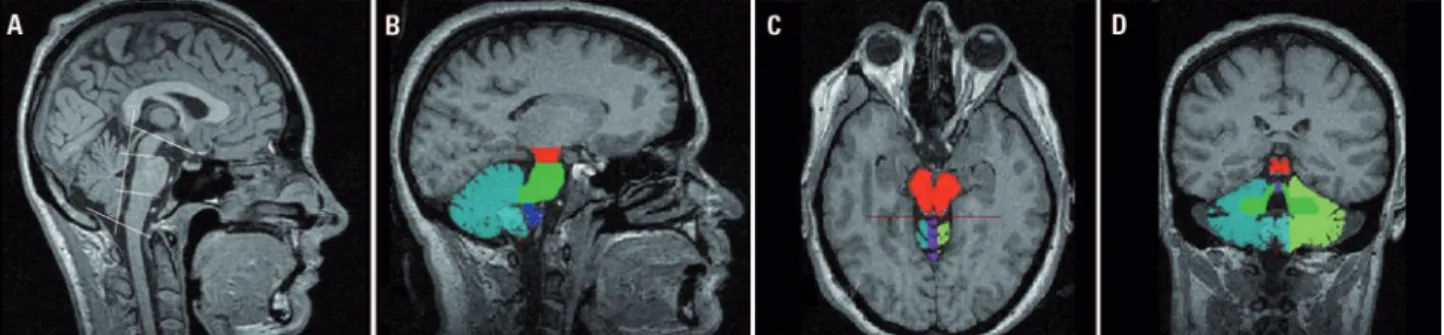
hemi-Figure. The segmentation of the posterior fossa structures were done according the color labels showed in [B] (sagittal), [C] (axial), and [D] (coronal) images, after brain stem division according the boundaries showed in [A].
spheres. We used intracranial volume (ICV) including brain and cerebrospinal luid for normalization of volu-metric data, as previously published17. he operator was blind in relation to the identity of control and patients.
Statistical analysis
Group comparisons were performed with the Mann Whitney U test allowing a conidence interval of at least 95%. Correlation of clinical indings and volumes were analyzed using Spearman’s bi-variate correlation. he software package SPSS for Windows (SPSS Inc., Ilinois; version 8.0) was used.
RESULTS
Patients age ranged from 18 to 72 years old (mean 44.3±15.6), and the the male: female ratio was 8:7. Dis-ease duration ranged from 1 to 21 years (mean 8.7±5.81) and CAG number from 65 to 88 repeats (72.7±5.3).
Except for tonsils, all measured structures were sig-niicantly reduced in patients than in controls (Table 1). Correcting the acquired values for the total intracra-nial volume did not change significantly the findings. he total brain stem reduction observed in the patient group was 28.5%, and the most affected brain stem structure was pons, with an average volume reduction
of 35.7%. The total cerebellum volume reduction was 18.7%, mainly due to vermis (32.2%) and hemispheres (22.5 and 14.7%).
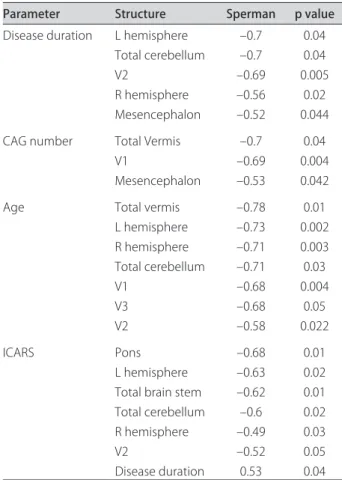
As shown in Table 2, an inverse correlation of disease duration were found with cerebellar hemispheres (–0.7, –0.56; p>0.05), total cerebellum (–0.7; p<0.05), V2 (–0.69 p<0.05) and mesencephalon volumes (–0.52; p>0.05). Another inverse correlation was found with CAG re-peat number and total vermis (–0.7, p>0.05), V1 (–0.69, p>0.05) and mesencephalon volumes (–0.53, p>0.05). With the exception of tonsils, age was inversely corre-lated with all cerebellar structures. ICARS had an inverse correlation with the volumes of pons (–0.68, p>0.05), total brain stem (–0.62, p>0.05), V2 (–0.52, p>0.05), cerebellar hemispheres (–0.63; –0.49, p>0.05) and total cerebellum (–0.6, p>0.05). In addition, ICARS and dis-ease duration showed a direct correlation. No correla-tions were found between studied parameters and me-dulla oblongata and tonsil.
DISCUSSION
In this study, we tried to correlate a volumetric anal-ysis based on MRI examination with clinical and genetic data, to better understand the natural history and the anatomic basis of MJD/SCA3 disease. he volumetric Table 1. Brain stem and cerebellum volumes after normalization.
Structure Control (Mean±SD) Patient (Mean±SD) Variation (%) p
Mesencephalon 3.765 ±0.386 3.364±0.437 10.6 <0.05
Pons 13.408±2.007 8.614 ±1.935 35.7 <0.01
Medulla oblongata 2.618±0.896 2.105±0.304 19.6 <0.05
Total brain stem 19.792±2.672 14.152±2.355 28.5 <0.01
Tonsil 2.471±0.772 2.512±0.856 – >0.05
V1 1.515±0.302 0.969±0.2009 35.7 <0.01
V2 0.878±0.108 0.554±0.171 36.9 <0.01
V3 1.130±0.181 0.867±0.205 23.8 <0.05
Total vermis 3.525±0.544 2.391±0.509 32.2 <0.01
L-hemisphere 33.080±2.861 25.635±4.1025 22.5 <0.05
R-hemisphere 30.599±8.640 26.105±4.610 14.7 <0.05
method applied in the present study has some advan-tages due to the use of high resolution whole brain im-ages, a robust algorithm for partial volume reduction, and normalization with ICV to avoid body volume and technical influence. These particularities may explain some of the diferences we found17. In agreement to our data, reduced brainstem and cerebellar volume in MJD/ SCA3 patients has been widely demonstrated9-13. The most afected brain stem structure was the pons, with an average volume reduction of 35.7%. his inding con-trast with previous indings reporting only a mild pon-tine atrophy13,14. It is noteworthy that our measurements included part of the cerebellar peduncles and not only the ventral pons, since it is impossible to deine the cer-ebellar anterior limit and brain stem anatomically. It has already been demonstrated that the volumes of the pe-duncles are decreased in the disease and that there is a positive correlation between the width of the cerebellar peduncle and the diameter of the pons12.
he most afected vermis subdivisions were V1 and V2 (with an average reduction of 37%) whereas V3 was relatively spared with an average reduction of 24%. Cer-ebellar hemispheres evidenced an average reduction of 19%. Subdivisions of the vermis have not been studied previously; neither correlations between them and other
parameters such as age, CAG number, disease duration and ICARS. According to our data, the disease process did not afect tonsils. Given tonsils are structures which prove diicult to limit, having partial volume efect;we used some of the strategies previously described - sag-ittal slices in parallel with coronal slices - to increase the accuracy of the measurements18.
Disease duration
We found an inverse correlation between disease duration and midbrain, V2, hemispheres and total cere-bellum, but not with pons. his could be a time-related effect on the structures derived from midbrain, cere-bellum and anterior vermis. Our results contrast with previous indings such as a negative correlation between disease duration and the pons area in MJD/SCA3 pa-tients9. Nevertheless, one study failed to demonstrate a progression of midbrain and pontine tegmentum atrophy by aging or disease duration19. his study also corrobo-rate with another one that describe a diferential vulner-ability in pontine structures: pontine tegmentum atrophy begins from the early stage of the disease and pontine base progressed negatively in correlation with disease duration9. In a more recent study, however, volumetry correlated (p<0.10) with total brainstem, midbrain and putamen20, showing a diversity of indings in disease du-ration and atrophy in MJD/SCA3.
CAG number
We identiied correlation among V1, midbrain and total vermis, with the number of CAG expansion. One study failed to demonstrate a correlation between CAG and brainstem or cerebellar volume13. hey have sug-gested that the mutation per se, was responsible for at-rophy and not the CAG number. One study showed a weak correlation between CAG number and midbrain, total brainstem, caudate nucleus and putamen20. Based on previous studies21-23 some authors, showed correla-tion between CAG and volume of tegmentum of pons divided by age9. We weren’t able to ind such correlation.
Age
Age and sex are the signiicant variables in volume measurement. Age had separate inverse correlation with all cerebellar structures and each of those of cerebellum, the cerebellar vermis being the most afected. According to some authors, brain stem structures remain unal-tered regardless of disease duration21. Dorsum-medial areas (declive, folim and tuber-V2) and posterior lobe (pyramid, tonsil and nodule-V3) showed shrinking with age18. It has been suggested that more recent phyloge-netic areas, with several cortical extensions, are also sus-ceptible to the aging efect22. To diminish bias, patients Table 2. Correlations between volume structures and several
parameters related to disease.
Parameter Structure Sperman p value
Disease duration L hemisphere –0.7 0.04 Total cerebellum –0.7 0.04
V2 –0.69 0.005
R hemisphere –0.56 0.02 Mesencephalon –0.52 0.044 CAG number Total Vermis –0.7 0.04
V1 –0.69 0.004
Mesencephalon –0.53 0.042 Age Total vermis –0.78 0.01
L hemisphere –0.73 0.002 R hemisphere –0.71 0.003 Total cerebellum –0.71 0.03
V1 –0.68 0.004
V3 –0.68 0.05
V2 –0.58 0.022
ICARS Pons –0.68 0.01
L hemisphere –0.63 0.02 Total brain stem –0.62 0.01 Total cerebellum –0.6 0.02 R hemisphere –0.49 0.03
V2 –0.52 0.05
and controls were paired for age and sex. Structure vol-umes of controls didn’t correlate with age. Such find-ings suggest that the neurodegenerative process in MJD/ SCA3 is also inluenced by the patient age8.
ICARS
here was positive correlation between disease du-ration and ICARS, suggesting the progressive char-acter of the disease. Pons, V2, total brain stem, hemi-spheres and total cerebellum correlated with ICARS. ICARS seems to be a valuable clinical parameter since it has been demonstrated a relevant inverse correla-tion between this scale and cerebellar atrophy24. An in-verse correlation was found between ICARS and spinal cord area in MJD/SCA3 patients although with no sta-tistical signiicance25. A previous study showed correla-tion among brainstem and cerebellar volumes and a clin-ical scale in SCA1 patients26. hey also demonstrated a correlation between the volume of cerebellum and the duration of the disease in SCA1 and SCA2 patients. A more recent published study showed an inverse correla-tion between another clinical scale (Scale for the Assess-ment and Rating of Ataxia, SARA) and total brainstem and all substructures, caudate nucleus, total cerebellum and hemispheres. To our knowledge, there are only a few studies concerning volume measurements in SCAs and clinical data (specially with ICARS), while none have been conducted on MJD.
However, another study failed to demonstrate a cor-relation between pons volume and severity of illness and time of disease in SCA7 patients14. Conversely, they dem-onstrated a cerebellar correlation with both disease du-ration and severity of illness in SCA7 patients.
V2, hemispheres and total cerebellum volume also correlated with three variables: disease duration, disease severity (ICARS) and age. hese correlations have never previously been demonstrated, and suggest these vari-ables might play an important role in the disease process.
In conclusion, the most affected structure in this group of MJD/SCA3 patients was the pons, followed by cerebellar vermis and cerebellar hemispheres. Vermis and total cerebellum were the most sensitive structure related to age while brain stem and pons strongly cor-related with disease severity (ICARS). Cerebellum and brain stem atrophy volumes measurement could be useful as a index in detecting neuronal vulnerability pat-terns in this disease, what may be useful in to indentify the progression of the disease and also as a parameter to be considered in future trials in MJD/SCA3.
REFERENCES
1. Silveira I, Coutinho P, Maciel P, et al. Analysis of SCA1, DRPLA, MJD, SCA2, and SCA6 CAG repeats in 48 Portuguese ataxia families. Am J Med Genet 1998;81:134-138.
2. Silveira I, Lopes-Cendes I, Kish S, et al. Frequency of spinocerebellar ataxia type 1, dentatorubropallidoluysian atrophy, and Machado-Joseph disease mutations in a large group of spinocerebellar ataxia patients. Neurology 1996;46:214-218.
3. Sasaki H, Yabe I, Tashiro K. The hereditary spinocerebellar ataxias in Japan. Cytogenet Genome Res 2003;100:198-205.
4. Giunti P, Sabbadini G, Sweeney MG, et al. The role of the SCA2 trinucleotide repeat expansion in 89 autosomal dominant cerebellar ataxia families: fre-quency, clinical and genetic correlates. Brain 1998;121:459-467. 5. Soong BW, Lu YC, Choo KB, Lee HY. Frequency analysis of autosomal
dominant cerebellar ataxias in Taiwanese patients and clinical and molec-ular characterization of spinocerebellar ataxia type 6. Arch Neurol 2001;58: 1105-1109.
6. Kawaguchi Y, Okamoto T, Taniwaki M, et al. CAG expansions in a novel gene for Machado-Joseph disease at chromosome 14q32.1. Nat Genet 1994;8:221-228.
7. Nakano KK, Dawson DM, Spence A. Machado disease: a hereditary ataxia in Portuguese emigrants to Massachusetts. Neurology 1972;22:49-55. 8. Onodera O, Idezuka J, Igarashi S, et al. Progressive atrophy of cerebellum
and brainstem as a function of age and the size of the expanded CAG re-peats in the MJD1 gene in Machado-Joseph disease. Ann Neurol 1998;43: 288-296.
9. Yoshizawa, T, Watanabe M, Frusho K, Shoji S. Magnetic resonance imaging demonstrates differential atrophy of pontine base and tegmentum in Machado-Joseph disease. J Neurol Sci 2003;215:45– 50.
10. Lopes-Cendes I, Silveira I, Maciel P, et al. Limits of clinical assessment in the accurate diagnosis of Machado-Joseph disease. Arch Neurol 1996;53: 1168-1174.
11. Burk K, Abele M, Fetter M, et al. Autosomal dominant cerebellar ataxia type I clinical features and MRI in families with SCA1, SCA2 and SCA3. Brain 1996; 119:1497-1505.
12. Murata Y, Yamaguchi S, Kawakami H, et al. Characteristic magnetic res-onance imaging findings in Machado-Joseph disease. Arch Neurol 1998;55:33-37.
13. Klockgether T, Skalej M, Wedekind D, et al. Autosomal dominant cerebellar ataxia type I: MRI-based volumetry of posterior fossa structures and basal ganglia in spinocerebellar ataxia types 1, 2 and 3. Brain 1998;121:1687-1693. 14. Bang OY, Lee PH, Kim SY, Kim HJ, Huh K. Pontine atrophy precedes
cerebellar degeneration in spinocerebellar ataxia 7: MRI-based volumetric analysis. J Neurol Neurosurg Psychiatry 2004;75:1452-1456.
15. Trouillas P, Takayanagi T, Hallett M, et al. International Cooperative Ataxia Rating Scale for pharmacological assessment of the cerebellar syndrome: The Ataxia Neuropharmacology Committee of the World Federation of Neurology. J Neurol Sci 1997;145:205-211.
16. Luft AR, Skalej M, Welte D, et al. A new semiautomated, three-dimensional technique allowing precise quantiication of total and regional cerebellar volume using MRI. Magn Resonan Med 1998;40:143-151.
17. Eritaia J, Wood SJ, Stuart GW, et al. An optimized method for estimating in-tracranial volume from magnetic resonance images. Magn Resonan Med 2000; 44:973-977.
18. Raz N, Dupuis JH, Briggs SD, McGavran C, Acker JD. Diferential efects of age and sex on the cerebellar hemispheres and the vermis: a prospective MR study. AJNR Am J Neuroradiol 1998;19:65-71.
19. Horimoto Y, Matsumoto M, Yuasa H, et al. Brainstem in Machado-Joseph disease: atrophy or small size? Eur J Neurol 2008;15:102-105.
20. Schulz JB, Borkert J, Wolf S, et al. Visualization, quantiication and correla-tion of brain atrophy with clinical symptoms in spinocerebellar ataxia types 1, 3 and 6. Neuroimage 2010;49:158-168.
21. Luft AR, Skalej M, Schulz JB, et al. Patterns of age-related shrinkage in cer-ebellum and brainstem observed in vivo using three-dimensional MRI vol-umetry. Cereb Cortex 1999;9:712-721.
22. Raz N, Torres IJ, Spencer WD, White K, Acker JD. Age-related regional difer-ences in cerebellar vermis observed in vivo. Arch Neurol 1992;49:412-416. 23. Abe Y, Tanaka F, Matsumoto M, et al. CAG repeat number correlates with
the rate of brainstem and cerebellar atrophy in Machado-Joseph disease. Neurology 1998;51:882-884.
24. Richter S, Dimitrova A, Maschke M, et al. Degree of cerebellar ataxia cor-relates with three-dimensional mri-based cerebellar volume in pure cere-bellar degeneration. Eur Neurol 2005;54:23-27.
25. Lukas C, Hahn HK, Bellenberg B, et al. Spinal cord atrophy in spinocere-bellar ataxia type 3 and 6: impact on clinical disability. J Neurol 2008;255: 1244-1249.