Phylogeographic Analyses of Submesophotic Snappers
Etelis coruscans
and
Etelis ‘‘marshi’’
(Family Lutjanidae)
Reveal Concordant Genetic Structure across the
Hawaiian Archipelago
Kimberly R. Andrews1,2*, Virginia N. Moriwake1,3, Christie Wilcox1,4, E. Gordon Grau1, Christopher Kelley1,5, Richard L. Pyle6, Brian W. Bowen1
1Hawai’i Institute of Marine Biology, University of Hawai’i, Kane’ohe, Hawaii, United States of America,2School of Biological & Biomedical Sciences, Durham University, South Road, United Kingdom,3Department of Oceanography, University of Hawai’i, Honolulu, Hawaii, United States of America,4Cell and Molecular Biology Graduate Program, University of Hawai’i, Honolulu, Hawaii, United States of America,5Hawai’i Undersea Research Lab, University of Hawai’i, Honolulu, Hawaii, United States of America,6Bernice P. Bishop Museum, Honolulu, Hawaii, United States of America
Abstract
The Hawaiian Archipelago has become a natural laboratory for understanding genetic connectivity in marine organisms as a result of the large number of population genetics studies that have been conducted across this island chain for a wide taxonomic range of organisms. However, population genetic studies have been conducted for only two species occurring in the mesophotic or submesophotic zones (30+m) in this archipelago. To gain a greater understanding of genetic connectivity in these deepwater habitats, we investigated the genetic structure of two submesophotic fish species (occurring,200–360 m) in this archipelago. We surveyed 16 locations across the archipelago for submesophotic snappers Etelis coruscans(N = 787) andE. ‘‘marshi’’(formerlyE. carbunculus; N = 770) with 436–490 bp of mtDNA cytochromeband 10–11 microsatellite loci. Phylogeographic analyses reveal no geographic structuring of mtDNA lineages and recent coalescence times that are typical of shallow reef fauna. Population genetic analyses reveal no overall structure across most of the archipelago, a pattern also typical of dispersive shallow fishes. However some sites in the mid-archipelago (Raita Bank to French Frigate Shoals) had significant population differentiation. This pattern of no structure between ends of the Hawaiian range, and significant structure in the middle, was previously observed in a submesophotic snapper (Pristipomoides filamentosus) and a submesophotic grouper (Hyporthodus quernus). Three of these four species also have elevated genetic diversity in the mid-archipelago. Biophysical larval dispersal models from previous studies indicate that this elevated diversity may result from larval supplement from Johnston Atoll,,800 km southwest of Hawaii. In this case the boundaries of stocks for fishery management cannot be defined simply in terms of geography, and fishery management in Hawaii may need to incorporate external larval supply into management plans.
Citation:Andrews KR, Moriwake VN, Wilcox C, Grau EG, Kelley C, et al. (2014) Phylogeographic Analyses of Submesophotic SnappersEtelis coruscansandEtelis ‘‘marshi’’(Family Lutjanidae) Reveal Concordant Genetic Structure across the Hawaiian Archipelago. PLoS ONE 9(4): e91665. doi:10.1371/journal.pone.0091665
Editor:Neil John Gemmell, University of Otago, New Zealand
ReceivedMarch 20, 2013;AcceptedFebruary 13, 2014;PublishedApril 10, 2014
Copyright:ß2014 Andrews et al. This is an open-access article distributed under the terms of the Creative Commons Attribution License, which permits unrestricted use, distribution, and reproduction in any medium, provided the original author and source are credited.
Funding:This paper is funded in part by a grant/cooperative agreement from the National Oceanic and Atmospheric Administration, Project R/FM-18, which is sponsored by the University of Hawaii Sea Grant College Program, SOEST, under Institutional Grant No. NA05OAR4171048 (B.W.B) from NOAA Office of Sea Grant, Department of Commerce. This paper is also funded in part by generous support from the Seaver Institute (B.W.B. and R.L.P.), NOAA Pacific Island Fisheries Science Center (http://www.pifsc.noaa.gov/) Grant NA10NMF4520121, NOAA National Centers for Coastal Ocean Science Coral Reef Ecosystem Studies Grant (http://ccma.nos.noaa.gov/ecosystems/coralreef/coral_grant.aspx) NA07NOS4780188 (R.L.P.), NOAA National Marine Sanctuaries Program (http://sanctuaries. noaa.gov/) MOA grant No. 2005-008/66882 (R.J. Toonen), National Science Foundation (http://www.nsf.gov/) grants No. OIA0554657, and OCE-0929031 (B.W.B.), NOAA Coral Reef Conservation Program and Hawai’i Undersea Research Laboratory (http://www.soest.hawaii.edu/HURL/) Grant NA05OAR4301108, Western Pacific Regional Fisheries Management Council (http://www.wpcouncil.org/; contract No. 05-WPC-033), and Hawai’i Division of Aquatic Resources (http://hawaii. gov/dlnr/dar/). The views expressed herein are those of the author(s) and do not necessarily reflect the views of NOAA or any of its subagencies. UNIHI-SEAGRANT-JC-05-53. The funders had no role in study design, data collection and analysis, decision to publish, or preparation of the manuscript.
Competing Interests:The authors have declared that no competing interests exist. * E-mail: kimandrews@gmail.com
Introduction
Understanding the genetic connectivity of marine populations can provide valuable information about evolutionary mechanisms in the marine environment, as well as effective management and conservation strategies. The Hawaiian Archipelago has become a natural laboratory for understanding genetic connectivity of marine organisms, including more than 30 marine species across a wide taxonomic range (reviewed in [1]). A comparison of these
species reveals at least four geographically concordant population genetic barriers, providing evidence for some commonality in population genetic structure despite the wide variety of life history characters across species. However, underlying this pattern is high variability in population structure among species, with no one species demonstrating all four of these barriers, some dispersive species showing no barriers, and many species having additional barriers. Furthermore, species with similar life history characters often do not share the same genetic barriers, indicating that any
single species cannot be used as an exemplar for dispersal in the Hawaiian Archipelago.
The population genetic studies conducted thus far in the Hawaiian Archipelago have included only two species which occur at the lower margin of photosynthetic activity in the mesophotic and submesophotic zones, the Hawaiian Grouper, called ‘‘Hap-u’upu’u’’ in Hawai’i (Hyporthodus quernus, previously Epinephelus quernus) [2,3] and the Crimson Jobfish, called ‘‘Opakapaka’’ in Hawai’i (Pristipomoides filamentosus) [4]. These studies found interesting patterns of genetic structure: both species showed evidence of high connectivity across the Hawaiian Archipelago, but both species also showed evidence for weak but significant genetic divergence at several sites in the middle of the archipelago. The Hawaiian grouper also had elevated genetic diversity at a mitochondrial DNA (mtDNA) marker in the mid-archipelago. Bio-physical simulations of larval dispersal indicated that this genetic distinctiveness of the mid-archipelago may result from connectivity between the mid-archipelago and Johnston Atoll, the closest landmass to the Hawaiian Archipelago (Figure 1) [3,5]. These simulations also indicated that directional dispersal from the outer edges of the archipelago toward the mid-archipelago may contribute to the elevated mtDNA diversity [3].
The pattern of genetic structure and high genetic diversity in the mid-archipelago has not been observed in other fish species studied in Hawai’i thus far. These studies include 15 shallow-water reef fish species, most of which exhibit high connectivity across most or all of the archipelago, with the exception of one damselfish (Dascyllus albisella) that shows strong genetic divergence among all islands sampled across the archipelago, and one surgeonfish (Zebrasoma flavescens) that shows low genetic structure [6–13]. The
pattern of genetic structure and high diversity in the mid-archipelago has not been observed for invertebrate species either (e.g. [14,15]).
To test the hypothesis that the pattern of genetic structure and high diversity in the mid-archipelago is consistent for other deepwater fishes, we conducted population genetic analyses of two submesophotic fishes which occur across the archipelago: the Flame Snapper, called ‘‘Onaga’’ in Hawai’i (Etelis coruscans) and the Ruby Snapper, called ‘‘Ehu’’ in Hawai’i (Etelis ‘‘marshi’’, currently being revised from Etelis carbunculus, Andrews et al. in prep). Adult E. coruscans and E. marshi typically occur at deeper depths (200–320 m forE. coruscans; 200–360 m forE. marshi) than adultP. filamentosusandH. quernus(80–240 m forP. filamentosus, and 120–280 m forH. quernus; but adult H. quernusoccur at,10 m depth in the far northwestern atolls of the Hawaiian Archipelago) [16–18]. However, juveniles of these species are sometimes found at shallower, mesophotic depths [16,19,20].
The adult habitat of all four of these species is similar in that it consists of hard substrate with high structural complexity and/or high relief [21]. Despite their similar habitat, however, these species have different habitat use, and these differences may influence adult dispersal and genetic connectivity. AdultE. marshi and H. quernus are more closely associated with the bottom substrate including crevasses and under ledges (C.K. pers. obs., [16]) and therefore may exhibit greater genetic structure than other species due to lower dispersal by juveniles and adults. The close association with the bottom for these species may be due to partitioning of feeding niches between benthos and water column, a greater need for protection due to small adult size (E. marshi), or a suspected territorial, haremic social structure (H. quernus). In contrast, E. coruscansand P. filamentosus are more pelagic feeders that usually occur 2–50 meters above the bottom.
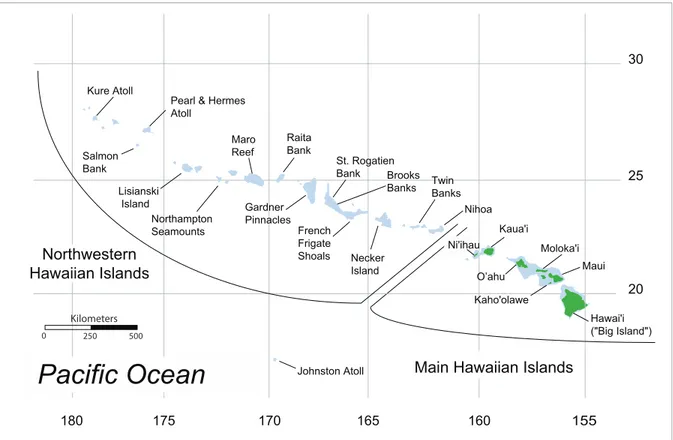
Figure 1. Map of the Hawaiian Archipelago and Johnston Atoll showing sampling locations and geographic division between the Northwestern Hawaiian Islands and the Main Hawaiian Islands.
doi:10.1371/journal.pone.0091665.g001
Phylogeography of Hawaiian Submesophotic Snappers
To investigate the population genetic structure ofE. coruscans andE. marshi, we used mtDNA cytochromeb(cytb) sequences and 10–11 microsatellite loci from 16 sample sites across the archipelago (Figure 1, Table 1, Table 2). Our study was initially motivated by fishery management concerns for these popular food fishes subject to commercial and recreational catches. However, our study is also one of the first to examine the population genetic structure of a submesophotic species, and thus we aimed to explore the influence of this unique habitat on the evolution of fishes compared to shallow-water habitats. For example, deepwater habitat occupied by submesophotic fishes may have lower water movement than shallow habitat due to the lack of Ekman surface transport and waves, which could result in less dispersive larvae and stronger genetic structure. We tested this hypothesis through qualitative comparisons of the population genetic structure ofE. coruscans and E. marshi with the population genetic structure reported in previous studies for two other submesophotic fishes (P. filamentosus and H. quernus) and shallow-water fishes in the Hawaiian Archipelago. Additionally, submesophotic habitats may lie below the zone disrupted by sea level changes during glaciations, and thus communities in this deepwater habitat may be older and more stable than their shallow counterparts. We tested this hypothesis by estimating mtDNA coalescent times forE. coruscansandE. marshi, and comparing these values with previously published mtDNA coalescent times from shallow-water fishes.
Methods
Specimens consisted of fin or muscle tissue collected throughout the Hawaiian Archipelago from 16 locations each forE. coruscans (N = 787) (Table 1, Figure 1) and E. marshi(N = 770) (Table 2, Figure 1). Specimens were collected by commercial fishers who recorded GPS coordinates for each sampling location and stored the specimens frozen or in salt-saturated DMSO buffer [22]. Most fishing activity for these species takes place at a depth of 200– 300 m, with distances from shore ranging from a few hundred meters to as far as 65 km. Specimens were collected in 1997–1998 or 2003–2007 (Table 1, Table 2). Genomic DNA was extracted using a phenol chloroform method [23], DNeasy extraction kits (Qiagen, Valencia, CA, USA), or the Hotshot method [24].
MtDNA sequencing
PCRs amplified portions of mtDNA cytochromebgene for both species. Primers used for E. coruscans were Cyb-05 L15020 (GCCAACGGCGCATCCTTCTTCTT [25]) and Cyb-07 H15573 (AATAGGAAGTATCATTCGGGTTTGATG [26]), amplifying approximately 560 bp. Primers used forE. marshiwere designed for this study: EhucybF (TCAGTCGCACACATCTG-CCG) and EhucybR (AGTGCAACAAGGACGGCTGC) and amplified 524 bp. PCRs were performed in 15ml volumes
containing 16 MangoMix (Bioline, Taunton MA, USA) and 0.2mM each primer. For E. coruscans, cycle conditions were as follows: 94uC for 1 min; 35 cycles of 94uC for 30 sec, annealing temperature 55uC for 45 sec; and 72uC for 30 sec; and a final 72uC extension for 10 min. Cycle conditions forE. marshiwere the same with the exception of the annealing temperature step, which was 68uC for 30 sec. To clean PCR products, 7.5 units of Exonuclease I and 0.75 units of FastAP alkaline phosphatase (Fermentas Life Sciences, Ontario, Canada) were added to 7.5ml of PCR product, and aliquots were incubated at 37uC for 60 minutes and 85uC for 15 minutes. PCR products were then sequenced in one direction with an ABI3730 automated sequencer (Applied Biosystems, Foster City, CA). Questionable or low quality sequences were resequenced in the forward direction. Sequences
were edited and aligned using GENEIOUS PRO 5.6.2 (Biomat-ters, LTD, Auckland, NZ).
Microsatellite genotyping
A total of 16 variable microsatellite loci were developed using genomic DNA extracted fromE. coruscansandE. marshithrough a procedure including restriction enzyme digestion, microsatellite enrichment, cloning of DNA fragments, and DNA sequencing of clones (sensu[27]) (Table 3). Five of these loci were PCR-amplified for both species. An additional five loci were amplified for E. coruscans, resulting in a total of 10 loci for this species; and an additional six loci were amplified forE. marshi, resulting in a total of 11 loci for this species (Table 3). Multiplex PCRs were carried out using fluorescent dye-labeled forward primers and Qiagen Type-It Microsatellite PCR Kits, with three or four loci included per multiplex reaction, and following reaction conditions recom-mended by Qiagen. PCR products were separated on ABI 3730XL or ABI 3130XL genetic analyzers, with all PCR products from each primer set run exclusively on only one of these two analyzers to avoid bias in fragment size assignments. Fragment sizes were scored using GENEMAPPER 4.0 (Applied Biosystems). MSTOOLS 3.1 [28] was used to identify identical genotypes to confirm that no individual fish specimens were present more than once in the dataset. Each microsatellite locus was tested for departures from Hardy Weinberg equilibrium and linkage equilibrium using ARLEQUIN 3.11 [29]. Each locus was also tested for null alleles using MICRO-CHECKER 2.2.0.3 [30]. Null allele frequencies were estimated using FREENA [31].
Genetic Diversity and Population Structure
For the mtDNA, nucleotide (p) and haplotype (h) diversities
were obtained with ARLEQUIN. The nucleotide substitution models used to calculate genetic distance were Tamura Nei+ gamma = 0.403 [32] forE. coruscansand Tamura Nei forE. marshi; these were the best-fit models chosen using the AIC method in jModeltest 0.1.1 [33]. For microsatellites, observed heterozygosity, expected heterozygosity, allele richness, and total number of alleles were calculated for each locus using FSTAT 2.9.3.2 [34] and ARLEQUIN.
For mtDNA, genetic similarity between geographic locations was investigated with median-joining haplotype networks for both E. coruscansand E. marshi using NETWORK 4.6.1.0 [35]. The maximum parsimony (MP) option was used to remove unneces-sary median vectors and links [35].
Genetic similarity between geographic locations was further investigated by calculating population pairwise WST values for
mtDNA and FST for microsatellites with ARLEQUIN. For
mtDNA analyses, genetic distance was calculated using nucleotide substitution models as described above. For both genetic assays, significance of pairwise values was tested using 20,000 permuta-tions. For microsatellites, the influence of each individual locus on multi-locus pairwiseFSTvalues was investigated by removing one
locus at a time; and the influence of null alleles onFSTanalyses
was investigated by estimating globalFSTvalues with and without
correcting for null alleles using the ENA method as implemented in FREENA [31].
To investigate the influence of temporal sampling on the estimation of allele frequencies and inference of genetic structure, we conducted pairwiseFSTanalyses comparing samples collected
more than three years apart within a given geographic location. These analyses were conducted for any geographic sample location containing more than 10 individuals each per temporal period (i.e. Lisianski and O’ahu forE. coruscans; and Northampton, Necker, and Ni’ihau forE. marshi).
Phylogeography of Hawaiian Submesophotic Snappers
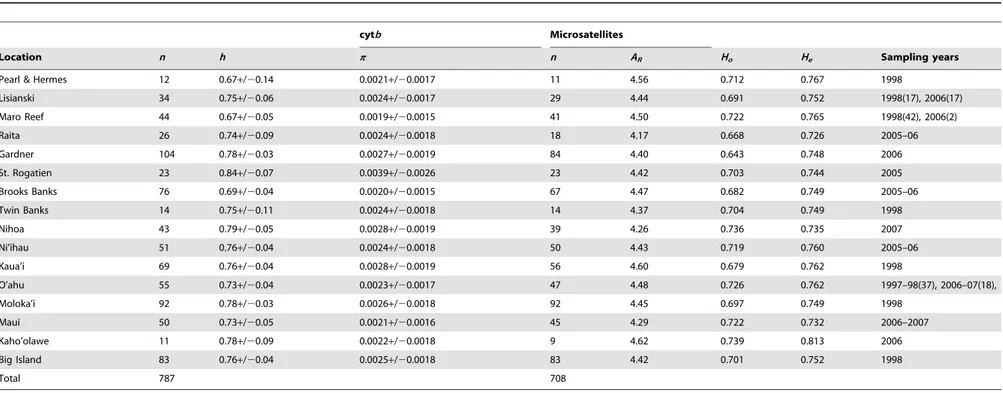
Table 1.Sample sizes, diversity indices, and sampling years for mtDNA cytochrome b (cytb) and microsatellite loci across sample sites in the Hawaiian Archipelago forEtelis coruscans.h, haplotype diversity;p, nucleotide diversity;ARallele richness;Ho, observed heterozygosity;He, expected heterozygosity.
cytb Microsatellites
Location n h p n AR Ho He Sampling years
Pearl & Hermes 12 0.67+/20.14 0.0021+/20.0017 11 4.56 0.712 0.767 1998
Lisianski 34 0.75+/20.06 0.0024+/20.0017 29 4.44 0.691 0.752 1998(17), 2006(17)
Maro Reef 44 0.67+/20.05 0.0019+/20.0015 41 4.50 0.722 0.765 1998(42), 2006(2)
Raita 26 0.74+/20.09 0.0024+/20.0018 18 4.17 0.668 0.726 2005–06
Gardner 104 0.78+/20.03 0.0027+/20.0019 84 4.40 0.643 0.748 2006
St. Rogatien 23 0.84+/20.07 0.0039+/20.0026 23 4.42 0.703 0.744 2005
Brooks Banks 76 0.69+/20.04 0.0020+/20.0015 67 4.47 0.682 0.749 2005–06
Twin Banks 14 0.75+/20.11 0.0024+/20.0018 14 4.37 0.704 0.749 1998
Nihoa 43 0.79+/20.05 0.0028+/20.0019 39 4.26 0.736 0.735 2007
Ni’ihau 51 0.76+/20.04 0.0024+/20.0018 50 4.43 0.719 0.760 2005–06
Kaua’i 69 0.76+/20.04 0.0028+/20.0019 56 4.60 0.679 0.762 1998
O’ahu 55 0.73+/20.04 0.0023+/20.0017 47 4.48 0.726 0.762 1997–98(37), 2006–07(18),
Moloka’i 92 0.78+/20.03 0.0026+/20.0018 92 4.45 0.697 0.749 1998
Maui 50 0.73+/20.05 0.0021+/20.0016 45 4.29 0.722 0.732 2006–2007
Kaho’olawe 11 0.78+/20.09 0.0022+/20.0018 9 4.62 0.739 0.813 2006
Big Island 83 0.76+/20.04 0.0025+/20.0018 83 4.42 0.701 0.752 1998
Total 787 708
For geographic locations with sampling intervals.1 year apart, the number of specimens sampled per interval is given in parentheses.
doi:10.1371/journal.pone.0091665.t001 Phylog
eography
of
Hawaiian
Submesophot
ic
Snappers
PLOS
ONE
|
www.ploson
e.org
4
April
2014
|
Volume
9
|
Issue
4
|
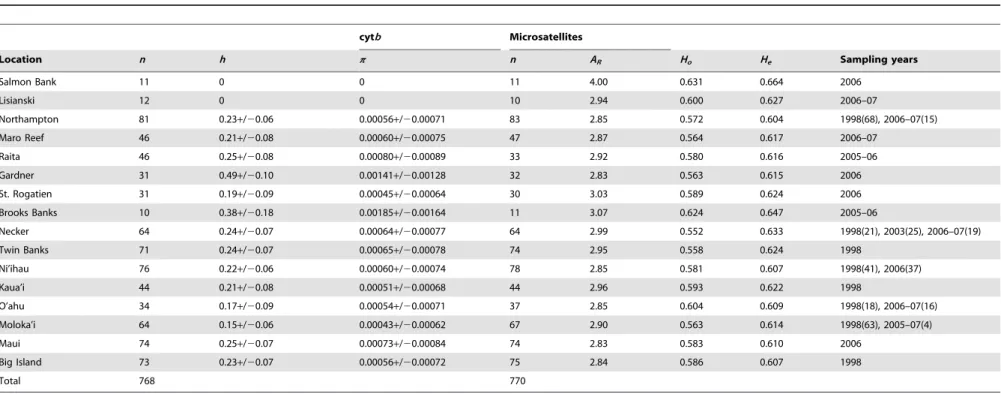
Table 2.Sample sizes, diversity indices, and sampling years for mtDNA cytochrome b (cytb) and microsatellite loci across sample sites in the Hawaiian Archipelago forEtelis marshi.h, haplotype diversity;p, nucleotide diversity;ARallele richness;Ho, observed heterozygosity;He, expected heterozygosity.
cytb Microsatellites
Location n h p n AR Ho He Sampling years
Salmon Bank 11 0 0 11 4.00 0.631 0.664 2006
Lisianski 12 0 0 10 2.94 0.600 0.627 2006–07
Northampton 81 0.23+/20.06 0.00056+/20.00071 83 2.85 0.572 0.604 1998(68), 2006–07(15)
Maro Reef 46 0.21+/20.08 0.00060+/20.00075 47 2.87 0.564 0.617 2006–07
Raita 46 0.25+/20.08 0.00080+/20.00089 33 2.92 0.580 0.616 2005–06
Gardner 31 0.49+/20.10 0.00141+/20.00128 32 2.83 0.563 0.615 2006
St. Rogatien 31 0.19+/20.09 0.00045+/20.00064 30 3.03 0.589 0.624 2006
Brooks Banks 10 0.38+/20.18 0.00185+/20.00164 11 3.07 0.624 0.647 2005–06
Necker 64 0.24+/20.07 0.00064+/20.00077 64 2.99 0.552 0.633 1998(21), 2003(25), 2006–07(19)
Twin Banks 71 0.24+/20.07 0.00065+/20.00078 74 2.95 0.558 0.624 1998
Ni’ihau 76 0.22+/20.06 0.00060+/20.00074 78 2.85 0.581 0.607 1998(41), 2006(37)
Kaua’i 44 0.21+/20.08 0.00051+/20.00068 44 2.96 0.593 0.622 1998
O’ahu 34 0.17+/20.09 0.00054+/20.00071 37 2.85 0.604 0.609 1998(18), 2006–07(16)
Moloka’i 64 0.15+/20.06 0.00043+/20.00062 67 2.90 0.563 0.614 1998(63), 2005–07(4)
Maui 74 0.25+/20.07 0.00073+/20.00084 74 2.83 0.583 0.610 2006
Big Island 73 0.23+/20.07 0.00056+/20.00072 75 2.84 0.586 0.607 1998
Total 768 770
For geographic locations with sampling intervals.1 year apart, the number of specimens sampled per interval is given in parentheses.
doi:10.1371/journal.pone.0091665.t002 Phylog
eography
of
Hawaiian
Submesophot
ic
Snappers
PLOS
ONE
|
www.ploson
e.org
5
April
2014
|
Volume
9
|
Issue
4
|
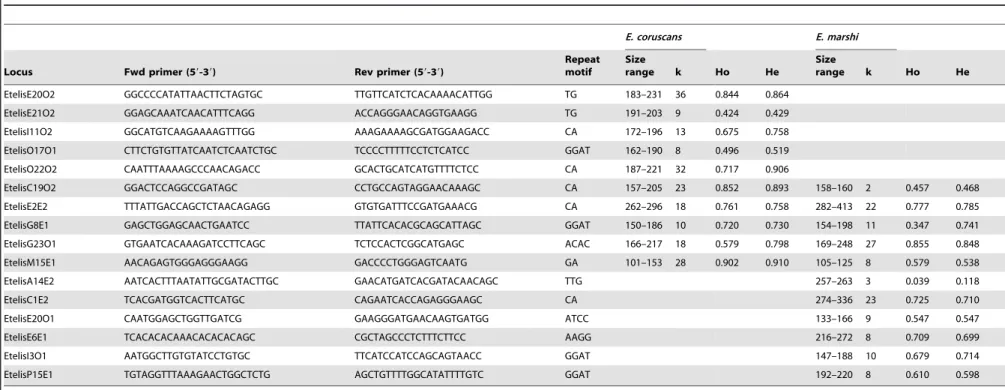
Table 3.Characteristics of 16 microsatellite loci developed forEtelis coruscansandEtelis marshi, including number of alleles (k), observed heterozygosity (Ho), and expected
heterozygosity (He) across the Hawaiian Archipelago for each locus.
E. coruscans E. marshi
Locus Fwd primer (59-39) Rev primer (59-39)
Repeat motif
Size
range k Ho He
Size
range k Ho He
EtelisE20O2 GGCCCCATATTAACTTCTAGTGC TTGTTCATCTCACAAAACATTGG TG 183–231 36 0.844 0.864
EtelisE21O2 GGAGCAAATCAACATTTCAGG ACCAGGGAACAGGTGAAGG TG 191–203 9 0.424 0.429
EtelisI11O2 GGCATGTCAAGAAAAGTTTGG AAAGAAAAGCGATGGAAGACC CA 172–196 13 0.675 0.758
EtelisO17O1 CTTCTGTGTTATCAATCTCAATCTGC TCCCCTTTTTCCTCTCATCC GGAT 162–190 8 0.496 0.519
EtelisO22O2 CAATTTAAAAGCCCAACAGACC GCACTGCATCATGTTTTCTCC CA 187–221 32 0.717 0.906
EtelisC19O2 GGACTCCAGGCCGATAGC CCTGCCAGTAGGAACAAAGC CA 157–205 23 0.852 0.893 158–160 2 0.457 0.468
EtelisE2E2 TTTATTGACCAGCTCTAACAGAGG GTGTGATTTCCGATGAAACG CA 262–296 18 0.761 0.758 282–413 22 0.777 0.785
EtelisG8E1 GAGCTGGAGCAACTGAATCC TTATTCACACGCAGCATTAGC GGAT 150–186 10 0.720 0.730 154–198 11 0.347 0.741
EtelisG23O1 GTGAATCACAAAGATCCTTCAGC TCTCCACTCGGCATGAGC ACAC 166–217 18 0.579 0.798 169–248 27 0.855 0.848
EtelisM15E1 AACAGAGTGGGAGGGAAGG GACCCCTGGGAGTCAATG GA 101–153 28 0.902 0.910 105–125 8 0.579 0.538
EtelisA14E2 AATCACTTTAATATTGCGATACTTGC GAACATGATCACGATACAACAGC TTG 257–263 3 0.039 0.118
EtelisC1E2 TCACGATGGTCACTTCATGC CAGAATCACCAGAGGGAAGC CA 274–336 23 0.725 0.710
EtelisE20O1 CAATGGAGCTGGTTGATCG GAAGGGATGAACAAGTGATGG ATCC 133–166 9 0.547 0.547
EtelisE6E1 TCACACACAAACACACACAGC CGCTAGCCCTCTTTCTTCC AAGG 216–272 8 0.709 0.699
EtelisI3O1 AATGGCTTGTGTATCCTGTGC TTCATCCATCCAGCAGTAACC GGAT 147–188 10 0.679 0.714
EtelisP15E1 TGTAGGTTTAAAGAACTGGCTCTG AGCTGTTTTGGCATATTTTGTC GGAT 192–220 8 0.610 0.598
doi:10.1371/journal.pone.0091665.t003
Phylog
eography
of
Hawaiian
Submesophot
ic
Snappers
PLOS
ONE
|
www.ploson
e.org
6
April
2014
|
Volume
9
|
Issue
4
|
Population genetic structure was further analyzed using Bayesian clustering analyses implemented in STRUCTURE 2.3.3 [36] for microsatellite loci, using the admixture and correlated allele frequency models. The burn-in length was set at 105steps, followed by 106steps. Analyses were run five times for each of K= 1 to K= 16 to test for consistency of estimates of P(X|K), where K is the number of clusters. Bayesian clustering analyses were conducted both with and without use of sampling location as a prior; using sampling location as a prior has been shown to recover population structure at lower levels of divergence, without bias towards assigning structure when it is not present [37].
Relationships between geographic distance and genetic diver-gence were investigated using GENEPOP 4.0.10 [38,39] for both mtDNA and microsatellite data. Mantel tests (10,000 permuta-tions) and Spearman Rank correlation tests were used to examine correlations between geographic distance vs. genetic divergence (WST/(12WST) [40]). Geographic distance was calculated as the
shortest great-circle distance between the approximate centers of sampling sites.
To resolve evolutionary histories, Tajima’sDand Fu’sFstests
[41] for departure from mutation-drift equilibrium were conduct-ed with ARLEQUIN using mtDNA cytb sequences. Large negative values of Tajima’sDand Fu’sFsare expected to occur
if populations have experienced selection or recent expansions [42–44]. For Tajima’sD, a significant positive value is expected if populations are admixed or experiencing diversifying selection. Fu’s Fs is expected to have greater power than Tajima’s D for
detecting population expansions [45]. To estimate the age, historic female effective size, and post-expansion female effective size of Hawaiian populations, a coalescence analysis was performed with ARLEQUIN, assuming a cytb rate of 2% per million years between lineages (1% within lineages) calibrated with other marine fishes [46,47] Generation time was estimated at 10 years based on available life history data: recent evidence indicates that femaleE. marshiin the Hawaiian Archipelago may mature at two years of age (E. DeMartini, pers. comm.), and the maximum age forE. coruscansandE. marshiin the Hawaiian Archipelago is estimated at 13 years [48] (although this may be an underestimate of the maximum age given thatE. carbunculusin the Indian Ocean have lifespans of at least 35 years [49]). Because both mutation rate and generation time are not validated forEtelisspecies, corresponding estimates of effective population size and population age should be interpreted with caution. However, they should suffice to provide first order approximations.
Results
Microsatellite allele fragment lengths and cytb GenBank Accession No.’s (KF920464 to KF920552) are reported for each individual specimen in Table S1 forE. coruscansand in Table S2 forE. marshi.
Identification of matching microsatellite and mtDNA genotypes indicated that twoE. marshispecimens were present twice in the dataset: one specimen was present twice in the Maro Reef sample, and the other present twice in the Necker sample. One of each duplicate was removed from the dataset for subsequent mtDNA and microsatellite analyses. NoE. coruscansspecimens were present more than once in the dataset.
Microsatellite quality control
ForE. coruscans, three loci showed evidence of deviation from HWE after Bonferroni correction, including locus EtelisO22O2 (seven geographic locations), EtelisG23O1 (four locations), and
EtelisC19O2 (one location). These loci also exhibited an excess of homozygotes at two or more locations (Etelis O22O2 – 11 locations, EtelisG23O1 – 11 locations, Etelis C19O2 – 2 locations), indicating that deviations from HWE may result from null alleles. Three additional loci exhibited evidence of homozy-gote excess at one or more locations: EtelisI11O2 (five locations), EtelisM15E1 (one location), and EtelisG8E1 (one location). FREENA indicated a relatively low frequency of null alleles across loci and populations (range: 0.00–0.25, mean: 0.03).
ForE. marshi, only one locus (EtelisG8E1) showed evidence of deviation from HWE after Bonferroni correction; this locus deviated from HWE at 12 geographic locations. This locus also exhibited an excess of homozygotes at 11 locations, indicating that null alleles may be responsible for deviations from HWE. Two additional loci exhibited evidence for homozygote excess: EtelisA14E2 (six locations) and EtelisE20O1 (one location). Loci which exhibited evidence for homozygote excess generally had higher null allele frequency estimates across populations (Ete-lisG8E1 range: 0.13–0.32, mean: 0.22; EtelisA14E2: 0.00–0.23, mean: 0.10; EtelisE20O1: 0.00–0.20, mean: 0.01) than other loci (0.00–0.18, mean: 0.01).
No loci showed evidence for linkage disequilibrium for eitherE. coruscansorE. marshiafter Bonferroni correction. GlobalFSTvalues
calculated with and without correcting for null alleles had overlapping 95% confidence intervals for both species. Addition-ally, removing one locus at a time had little impact on pairwiseFST
results for either species. For E. coruscans, average deviations between all pairwiseFSTvalues calculated using all loci versus all
except one locus ranged from 0.0021 (when removing EtelisE2E2) to 0.0059 (when removing EtelisE20O2). ForE. marshi, average deviations between all pairwiseFSTvalues calculated using all loci
versus all except one locus ranged from 0.0015 (when removing EtelisA14E2) to 0.0133 (when removing EtelisE6E1). For each species, the greatest deviations in averageFST occurred with the
removal of a locus that showed no evidence of null alleles. Below we report results from analyses using all loci.
Genetic diversity and population structure
Editing of cytb DNA sequence data resulted in a 490 bp fragment for E. coruscans and a 436 bp fragment for E. marshi. Diversity values (handp) were consistently higher forE. coruscans
than E.marshi.ForE. coruscans,hranged from 0.67 to 0.84 andp
ranged from 0.0019–0.0039 (Table 1), with the highest values for both h and p occurring at St. Rogatien in the middle of the
archipelago (Figure 1). ForE. marshi, two locations (Salmon Bank and Lisianski) had zero diversity (h=p= 0); however, this low diversity may be related to the small sample sizes at these locations (n= 11 andn= 12) (Table 2). ForE. marshiat all other geographic locations,hranged from 0.15 to 0.49 andpranged from 0.00043 to 0.00185 (Table 2), with the highest value for hoccurring at Gardner and for p occurring at Brooks Banks, and the second
highest value forpoccurring at Gardner. Higher diversity values
forE. coruscansthanE. marshi were not driven by the longer cytb fragment resolved for E. coruscans; when diversity values were calculated using only the region of overlap between cytbsequences for the two species (379 bp), E. coruscans still had consistently higher diversity values thanE. marshi, except at Gardner, where haplotype diversity was slightly higher for E. marshi (data not shown).
For microsatellites, observed heterozygosity across the Hawaiian Archipelago for E. coruscans ranged from 0.643 to 0.739, and expected heterozygosity ranged from 0.726 to 0.813 (Table 1). For E. marshi, observed heterozygosity ranged from 0.552 to 0.631, and expected heterozygosity ranged from 0.604 to 0.664 (Table 2).
Phylogeography of Hawaiian Submesophotic Snappers
For E. coruscans, NETWORK analyses resulted in multiple maximum parsimony networks, all of which were similar in structure, with one of these reported here (Figure 2a). For E. marshi, NETWORK analyses produced only one maximum parsimony network (Figure 2b). Networks for both species showed overall low genetic divergence between haplotypes, with no more than 5 mutations separating any two haplotypes. For both E. coruscans and E. marshi, haplotype networks revealed no obvious segregation of haplotypes by geographic location.
For E. coruscans, pairwise WST analyses for mtDNA revealed
significant divergence for 20 out of 120 pairwise comparisons, with all except one of these comparisons involving locations in the mid-archipelago (Raita through Brooks Banks) (Table 4). For microsatellite loci, only three pairwise FST comparisons revealed
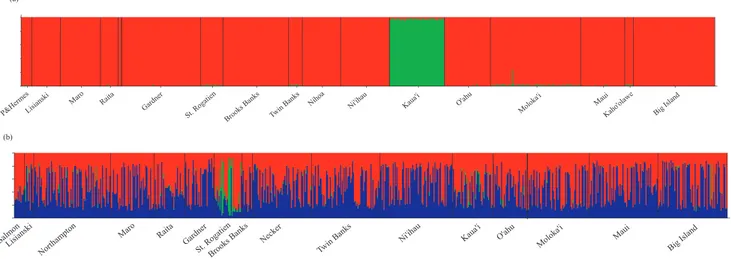
significant divergence (Maro Reef. vs. Molokai, Twin Banks vs. Molokai, and Nihoa vs. Kahoolawe) (Table 4). For Bayesian clustering analyses without using sampling location as a prior, average posterior probabilities were consistently highest atK= 1. When sampling location was used as a prior, average posterior probabilities were consistently highest at K= 3; however, visual inspection of the output from all runs ofK= 3 indicated only two consistent population clusters: (1) Kaua’i and (2) all other locations (Figure 3a).
For E. marshi, pairwise WST analyses for mtDNA revealed
significant divergence for 9 out of 120 pairwise comparisons, and each of these comparisons involved Gardner (adjacent to St. Rogatien) (Table 5). Pairwise FST comparisons for microsatellite
loci revealed significant divergence for 4 out of 120 pairwise comparisons, with all but one of these comparisons (Northampton vs. Niihau) involving a location in the mid-archipelago (Gardner or Raita) (Table 5). For Bayesian clustering analyses that did not use sampling location as a prior, average posterior probabilities were consistently highest at K= 1. When sampling location was used as a prior, average posterior probabilities were consistently highest atK= 2, and visual inspection of the output indicated two
consistent population clusters: (1) St. Rogatien in the middle of the archipelago, and (2) all other locations (Figure 3b).
For both species, analyses comparing samples collected during different time periods within a given geographic location resulted in no significant pairwiseWSTorFSTvalues for any location or any
genetic marker (P.0.05, data not shown), indicating that temporal sampling had little impact on the estimation of allele frequencies for those locations. For all other locations, all specimens were collected exclusively (or almost exclusively) from one time period (i.e. within three years of each other). The finding of little genetic structure across the archipelago for all markers across samples collected during different time periods suggests that temporal sampling had little impact on allele frequency estimates.
ForE. coruscans, genetic divergence was significantly correlated with geographic distance for both mtDNA (P= 0.044) and microsatellites (P= 0.042), although the correlation coefficient (r) was low for both marker types (mtDNAr= 0.126; microsatellites r= 0.171) (Figure 4). For E. marshi, genetic divergence was not significantly correlated with geographic distance for mtDNA (P= 1.000) or microsatellites (P= 0.833).
All values of Fu’s Fs and most values of Tajima’s D were
negative and significant (P,0.05) for all sites for both species; locations which did not have a significant Tajima’s D included Pearl & Hermes, Twin Banks, and Kaho’olawe for E. coruscans (Table 6), and Gardner for E. marshi (Table 7). Coalescence analyses of the mtDNA data provided estimates for age of Hawaiian populations ranging from 5,100 to 9,180 years forE. coruscans(Table 6); and ranging from 344,000 to 378,000 years for all locations for E. marshi except Gardner, which had an age estimate of 8,030 (Table 7). Initial female effective population sizes ranged from 0 to 35.9 forE. coruscansand were 0 at all sites forE. marshi; these low values indicate a very small population size prior to population expansion. ForE. coruscans, current female effective population sizes at all locations reached the maximum possible value in ARLEQUIN, which was 99,999 (reported in Table 6 as
‘); forE. marshi, current female effective population sizes ranged
Figure 2. Median-joining network of cytochrome b haplotypes for (a)Etelis coruscans and (b)Etelis marshi obtained from the program NETWORK 4.6.1.0 (Bandeltet al.1999).Each circle represents a haplotype; circle sizes are proportional to the frequency of haplotypes; and line lengths are proportional to the number of mutational steps between haplotype sequences.
doi:10.1371/journal.pone.0091665.g002
Phylogeography of Hawaiian Submesophotic Snappers
from 2,000 to 7,850 for all locations except Gardner, which had the maximum possible value in ARLEQUIN.
Discussion
Population genetic analyses across the Hawaiian Archipelago for the deepwater fishesE. coruscansandE. marshirevealed similar patterns of genetic structure, and this structure is concordant with the submesophotic fishes surveyed thus far in Hawai’i,H. quernus and P. filamentosus [2,3,27]. Each of these four species exhibited little or no genetic structure across the archipelago, with the exception of genetically divergent populations occurring in the center of the archipelago (e.g., Gardner, St. Rogatien, Brooks Banks, Necker). Additionally, the highest mtDNA diversity occurred at a location in the mid-archipelago for three of these four species (at Gardner and Brooks Banks forH. quernusandE. marshi; at St. Rogatien for E. coruscans).E. coruscanswas the only species with evidence of a genetically divergent population outside of the mid-archipelago (Kaua’i).
Coalescence analyses of mtDNA data indicate that the Hawaiian population of E. coruscans is much younger than sympatricE. marshi(,10,000 years vs.300,000 years; Table 6, Table 7). This may be due to a recent bottleneck inE. coruscans. A more intriguing possibility, that this species is a recent arrival to Hawaii, awaits testing with specimens from outside the archipel-ago. Current female effective population sizes for E. coruscans reached the maximum value in ARLEQUIN,.99,999 (reported in Table 6 as ‘) as compared to,10,000 forE. marshi. Hence coalescence analyses, while offering only first order approxima-tions of these population parameters, indicate that theE. coruscans population in Hawaii is younger and larger thanE. marshi over recent evolutionary history. The exception to both trends is E. marshi at Gardner in the mid-archipelago, which had an age estimate of only 8,030 (Table 7), and an estimated female effective population size of the maximum possible value in ARLEQUIN,.
99,999. We provisionally attribute this finding to violations of coalescence assumptions at a location receiving larval input from an unsampled, genetically distinct location outside the Hawaiian Archipelago (see below), although this ad hoc interpretation is subject to further scrutiny.
Life history traits that might influence the population structure of these four species (spawning time, larval duration, adult vagility,
etc.) are similar but not identical across species. The most dispersive life stage for these fishes is probably the larval stage. Spawning timing may influence dispersal of pelagic eggs and larvae due to seasonality of oceanographic currents in the Hawaiian Archipelago [5].H. quernus, P. filamentosus,E. coruscans, and E. marshi are all broadcast spawners, and all have similar spawning periods (approximately six months), although P. filamentosushas a slightly longer spawning period (approximately ten months) [16]. Peak spawning activity occurs during the summer for each of these species exceptH. quernus, which peaks in the spring.
The length of time that larvae are in the water column (the pelagic larval duration, or PLD) also likely influences dispersal and genetic connectivity for these four deepwater fish [50]. Eggs ofH. quernus, P. filamentosus, E. coruscans, and E. marshi remain in the water column no more than 48 hours before hatching [16]. Biophysical modeling indicates that these eggs could travel up to 50 km (A. Vaz unpublished data). The length of time the larvae remain in the water column after hatching is not well known. For H. quernus, the PLD is estimated to be 35–45 days (R. Nichols and E. DeMartini pers. comm.). PLD is not known forP. filamentosus,E. coruscans, orE. marshi, but eteline lutjanids typically have longer PLDs thanH. quernus[51,52]. ForP. filamentosus, a captive rearing study suggests a potential PLD estimate of 52–120 days, based on observations of larvae associating with the bottom as early as 52 days and the completion of larval metamorphosis by 120 days after hatching [16].
Fishes that are benthic as adults (E. marshiandH. quernus) might be expected to have more structure than fishes that are epibenthic as adults (E. coruscans and P. filamentosus). Contrary to this expectation, neither of the bottom-dwelling species showed higher structure in pairwiseFSTcomparisons. The significant structure at
mid-archipelago (based on microsatellites) wasFST= 0.008–0.010
andFST0.008–0.013 for the bottom dwellers, and FST= 0.011–
0.013 and FST= 0.004–0.066 for the pelagic roamers. Further,
significant isolation by distance was detected in one bottom dweller (H. quernus) and one pelagic feeder (E. coruscans), providing no clear pattern based on habitat preference. Despite modest differences in spawning time, PLD, and habitat use, Hawaiian submesophotic fishes have concordant population structure that is not shared with fishes that inhabit adjacent shallow habitat. Figure 3. Bayesian clustering analysis results obtained with the program STRUCTURE 2.3.3 (Pritchard 2000) using sample location as a prior for (a)Etelis coruscans,K= 2 and (b)Etelis marshi,K= 3.
doi:10.1371/journal.pone.0091665.g003
Phylogeography of Hawaiian Submesophotic Snappers
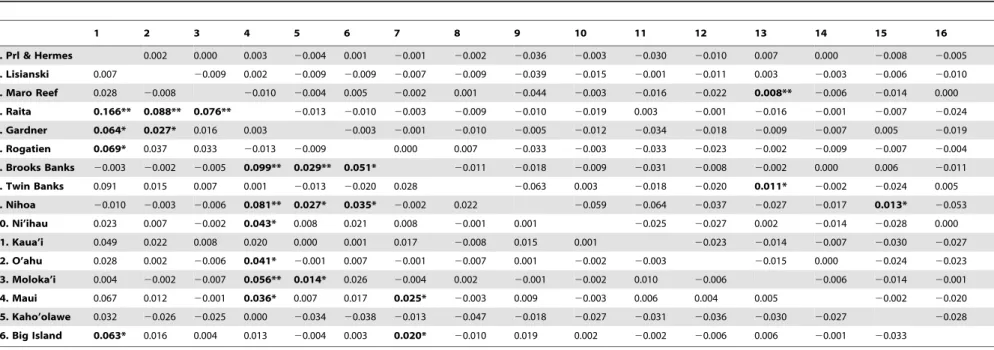
Table 4.Pairwise population genetic divergence for mtDNA cytbsequences (WST, below diagonal) and microsatellites (FST, above diagonal) across the Hawaiian Archipelago for Etelis coruscans.
1 2 3 4 5 6 7 8 9 10 11 12 13 14 15 16
1. Prl & Hermes 0.002 0.000 0.003 20.004 0.001 20.001 20.002 20.036 20.003 20.030 20.010 0.007 0.000 20.008 20.005
2. Lisianski 0.007 20.009 0.002 20.009 20.009 20.007 20.009 20.039 20.015 20.001 20.011 0.003 20.003 20.006 20.010
3. Maro Reef 0.028 20.008 20.010 20.004 0.005 20.002 0.001 20.044 20.003 20.016 20.022 0.008** 20.006 20.014 0.000
4. Raita 0.166** 0.088** 0.076** 20.013 20.010 20.003 20.009 20.010 20.019 0.003 20.001 20.016 20.001 20.007 20.024
5. Gardner 0.064* 0.027* 0.016 0.003 20.003 20.001 20.010 20.005 20.012 20.034 20.018 20.009 20.007 0.005 20.019
6. Rogatien 0.069* 0.037 0.033 20.013 20.009 0.000 0.007 20.033 20.003 20.033 20.023 20.002 20.009 20.007 20.004
7. Brooks Banks 20.003 20.002 20.005 0.099** 0.029** 0.051* 20.011 20.018 20.009 20.031 20.008 20.002 0.000 0.006 20.011
8. Twin Banks 0.091 0.015 0.007 0.001 20.013 20.020 0.028 20.063 0.003 20.018 20.020 0.011* 20.002 20.024 0.005
9. Nihoa 20.010 20.003 20.006 0.081** 0.027* 0.035* 20.002 0.022 20.059 20.064 20.037 20.027 20.017 0.013* 20.053
10. Ni’ihau 0.023 0.007 20.002 0.043* 0.008 0.021 0.008 20.001 0.001 20.025 20.027 0.002 20.014 20.028 0.000
11. Kaua’i 0.049 0.022 0.008 0.020 0.000 0.001 0.017 20.008 0.015 0.001 20.023 20.014 20.007 20.030 20.027
12. O’ahu 0.028 0.002 20.006 0.041* 20.001 0.007 20.001 20.007 0.001 20.002 20.003 20.015 0.000 20.024 20.023
13. Moloka’i 0.004 20.002 20.007 0.056** 0.014* 0.026 20.004 0.002 20.001 20.002 0.010 20.006 20.006 20.014 20.001
14. Maui 0.067 0.012 20.001 0.036* 0.007 0.017 0.025* 20.003 0.009 20.003 0.006 0.004 0.005 20.002 20.020
15. Kaho’olawe 0.032 20.026 20.025 0.000 20.034 20.038 20.013 20.047 20.018 20.027 20.031 20.036 20.030 20.027 20.028
16. Big Island 0.063* 0.016 0.004 0.013 20.004 0.003 0.020* 20.010 0.019 0.002 20.002 20.006 0.006 20.001 20.033
Values in bold are significant: *p,0.05,
**p,0.01.
doi:10.1371/journal.pone.0091665.t004
Phylog
eography
of
Hawaiian
Submesophot
ic
Snappers
PLOS
ONE
|
www.ploson
e.org
10
April
2014
|
Volume
9
|
Issue
4
|
Table 5.Pairwise population genetic divergence for mtDNA cytbsequences (WST, below diagonal) and microsatellites (FST, above diagonal) across the Hawaiian Archipelago for Etelis marshi.
1 2 3 4 5 6 7 8 9 10 11 12 13 14 15 16
1. Salmon Bank 20.215 20.217 20.198 20.051 20.213 20.051 20.140 20.170 20.208 20.210 20.246 20.220 20.195 20.194 20.218
2. Lisianski 0.000 20.025 0.007 20.042 20.005 20.052 20.044 0.010 20.021 20.032 20.025 20.008 20.018 0.005 20.008
3. Northampton 20.035 20.030 20.011 20.076 20.001 20.080 20.037 20.026 0.000 0.004* 20.004 20.003 0.003 20.015 20.001
4. Maro Reef 20.045 20.041 20.007 20.049 20.012 20.048 20.042 20.002 20.011 20.008 20.015 0.001 20.005 20.001 20.004
5. Raita 20.041 20.037 20.009 20.013 20.079 0.010* 20.070 20.035 20.073 20.073 20.088 20.067 20.069 20.041 20.071
6. Gardner 20.003 0.002 0.034* 0.022 0.024* 20.071 20.033 20.021 0.001 0.008* 0.001 0.002 0.008* 20.011 20.001
7. St. Rogatien 20.042 20.037 0.002 20.014 20.004 0.011 20.052 20.032 20.073 20.072 20.092 20.079 20.071 20.051 20.071
8. Brooks Banks 0.009 0.018 0.077 0.047 0.024 0.007 0.059 20.044 20.037 20.040 20.052 20.043 20.039 20.029 20.039
9. Necker 20.042 20.038 0.005 20.007 20.002 0.037** 20.007 0.064 20.029 20.025 20.029 20.016 20.023 20.002 20.020
10. Twin Banks 20.041 20.037 20.002 20.012 20.006 0.043** 20.002 0.059 20.003 0.001 20.009 20.001 20.001 20.014 20.003
11. Ni’ihau 20.035 20.031 20.004 20.008 20.007 0.021 20.007 0.070 0.004 0.000 20.002 0.002 20.001 20.010 20.002
12. Kaua’i 20.026 20.021 0.009 0.001 0.004 0.055*** 0.014 0.075 20.001 20.009 0.015 20.003 20.008 20.012 20.007
13. O’ahu 20.032 20.027 20.013 20.014 20.018 0.037* 0.008 0.044 0.003 20.009 20.002 0.004 0.000 20.006 20.002
14. Moloka’i 20.046 20.042 0.000 20.012 20.008 0.040** 20.010 0.070 0.000 20.001 20.002 0.016 20.003 20.006 20.002
15. Maui 20.034 20.030 20.004 20.007 20.008 0.039** 0.005 0.036 0.002 20.005 0.007 20.005 20.015 0.003 20.010
16. Big Island 20.041 20.037 20.002 20.010 20.004 0.026* 20.013 0.077 20.002 0.002 20.004 0.015 20.001 20.007 0.005
Values in bold are significant: *p,0.05,
**p,0.01, ***p,0.001.
doi:10.1371/journal.pone.0091665.t005 Phylog
eography
of
Hawaiian
Submesophot
ic
Snappers
PLOS
ONE
|
www.ploson
e.org
11
April
2014
|
Volume
9
|
Issue
4
|
Connectivity with Johnston Atoll
In previous genetic studies of submesophotic reef fishes (H. quernus and P. filamentosus) in the Hawaiian Archipelago, the authors hypothesized that the pattern of population structure and high diversity in the mid-archipelago is driven by connectivity with Johnston Atoll [2–4]. Johnston Atoll is the nearest landmass to the Hawaiian Archipelago, with the closest Hawaiian island/atoll being French Frigate Shoals, in the mid-archipelago between Brooks Banks and Necker, 865 km north-northeast of Johnston (Figure 1). Several studies have found connectivity between Johnston and the Hawaiian Archipelago for a broad taxonomic
range of fishes and invertebrates (e.g., [8,11,14,15,53]). In some cases, these species exhibit greater genetic connectivity between Johnston and the mid-archipelago than between Johnston and other parts of the archipelago (e.g., [14,15,53]). In addition, biogeographic studies support a dispersal corridor between Johnston and the mid-archipelago. Based on marine faunal affinities, Johnston is regarded as part of the Hawaiian biogeo-graphic province [54–59]. Finally, a biophysical model of oceanic dispersal indicates two dispersal corridors from Johnston Atoll to the Hawaiian Archipelago for marine species with PLDs greater than 40 days, one centered at French Frigate Shoals, and the other Figure 4. Correlation between genetic distance (pairwiseWSTorFST) and geographic distance between sample sites for (a) mtDNA
cytochromeb(P= 0.044,r= 0.126) and (b) microsatellites (P= 0.042,r= 0.171) forEtelis coruscans.Correlations between genetic and geographic distance were non-significant for both marker types forEtelis marshi.
doi:10.1371/journal.pone.0091665.g004
Phylogeography of Hawaiian Submesophotic Snappers
at Kaua’i [5]. The latter is notable because Kaua’i is the only location that was strongly differentiated in STRUCTURE analysis ofE. coruscans. In addition, biophysical modeling of larval dispersal for the submesophotic fish H. quernus indicated connectivity between Johnston and Gardner, but not other locations in Hawai’i [3].
Unfortunately none of the genetic studies on the submesophotic reef fishes of Hawai’i have included specimens from Johnston Atoll, and therefore the hypothesis of genetic connectivity between Hawai’i and Johnston has not been directly tested. The PLDs ofE. coruscans and E. marshi are likely greater than 45 days, which is sufficient to maintain connectivity between the mid-archipelago and Johnston Atoll according to the biophysical models [5]. Additionally, each of these species has a wide-spread distribution across the Indo-Pacific, indicating high dispersal capabilities.
Studies are currently underway to examine population genetic structure across the ranges of these species to get a greater understanding of dispersal patterns.
Comparing genetic structure revealed by different markers and analysis types
Although the pattern of genetic structure and high diversity in the mid-archipelago was consistent across the four submesophotic reef fishes in the Hawaiian Archipelago, not all genetic markers or analyses consistently revealed these patterns within species. For example, mtDNA analyses ofH. quernus,E. coruscans, andE. marshi revealed a greater number of significant pairwise divergence values than did microsatellite analyses; andP. filamentosus exhibited the opposite pattern. Obtaining different results for mtDNA and microsatelliteFSTanalyses is common, and is usually attributed to
Table 6.Tajima’sDvalues, Fu’sFSvalues, and mismatch distribution parameter estimates calculated using mtDNA cytbsequences forEtelis coruscans.t: coalescent time;fi0(Nft = 0): initial female effective population size;fi1(Nft = 1): post-expansion female effec-tive population size.
Tajima’sD Fu’sFS t(years) fi0(Nft = 0) fi1(Nft = 1)
Pearl & Hermes 20.90 21.94* 1.1 0.00352 ‘
(5,610) (35.9) (NA)
Lisianski 21.63* 25.65* 1.3 0 ‘
(6,630) (0) (NA)
Maro Reef 21.77* 26.30* 1 0 ‘
(5,100) (0) (NA)
Raita 21.83* 25.02* 1.2 0 ‘
(6,120) (0) (NA)
Gardner 22.11* 223.1* 1.4 0.00176 ‘
(7,140) (18) (NA)
St. Rogatien 21.83* 27.48* 1.8 0 ‘
(9,180) (0) (NA)
Brooks Banks 21.78* 27.29* 1.1 0 ‘
(5,610) (0) (NA)
Twin Banks 20.97 22.58* 1.3 0.00176 ‘
(6,630) (18) (NA)
Nihoa 21.83* 26.79* 1.4 0 ‘
(7,140) (0) (NA)
Ni’ihau 21.51* 25.74* 1.3 0.00176 ‘
(6,630) (18) (NA)
Kaua’i 21.78* 27.80* 1.3 0 ‘
(6,630) (0) (NA)
O’ahu 21.82* 28.95* 1.2 0 ‘
(6,120) (0) (NA)
Moloka’i 22.11* 224.9* 1.4 0 ‘
(7,140) (0) (NA)
Maui 21.57* 26.78* 1.2 0 ‘
(6,120) (0) (NA)
Kaho’olawe 20.83 21.93* 1.4 0 ‘
(7,140) (0) (NA)
Big Island 22.10* 218.5* 1.3 0 ‘
(6,630) (0) (NA)
Estimates offi1yielded the maximum allowable value (99,999, here indicated by‘), so that the calculation ofNft = 1was not possible (NA). *P,0.05.
doi:10.1371/journal.pone.0091665.t006
Phylogeography of Hawaiian Submesophotic Snappers
differences in mutation rates, modes of inheritance, and/or levels of power between marker types [60–64]. Obtaining different results for different types of analyses that use the same marker is common as well (reviewed in [60,61]), and this was observed in some cases for the fishes studied here. For example, microsatellite Bayesian clustering analyses sometimes indicated genetically divergent populations that were not detected with microsatellite pairwise FST analyses, and vice versa (e.g. Bayesian clustering
analyses indicated Kaua’i was divergent from other locations forE. coruscans, but pairwise FST analyses did not). These subtle
differences in genetic structure for different markers and analyses and the overall pattern of weak genetic structure across the archipelago for all four species are consistent with a scenario in which migration across the archipelago is around the level at which genetic methods lose power to detect restrictions in gene flow. Genetic methods lose power at levels of gene flow that are still low enough to maintain demographically independent populations; this is especially true when effective population sizes are large, as in many marine fish and invertebrate populations [65,66]. The idea that demographically relevant population
structure occurs within the Hawaiian Archipelago is also supported by the presence of significant genetic isolation by distance for two of the deepwater species (H. quernus, [67]; andE. coruscans). Therefore the structure detected for deepwater fish using genetic methods is likely biologically relevant on an ecological timescale.
Submesophotic population structure
The potential influence of unique oceanographic features of the submesophotic habitat on population genetic structure is largely unknown. Species inhabiting these environments may be less dispersive if larvae are not subject to the high-energy environment of surface waters [68]. A previous study of a submesophotic snapper (Pristipimoides multidens) in Indonesia and northern Australia supported this idea, with surprisingly strong genetic structure found over short geographic distances (e.g. genetically divergent groups separated by as little as 191 km) [69]. In contrast, the population structure observed in the four submesophotic fishes is typical of shallow-water members of the same taxonomic families [10,70] with the exception of the mid-archipelago Table 7.Tajima’sDvalues, Fu’sFSvalues, and mismatch distribution parameter estimates calculated using mtDNA cytbsequences forEtelis marshi.t: coalescent time;fi0(Nft = 0): initial female effective population size;fi1(Nft = 1): post-expansion female effective population size.
Tajima’sD Fu’sFS t(age) fi0(Nft = 0) fi1(Nft = 1)
Northampton 21.68* 25.48* 3.0 0 0.3165
(344,000) (0) (3,630)
Maro Reef 22.09* 25.85* 3.0 0 0.2620
(344,000) (0) (3,000)
Raita 22.11* 24.73* 3.0 0 0.3214
(344,000) (0) (3,690)
Gardner 21.39 23.18* 0.7 0 ‘
(8,030) (0) (NA)
St. Rogatien 21.73* 23.44* 3.0 0 0.2425
(344,000) (0) (2,780)
Brooks Banks 21.67* 0.058 3.3 0 0.6843
(378,000) (0) (7,850)
Necker 22.05* 27.03* 3.0 0 0.3141
(344,000) (0) (3,600)
Twin Banks 22.13* 28.89* 3.0 0 0.3190
(344,000) (0) (3,660)
Ni’ihau 21.86* 27.16* 3.0 0 0.2921
(344,000) (0) (3,350)
Kaua’i 21.45* 22.84* 3.0 0 0.2872
(344,000) (0) (3,290)
O’ahu 21.56* 22.92* 3.0 0 0.19487
(344,000) (0) (2,230)
Moloka’i 22.07* 26.82* 3.0 0 0.17412
(344,000) (0) (2,000)
Maui 21.92* 24.50* 3.0 0 0.3360
(344,000) (0) (3,850)
Big Island 21.90* 27.50* 3.0 0 0.3165
(344,000) (0) (3,630)
Some estimates offi1yielded the maximum allowable value (99,999, here indicated by‘), so that the calculation ofNft = 1was not possible (NA). *P,0.05.
doi:10.1371/journal.pone.0091665.t007
Phylogeography of Hawaiian Submesophotic Snappers
structure that so far is unique to submesophotic fishes. Indeed, it is not certain that spawned eggs or larvae remain at submesophotic depths, and so this expectation may not be valid. Another possibility is that deeper communities may be less susceptible to the disruption that shallow communities experience during sea level drops associated with glaciations [68,71,72]. During the last glacial maximum, sea levels dropped at least 130 m below contemporary levels [73]. Collectively the four fishes evaluated here range down to,330 m, and adultEtelisspecimens have been
documented below that depth; this would seem to be ample buffer against disturbance in the upper 130 m. Furthermore, the primary habitat of these species consists of rocky substrate, not living coral, and therefore the abundance of suitable habitat may not be substantially influenced by sea level changes. Nevertheless, these fish show the short coalescence times that are typical of shallow reef populations ([10,70] for examples): ,6,000 years for E.
coruscans and ,344,000 years for E. marshi. While this topic
requires further investigation, especially for the coral reef fauna at mesophotic depths, the evidence here indicates that submesopho-tic fishes experience the same type of episodic crashes as confamilial species in shallow depths.
Conservation & Management
E. coruscans,E. marshi,H. quernus, andP. filamentosuscomprise the majority of a valuable deepwater fishery in Hawai’i [74–76] and they have experienced overfishing in recent years [48]. The Northwestern Hawaiian Islands (Nihoa to Kure) have been off-limits to the fishery since 2010 due to the designation of this region as the Papaha¯naumokua¯kea Marine National Monument. How-ever, the presence of fishing pressure in the Main Hawaiian Islands necessitates an understanding of stock structure across the archipelago for the effective management of this fishery. Popula-tion genetic analyses of these four deepwater fishes point to the mid-archipelago as a genetically diverse region possibly with larval supplement from an external source. Genetic analyses reveal high levels of connectivity across the rest of the archipelago, with the possible exception of a genetically divergent population of E. coruscans at Kaua’i. The genetic data provide several indications that dispersal between Hawaiian Islands may be at a level low enough to create some level of demographic independence, but high enough to prevent genetic divergence between these regions. Other methods for measuring demographic connectivity, such as tagging studies and bio-physical modeling of larval dispersal, will be an important complement to these genetic data for the assessment of stock structure.
In the realm of dispersive and migratory marine species, there are many cases in which genetically divergent groups are distributed in complex geographic configurations, and these cases often necessitate complex management strategies. For example, both sea turtles and salmon have genetically differentiated stocks at spawning habitats, but these stocks are diffuse and thoroughly mixed in oceanic feeding habitats [77,78]. For marine species with pelagic larvae, an increasing number of studies are finding evidence that complex genetic structure depends more on oceanographic currents or habitat distribution than on simple geographic distance [79,80]. The Hawaiian submesophotic fishes also appear to have geographically complex population genetic structure that is not defined solely by geographic distance, because locations in the mid-archipelago are genetically distinct from nearby locations. If future studies find this genetic divergence to be driven by dispersal from Johnston Atoll, then larval supplement to
the local Hawaiian stock from Johnston Atoll may need to be incorporated into management strategies.
Conclusions
Population genetic studies have revealed high variability in patterns of genetic structure across the Hawaiian Archipelago for shallow marine species, even for species with similar life history characters. In contrast, all four submesophotic fishes surveyed to date showed concordant patterns of genetic structure, with dispersal across the entire archipelago, yet genetically divergent populations occurring in the mid-archipelago. Genetic divergence at the mid-archipelago may be driven by connectivity with Johnston Atoll, located outside of the Hawaiian Archipelago. Therefore management strategies may need to consider the impact of larval supply from outside the Hawaiian Archipelago, a supplement that has yet to be quantified. Our results also indicate that submesophotic populations may be as dispersive as their shallow water counterparts, and may have been equally unstable over geological time.
Supporting Information
Table S1 Specimen ID, sampling location,
microsatel-lite allele lengths (bp), and cytb GenBank Accession
numbers for Etelis coruscans specimens. Missing data coded by ‘‘0’’.
(TXT)
Table S2 Specimen ID, sampling location,
microsatel-lite allele lengths (bp), and cytb GenBank Accession
numbers for Etelis marshi specimens.Missing data coded by ‘‘0’’.
(TXT)
Acknowledgments
Mahalo to the fishermen in the Hawaiian bottomfish fishery for their assistance in sample collection throughout the Hawaiian Islands. For facilitating this project we thank Sam Pooley, Michael Seki, and Robert Moffitt at the NOAA Pacific Islands Fisheries Science Center, Kitty Simonds and Mark Mitsuyasu at the Western Pacific Regional Fishery Management Council, Aulani Wilhelm and Randall Kosaki at the Papaha¯naumokua¯kea Marine National Monument, and the Hawai’i State Division of Aquatic Resources. Thanks to Jonathan Puritz, Jeff Eble, Joseph DiBattista, Matthew Craig, Luiz Rocha, Iria Fernandez-Silva, Joshua Copus, Derek Skillings, Zoltan Szabo, and especially Robert Toonen and Steve Karl for their intellectual input. We thank the staff of the HIMB EPSCoR Evolutionary Genetics Core Facility and especially Amy Eggers for assistance with genotyping, and the University of Hawai’i Advanced Studies of Genomics, Proteomics and Bioinformatics sequencing facility for their assistance with DNA sequencing and genotyping. Thanks to the staff at Hawai’i Institute of Marine Biology, and especially director Jo-Ann Leong, for their support throughout this project. We thank Robert Humphreys, Edward DeMartini, Robert Moffitt, and Ana Vaz for comments that substantially improved the manuscript. This is contribution
#1581 from the Hawai’i Institute of Marine Biology,#9078 from the School of Ocean and Earth Science and Technology, and UNIHI-SEAGRANT-JC-05-53 from the University of Hawai’i Sea Grant Program.
Author Contributions
Conceived and designed the experiments: KRA VNM EGG CK RLP BWB. Performed the experiments: KRA VNM CW. Analyzed the data: KRA VNM CW. Contributed reagents/materials/analysis tools: EGG CK BWB. Wrote the paper: KRA BWB.
Phylogeography of Hawaiian Submesophotic Snappers
References
1. Toonen RJ, Andrews KR, Baums IB, Bird CE, Concepcion GT, et al. (2011) Defining boundaries for ecosystem-based management: A multispecies case study of marine connectivity across the Hawaiian Archipelago. Journal of Marine Biology Article ID 460173.
2. Rivera MAJ, Kelley CD, Roderick GK (2004) Subtle population genetic structure in the Hawaiian grouper,Epinephelus quernus(Serranidae) as revealed by mitochondrial DNA analyses. Biological Journal of the Linnean Society 81: 449– 468.
3. Rivera MAJ, Andrews KR, Kobayashi D, Wren J, Kelley C, et al. (2011) Genetic analyses and simulations of larval dispersal reveal distinct populations and directional connectivity across the range of the Hawaiian Grouper (Epinephelus quernus). Journal of Marine Biology Article ID 765353.
4. Gaither MR, Jones SA, Kelley C, Newman SJ, Sorenson L, et al. (2011) High connectivity in the deepwater snapper Pristipomoides filamentosus (Lutjanidae) across the Indo-Pacific with Isolation of the Hawaiian Archipelago. Plos One 6: e28913. doi:28910.21371/journal.pone.0028913
5. Kobayashi DR (2006) Colonization of the Hawaiian Archipelago via Johnston Atoll: a characterization of oceanographic transport corridors for pelagic larvae using computer simulation. Coral Reefs 25: 407–417.
6. Craig MT, Eble JA, Bowen BW, Robertson DR (2007) High genetic connectivity across the Indian and Pacific Oceans in the reef fishMyripristis berndti(Holocentridae). Marine Ecology Progress Series 334: 245–254. 7. Ramon ML, Nelson PA, De Martini E, Walsh WJ, Bernardi G (2008)
Phylogeography, historical demography, and the role of post-settlement ecology in two Hawaiian damselfish species. Marine Biology 153: 1207–1217. 8. Eble JA, Toonen RJ, Bowen BW (2009) Endemism and dispersal: comparative
phylogeography of three surgeonfishes across the Hawaiian Archipelago. Marine Biology 156: 689–698.
9. Craig MT, Eble JA, Bowen BW (2010) Origins, ages and population histories: comparative phylogeography of endemic Hawaiian butterflyfishes (genus Chaetodon). Journal of Biogeography 37: 2125–2136.
10. Gaither MR, Bowen BW, Toonen RJ, Planes S, Messmer V, et al. (2010) Genetic consequences of introducing allopatric lineages of Bluestriped Snapper (Lutjanus kasmira) to Hawaii. Molecular Ecology 19: 1107–1121.
11. DiBattista JD, Wilcox C, Craig MT, Rocha LA, Bowen BW (2011) Phylogeography of the Pacific Blueline SurgeonfishAcanthurus nigrorisreveals a cryptic species in the Hawaiian Archipelago. Journal of Marine Biology Article ID 839134.
12. Eble JA, Rocha LA, Craig MT, Bowen B (2011) Not all larvae stay close to home: Insights into marine population connectivity with a focus on the Brown Surgeonfish (Acanthurus nigrofuscus). Journal of Marine Biology, Article ID 518516. 13. Reece JS, Bowen BW, Smith DG, Larson A (2011) Comparative phylogeog-raphy of four Indo-Pacific moray eel species (Muraenidae) reveals comparable ocean-wide genetic connectivity despite five-fold differences in available adult habitat. Marine Ecology Progress Series 437: 269–277.
14. Timmers MA, Toonen RJ, Andrews K, deMaintenton MJ, Brainard R (2011) Widespread dispersal of the crown-of-thorns sea star,Acanthaster planci, across the Hawaiian Archipelago and Johnston Atoll. Journal of Marine Biology Article ID 934269.
15. Skillings D, Bird CE, Toonen RJ (2011) Gateways to Hawai’i: Genetic population structure of the tropical sea cucumberHolothuria atra. Journal of Marine Biology Article ID 783030.
16. WPRFMC (2012) Final fishery management plan for coral reef ecosystems of the western Pacific region, volume III, Essential Fish Habitat for Management Unit Species, Appendix 3, Essential Fish Habitat descriptions, Part 1: Hawaiian bottomfish.
17. WPRFMC (1988) Amendment 2 to the fishery management plan for the bottomfish and seamount groundfish fisheries of the Western Pacific Region. Western Pacific Regional Fishery Management Council, Honolulu. 18. DeMartini EE, Friedlander AM (2004) Spatial patterns of endemism in
shallow-water reef fish populations of the Northwestern Hawaiian Islands. Marine Ecology-Progress Series 271: 281–296.
19. Moffitt RB, Parrish FA (1996) Habitat and life history of juvenile Hawaiian Pink Snapper,Pristipomoides filamentosus. Pacific Science 50: 371–381.
20. DeMartini EE, Lau BB (1999) Morphometric criteria for estimating sexual maturity in two snappers,Etelis carbunculusand Pristipomoides sieboldii. Fishery Bulletin 97: 449–458.
21. Ralston S (1979) A description of the bottomfish fisheries of Hawaii, American Samoa, Guam and the Northern Marianas. Honolulu: Western Pacific Regional Fisheries Management Council.
22. Seutin G, White BN, Boag PT (1991) Preservation of avian blood and tissue samples for DNA analyses. Canadian Journal of Zoology 69: 82–90. 23. Cummings SA, Thorgaard GH (1994) Extraction of DNA from fish blood and
sperm. Biotechniques 17: 426–430.
24. Meeker ND, Hutchinson SA, Ho L, Trecle NS (2007) Method for isolation of PCR-ready genomic DNA from zebrafish tissues. Biotechniques 43: 610–614. 25. Meyer A (1993) Molecular phylogenetic studies of fishes. In: Beaumont AR,
editor. Evolution and Genetics of Aquatic Organisms. London: Chapman and Hall.
26. Taberlet P, Meyer A, Bouvet J (1992) Unusual mitochondrial DNA polymorphism in two local populations of blue titParus caeruleus. Molecular Ecology 1: 27–36.
27. Gaither MR, Toonen RJ, Sorenson L, Bowen BW (2010) Isolation and characterization of microsatellite markers for the Crimson Jobfish,Pristipomoides filamentosus(Lutjanidae). Conservation Genetics Resources 2: 169–172. 28. Park SDE (2001) Trypanotolerance in West African Cattle and the Population
Genetic Effects of Selection [PhD thesis]. Dublin: University of Dublin. 29. Excoffier L, Laval LG, Schneider S (2005) Arlequin ver. 3.0: An integrated
software package for population genetics data analysis. Evolutionary Bioinfor-matics Online 1: 47–50.
30. Van Oosterhout C, Hutchinson WF, Wills DPM, Shipley P (2004) MICRO-CHECKER: software for identifying and correcting genotyping errors in microsatellite data. Molecular Ecology Notes 4: 535–538.
31. Chapuis MP, Estoup A (2007) Microsatellite null alleles and estimation of population differentiation. Molecular Biology and Evolution 24: 621–631. 32. Tamura K, Nei M (1993) Estimation of the number of nucleotide substitutions in
the control region of mitochondrial DNA in humans and chimpanzees. Molecular Biology and Evolution 10: 512–526.
33. Posada D (2008) jModelTest: Phylogenetic model averaging. Molecular Biology and Evolution 25: 1253–1256.
34. Goudet J (2001) FSTAT, a program to estimate and test gene diversities and fixation indices, http://www2.unil.ch/popgen/softwares/fstat.htm. Accessed: 2014 Feb 17.
35. Bandelt HJ, Forster P, Rohl A (1999) Median-joining networks for inferring intraspecific phylogenies. Molecular Biology and Evolution 16: 37–48. 36. Pritchard JK, Stephens M, Donnelly P (2000) Inference of population structure
using multilocus genotype data. Genetics 155: 945–959.
37. Hubisz MJ, Falush D, Stephens M, Pritchard JK (2009) Inferring weak population structure with the assistance of sample group information. Molecular Ecology Resources 9: 1322–1332.
38. Raymond M, Rousset F (1995) GENEPOP (version 1.2): population genetics software for exact tests and ecumenicism. Journal of Heredity 86: 248–249. 39. Rousset F (2008) Genepop’007: a complete reimplementation of the Genepop
software for Windows and Linux. Molecular Ecology Resources 8: 103–106. 40. Rousset F (1997) Genetic differentiation and estimation of gene flow fromF
-statistics under isolation by distance. Genetics 145: 1219–1228.
41. Tajima F (1989) Statistical method for testing the neutral mutation hypothesis by DNA polymorphism. Genetics 123: 585–595.
42. Aris-Brosou S, Excoffier L (1996) The impact of population expansion and mutation rate heterogeneity on DNA sequence polymorphism. Molecular Biology and Evolution 13: 494–504.
43. Tajima F (1989) The effect of change in population size on DNA polymorphism. Genetics 123: 597–601.
44. Fu YX (1997) Statistical tests of neutrality of mutations against population growth, hitchhiking and background selection. Genetics 147: 915–925. 45. Ramos-Onsins SE, Rozas J (2002) Statistical properties of new neutrality tests
against population growth. Molecular Biology and Evolution 19: 2092–2100. 46. Bowen BW, Bass AL, Rocha LA, Grant WS, Robertson DR (2001)
Phylogeography of the trumpetfishes (Aulostomus): Ring species complex on a global scale. Evolution 55: 1029–1039.
47. Reece JS, Bowen BW, Smith DG, Larson A (2010) Molecular phylogenetics of moray eels (Muraenidae) demonstrates multiple origins of a shell-crushing jaw (Gymnomuraena, Echidna) and multiple colonizations of the Atlantic Ocean. Molecular Phylogenetics and Evolution 57: 829–835.
48. Brodziak J, Courtney D, Wagatsuma L (2011) Stock assessment of the main Hawaiian Islands Deep7 bottomfish complex through 2010. U.S. Dept. of Commerce, NOAA Technical Memorandum NOAA-TM-NMFS-PIFSC-29. 49. Andrews AH, Kalish JM, Newman SJ, Johnston JM (2011) Bomb radiocarbon
dating of three important reef-fish species using Indo-PacificD14
C chronologies. Marine and Freshwater Research 62: 1259–1269.
50. Selkoe KA, Toonen RJ (2011) Marine connectivity: a new look at pelagic larval duration and genetic metrics of dispersal. Marine Ecology-Progress Series 436: 291–305.
51. Leis J (1987) Review of the early life history of tropical groupers (Serranidae) and snappers (Lutjanidae). In: Polovina J, Ralston S, editors. Tropical snappers and groupers: biology and fisheries management. Boulder, CO: Westview Pr. pp. 189–237.
52. Leis JM, Lee K (1994) Larval development in the lutjanid subfamily Etelinae (Pisces): The generaAphareus,Aprion,EtelisandPristipomoides. Bulletin of Marine Science 55: 46–125.
53. Leray M, Beldade R, Holbrook SJ, Schmitt RJ, Planes S, et al. (2010) Allopatric divergence and speciation in coral reef fish: the three-spot Dascyllus,Dascyllus trimaculatus, species complex. Evolution 64: 1218–1230.
54. Briggs JC, Bowen BW (2012) A realignment of marine biogeographic provinces with particular reference to fish distributions. Journal of Biogeography 39: 12– 30.
55. Grigg RW (1981) Acropora in Hawaii USA 2. Zoogeography. Pacific Science 35: 15–24.
56. Grigg RW, Wells JW, Wallace C (1981) Acropora in Hawaii USA 1. History of the scientific record, systematics and ecology. Pacific Science 35: 1–13.
Phylogeography of Hawaiian Submesophotic Snappers