Spatial variation in the structure and floristic composition of “restinga”
vegetation in southeastern Brazil
1MARINA C.P. PIMENTEL
2, MARX J. BARROS
2, PAULO CIRNE
2, EDUARDO A. DE MATTOS
2,
RODRIGO C. OLIVEIRA
2, MIRIAM C.A. PEREIRA
2, FABIO R. SCARANO
2,
HENRIQUE L.T. ZALUAR
2and DOROTHY S.D. ARAUJO
2,3(received: January 01, 2005; accepted: September 28, 2007)
ABSTRACT – (Spatial variation in the structure and floristic composition of “restinga” vegetation in southeastern Brazil). We
examined large-scale spatial variation of structural parameters and floristic composition in open Clusia scrub, a vegetation type of the Brazilian “restingas” (sandy coastal plain vegetation). This vegetation is organized in islands separated by sandy stretches with sparse herbaceous vegetation. We located 12 sample areas on three consecutive beach ridges, lying parallel to the coastline and at different distances from the ocean, in close proximity to two lagoons (Cabiúnas and Comprida). Each sample area was divided into three strips. We used the line intercept method to sample all woody plants ³ 50 cm tall. We used
nested ANOVA to verify structural variation between different sampling scales. TWINSPAN analysis was performed to examine the variation in floristic composition between areas. The overall diversity index was 3.07. Six species are repeatedly dominant throughout the entire sampling area. There was homogeneity in relation to diversity and species richness between beach ridges but not within beach ridges. Floristic composition and structural parameters did not vary in relation to distance from the sea but floristic composition did vary as a function of proximity to Cabiúnas or Comprida lagoon. Differences in plant cover between sample areas may be related to the paleoformation of this sandy coastal plain.
Key words - phytosociology, plant community, sampling scale, sandy coastal plain
RESUMO – (Variação espacial na estrutura e composição florística de uma vegetação de restinga no Sudeste brasileiro). A
variação em ampla escala espacial para parâmetros estruturais e composição florística foi examinada para uma formação aberta de Clusia, um tipo vegetacional das restingas brasileiras. Esta vegetação é organizada em moitas separadas por areia com esparsa vegetação herbácea. Foram levantadas 12 áreas amostrais em três cordões arenosos paralelos, às margens de duas lagoas costeiras (Cabiúnas e Comprida). Estes cordões estavam dispostos a diferentes distâncias do mar. Cada área amostral foi dividida em três faixas. Usamos o método de intercepto de linha para amostrar todas as plantas lenhosas ³ 50 cm de altura.
Foi empregada ANOVA hierárquica para verificar a variação estrutural em diferentes escalas amostrais, e análise de TWINSPAN para examinar a variação na composição florística entre áreas. A diversidade total da área (H’) foi de 3,07. Apenas poucas espécies foram repetidamente dominantes ao longo de toda a área amostral. Houve homogeneidade em relação à diversidade e riqueza de espécies entre cordões arenosos, mas não dentro destes cordões. Composição florística e parâmetros estruturais não variaram em relação à distância do mar, mas a composição florística variou em função da lagoa que margeava. As diferenças observadas na cobertura vegetal podem estar relacionadas com a história geológica desta área de restinga.
Palavras-chave - comunidade vegetal, escala amostral, fitossociologia, restinga
Introduction
Delimitation and characterization of plant communities remains one of the main problems faced by ecologists. There is still a lack of evidence regarding the extent to which classification systems reflect the true nature of plant communities (Shrader-Frechette & McCoy 1993). In this context, problems related to sampling effort needed to produce floristic inventories that include rare
species (Condit 1995, Jalonen et al. 1998) have been
widely discussed, as has optimal sample size to detect structural variation within plant communities (Pitman et al. 1999). These issues are often more challenging in
the tropics, where many communities have high species diversity. For instance, Campbell (1994) found that sample plots of anything less than 10 ha were insufficient to provide an accurate description of the structure of Amazon rain forests. The sampling effort needed for such a large area would not be feasible in most cases, particularly if one considers the need for replication. Since sound community ecology is one of the most important tools in biological conservation (Shrader-Frechette & McCoy 1993), this methodological difficulty must be overcome.
1. This paper is part of the doctoral thesis of the first author at the Graduate Program in Ecology, UFRJ.
In Brazil, where biodiversity is probably the highest in the world (World Conservation Monitoring Center 1992), most delimitation and characterization surveys have been restricted to one-hectare plots, with a few exceptions (e.g., Campbell 1994, Nascimento et al. 1999).
This is also true for the vegetation on the Brazilian sandy coastal plains (“restingas”) where surveys often cover 1.0 hectare or less (e.g. Hay et al. 1981, Ribas et al. 1993,
Araujo et al. 1998, Menezes & Araujo 1999).
Geomorphologically, “restingas” are the result of Quaternary changes in sea-level influencing the deposition of sandy marine deposits (Martin et al. 1993) which
sometimes form broad coastal plains consisting of alternating beach ridges and swales, covered by a number of different forest, scrub and herbaceous vegetation types. These plant communities also are designated collectively as “restinga” vegetation (Araujo 1992). In prograding environments, one can assume that the age of these ridges generally increases as one goes inland (Martin et al. 1993) and
there is a sharp gradient of abiotic factors (e.g., salt spray,
sand movement, soil moisture content) that decrease in intensity inland from the beach (Ehrenfeld 1990). Furthermore, in many parts of the world, species diversity and vegetation complexity increase inland from the beach (Espejel 1992, Lacerda et al. 1993).
Our aim was to assess the degree of floristic and phytosociological variation in the open Clusia scrub
formation, a plant community in southeastern Brazil consisting of variously shaped thickets that are separated by sparsely vegetated areas (Araujo 1992, Araujo et al. 1998, 2004).
This study was designed to provide answers to the following questions: (1) Is there variation in structural parameters, dominance and species composition between beach ridges in the open Clusia scrub?; (2) If so, is this variation
a function of the distance from beach ridge to the sea?; and (3) Is there variation in structural parameters, dominance and species composition within each beach ridge?
Material and methods
Study area – “Restingas” are found all along the Brazilian coast, and differences in topography, water table level and other factors along a gradient inland from the beach create a number of different habitats and a mosaic of plant communities (Araujo 2000). “Restingas” constitute one of the biomes marginal to the Atlantic rain forest (Scarano 2002), a well-known biodiversity hotspot (Myers et al. 2000). In northern Rio de Janeiro state, a series of beach ridges of Pleistocene age form the broad coastal plain of the “Parque Nacional da Restinga de Jurubatiba”, 22°00’-22°23’ S, 41°15’-41°35’ W. Here, the outermost ridge, formed during the Holocene (Martin et al. 1993), often encloses a series of brackish or freshwater lagoons. Average
annual temperature is 22.6 °C and rainfall is seasonal with a monthly maximum of 189 mm in summer (January). Average annual rainfall is ca. 1,200 mm; rainfall is lower from May to August and in June soils are moisture deficient.
Ten plant communities have been described for the “Parque Nacional da Restinga de Jurubatiba” and one of the most representative locally is the open Clusia scrub (Araujo et al. 1998), where the present study was carried out. This formation gets its name from Clusia hilariana, the most conspicuous woody plant in the landscape due to size, shape and frequency (Araujo & Scarano 2007). This dioecious, CAM (crassulacean acid metabolism; Franco et al. 1996) tree reaches 5-7 m in height and is the central nurse plant in most thickets (Scarano 2002, Scarano et al. 2004, Dias et al. 2005, Dias & Scarano 2007). The Clusia scrub formation occurs in a coastal strip from the study area, in Rio de Janeiro, to Espirito Santo and southern Bahia (Araujo 2000). The study area includes two lagoons, Cabiúnas and Comprida, and reaches the southern shore of a third, Carapebus lagoon. The open Clusia scrub lies on the beach ridges, at a higher level than other local vegetation types. Ground-water levels are often more than 1 m below the surface (Araujo et al. 1998). Field sampling – In 7.2 ha, 12 sample areas were established in the open Clusia scrub – six areas near Cabiúnas lagoon and six near Comprida lagoon (figure 1). The lagoons are separated from the sea by a narrow strip of sand. The arms of the lagoons flood the swales between the beach ridges where swamp forests occur. Three sample areas were selected on each side of each lagoon. These ridges are separated from each other by approximately 100 m. On each ridge we set one sample area, so these differed in regard to distance from the sea. In each sample area, three 100 m x 20 m strips were set parallel to the shoreline, 50 m apart from one another. In each strip, ten 20 meter intercepting lines were randomly chosen. We sampled a total 7,200 meters by the line-intercept method (Brower & Zar 1984).
Analysis of variance for each structural parameter (diversity, species richness, vegetation cover) in the open Clusia scrub was carried out by means of nested ANOVA (Zar 1996). This statistical test detects differences in sampling scale (i.e., strip, sample area, lagoon). The lagoons were considered to be the fixed factor and the strips the random factor. We calculated the variance percentage explained by each sampling level to verify the relative contribution of each level to the variance. We applied TWINSPAN to verify floristic composition variation between areas using species IVs. This program groups areas according to species composition and species according to area classifications. Both classifications occur at the same time and one or more species are named indicator species, that is, species that show well-defined site preference (Valentin 2000). We used PC-ORD for WINDOWS, version 3.0 (MJM Software).
Results
We sampled a total of 62 woody species from 30 families. The diversity (H’) and evenness indices were
3.07 and 0.74, respectively. Myrtaceae had the most species (11), followed by Leguminosae (6). The concentration of IV in a few species occurred throughout the entire study area; 42% of total IV was concentrated in the top six species (Clusia hilariana, Protium icicariba, Myrcia lundiana, Erythroxylum subsessile, Ocotea notata and Myrsine parvifolia). In relation to
each individual sample area, the six species with highest IV were considered to be the dominant-species group, which coincided with the six species mentioned above in only one sample area. At the opposite extreme, in one sample area only one of the species with high IV also pertained to the group mentioned above. Clusia hilariana was in the dominant-species group in all 12
sample areas; Protium icicariba was in this group in
10 sample areas, Myrcia lundiana and Erythroxylum subsessile in seven areas, and Ocotea notata and Myrsine parvifolia, in six and four areas, respectively
(table 1).
Eleven species (18%) were sparsely distributed and occurred in only one of the 12 sample areas: Andira fraxinifolia, Coccoloba alnifolia,Croton sp., Cupania racemosa, Gomidesia fenzliana, Inga maritima, Pilocarpus spicatus, Schinus terebinthifolius, Trichilia
sp., Vernoniarufogrisea and Vitex polygama (table 1).
Most of these species (nine) were found only in the Cabiúnas area while two (Andira fraxinifolia, Vitex polygama) were restricted to the Comprida area.
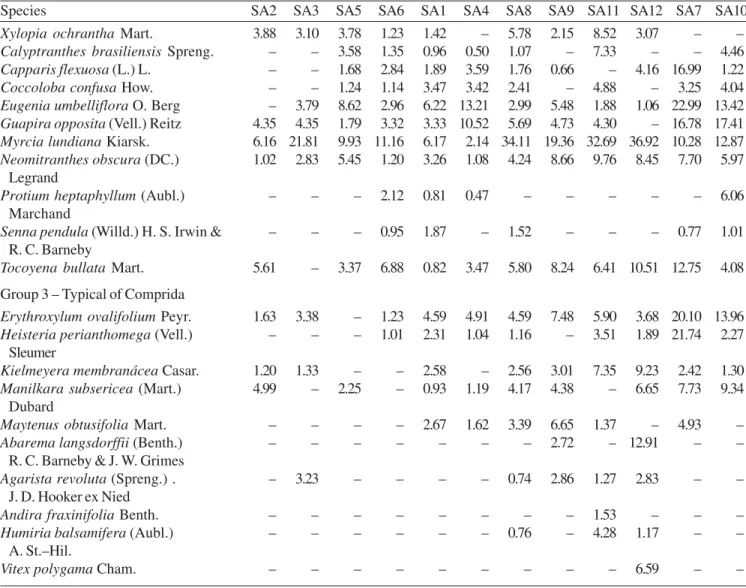
TWINSPAN classification of the sample areas produced three groups (table 1). Two of the groups consist of species found mainly in sample areas located near one of the two lagoons, either Cabiúnas or Comprida (Groups 1 and 3). Vernonia crotonoides is the indicator
species that separates these two groups. This species is not restricted to Cabiúnas lagoon, but it is a first division indicator because it had high IVs near this lagoon, in contrast to the low values seen in the two sample areas where it occurs near Comprida lagoon. Group 2 is composed of species that occur indiscriminately near both lagoons; the six dominant species are in this group. Furthermore, the analysis subdivided Group 1 into Groups 1a and 1b. The former contains mostly rare or intermediate species with low IV values that are practically restricted to the area surrounding Cabiúnas lagoon. The latter has intermediate species with higher IVs and stronger presence in the area around Comprida Lagoon than those of Group 1a.
Although the groups detected by the TWINSPAN classification were related to the lagoons, nested ANOVA showed no significant variation between the two lagoons for the parameters analyzed (table 2). As a whole, only
Figure 1. Study site at the “Parque Nacional da Restinga de Jurubatiba”. Numbers indicate the 12 sample areas in the Clusia open scrub ( = Clusia open scrub; = swamp forests; = periodically flooded open vegetation type (“Restinga de Ericaceae”); = lagoons).
Oceano Atlântico Comprida
0 500 1000 m Oceano Atlântico
PARNA Jurubatiba
– 22°
RJ
Cabiúnas
41°30’
SP
MG
Table 1. Species and sample area (SA) groups from TWINSPAN classification based on species IV for each sample area of the open Clusia scrub formation at “Parque Nacional da Restinga de Jurubatiba”. Cabiúnas (SA1-SA6) and Comprida (SA7-SA12) are the lagoons which are surrounded by the sample areas.
Species SA2 SA3 SA5 SA6 SA1 SA4 SA8 SA9 SA11 SA12 SA7 SA10
Group 1a – Typical of Cabiúnas
Baccharis arctostaphyloides Baker – – 1.32 – – 0.55 – – – – – –
Chaetocarpus myrsinites Baill. 1.63 5.78 – – 1.01 3.84 – – – – – –
Coccoloba alnifolia Casar. – – – – – 0.53 – – – – – –
Croton sp. – – – – – 2.09 – – – – – –
Garcinia brasiliensis Mart. – 1.90 – – – 0.80 – – – – – –
Gomidesia fenzliana O. Berg – – – – 2.00 – – – – – – –
Heteropterys coleoptera A. Juss. 6.44 6.45 1.45 3.77 2.78 1.14 – – – 0.95 – –
Ilex integerrima (Vell.) Reissk. – 1.68 – 11.45 – 2.20 – – – – – –
Inga maritima Benth. – – – – – 4.81 – – – – – –
Pilocarpus spicatus A. St.–Hil. – – – – – 0.73 – – – – – –
Schinus terebinthifolius Raddi – – – – 0.87 – – – – – – –
Trichilia sp. – – – – 0.98 – – – – – – –
Vernonia crotonoides Sch. Bip 21.25 10.04 14.70 20.43 5.96 6.28 0.80 – 1.27 – – – ex Baker
Waltheria aspera K. Schum. 10.92 1.25 2.27 – 2.21 – – – – 1.17 – –
Amaioua pilosa K. Schum. – 0.96 7.57 1.14 – – – – – – – –
Cupania racemosa (Vell.) Radlk. – 3.89 – – – – – – – – – –
Eugenia ovalifolia Cambess. 1.05 2.51 2.68 – 0.96 – – – 4.63 – – –
Eugenia sulcata Spreng. ex Mart. 2.38 2.53 – 2.93 1.11 1.82 – – – – 1.03 1.26 Gaylussacia brasiliensis (Spreng.) – 1.58 2.19 3.77 – 1.44 – – – – – –
Meisn.
Gomidesia martiana O. Berg 6.92 8.97 7.49 4.98 1.91 3.67 – – – 1.45 – 2.78
Marlieria rubiginosa (Cambess.) – 5.82 – 2.39 – 1.05 – – – – – –
Legrand
Pera glabrata Baill. 3.45 2.03 – – – 0.58 0.85 – 1.82 – – –
Myrsine umbellata Mart. 3.70 – 1.72 – – – – – – – – –
Vernonia rufogrisea A. St.–Hil. – – – 2.63 – – – – – – – –
Group 1b – Typical of Cabiúnas
Norantea brasiliensis Choisy 0.96 0.98 1.29 – 0.15 0.89 0.76 – – 0.95 – – Cupania emarginata Cambess. – – – 1.29 2.11 2.80 0.76 – – 0.92 – 1.26 Eugenia nitida Cambess. 2.73 – 3.27 11.01 1.93 1.20 0.89 6.32 – – 3.40 –
Eugenia olivacea O. Berg – 2.18 – – – 1.44 – – – – 0.91 –
Ouratea cuspidata (A. St.–Hil.) Engl. 1.15 2.05 0.79 5.11 2.49 0.73 2.01 0.74 – 1.01 1.87 1.09 Tapirira guianensis Aubl. 6.59 6.54 6.15 1.17 6.57 6.30 1.67 7.38 – 5.34 – 8.92 Ternstroemia brasiliensis Cambess. 13.51 20.03 3.93 15.10 0.89 4.26 1.36 3.24 6.23 2.68 – 5.47 Group 2 – No site preference
Allophylus puberulus Radlk. – – – – 2.67 0.56 1.78 – – – 2.51 –
Andira legalis (Vell.) Toledo – – – – – 1.28 – 1.37 – –
Byrsonima sericea DC. 4.32 0.96 – 6.61 2.83 1.84 – 0.82 5.96 11.43 – 4.92 Clusia hilariana Schltdl. 31.50 17.06 23.43 25.22 46.78 32.62 34.80 30.84 29.75 30.72 16.40 17.75 Coccoloba arborescens (Vell.) How. 6.48 11.02 – 1.83 14.00 5.08 8.97 5.38 1.02 – 2.52 9.88 Erythroxylum subsessile (Mart.) 11.03 5.58 17.24 3.42 8.66 13.73 10.79 10.32 10.79 9.39 9.22 8.83
O. E. Schulz
Ocotea notata (Nees) Mez 16.86 14.84 21.49 6.91 4.38 1.84 9.41 10.63 7.14 13.31 – 3.62
Ormosia arborea (Vell.) Harms – – – – – 0.58 0.94 – – – – –
Species SA2 SA3 SA5 SA6 SA1 SA4 SA8 SA9 SA11 SA12 SA7 SA10 Xylopia ochrantha Mart. 3.88 3.10 3.78 1.23 1.42 – 5.78 2.15 8.52 3.07 – – Calyptranthes brasiliensis Spreng. – – 3.58 1.35 0.96 0.50 1.07 – 7.33 – – 4.46 Capparis flexuosa (L.) L. – – 1.68 2.84 1.89 3.59 1.76 0.66 – 4.16 16.99 1.22 Coccoloba confusa How. – – 1.24 1.14 3.47 3.42 2.41 – 4.88 – 3.25 4.04 Eugenia umbelliflora O. Berg – 3.79 8.62 2.96 6.22 13.21 2.99 5.48 1.88 1.06 22.99 13.42 Guapira opposita (Vell.) Reitz 4.35 4.35 1.79 3.32 3.33 10.52 5.69 4.73 4.30 – 16.78 17.41 Myrcia lundiana Kiarsk. 6.16 21.81 9.93 11.16 6.17 2.14 34.11 19.36 32.69 36.92 10.28 12.87 Neomitranthes obscura (DC.) 1.02 2.83 5.45 1.20 3.26 1.08 4.24 8.66 9.76 8.45 7.70 5.97
Legrand
Protium heptaphyllum (Aubl.) – – – 2.12 0.81 0.47 – – – – – 6.06
Marchand
Senna pendula (Willd.) H. S. Irwin & – – – 0.95 1.87 – 1.52 – – – 0.77 1.01 R. C. Barneby
Tocoyena bullata Mart. 5.61 – 3.37 6.88 0.82 3.47 5.80 8.24 6.41 10.51 12.75 4.08 Group 3 – Typical of Comprida
Erythroxylum ovalifolium Peyr. 1.63 3.38 – 1.23 4.59 4.91 4.59 7.48 5.90 3.68 20.10 13.96 Heisteria perianthomega (Vell.) – – – 1.01 2.31 1.04 1.16 – 3.51 1.89 21.74 2.27
Sleumer
Kielmeyera membranácea Casar. 1.20 1.33 – – 2.58 – 2.56 3.01 7.35 9.23 2.42 1.30 Manilkara subsericea (Mart.) 4.99 – 2.25 – 0.93 1.19 4.17 4.38 – 6.65 7.73 9.34
Dubard
Maytenus obtusifolia Mart. – – – – 2.67 1.62 3.39 6.65 1.37 – 4.93 –
Abarema langsdorffii (Benth.) – – – – – – – 2.72 – 12.91 – –
R. C. Barneby & J. W. Grimes
Agarista revoluta (Spreng.) . – 3.23 – – – – 0.74 2.86 1.27 2.83 – – J. D. Hooker ex Nied
Andira fraxinifolia Benth. – – – – – – – – 1.53 – – –
Humiria balsamifera (Aubl.) – – – – – – 0.76 – 4.28 1.17 – –
A. St.–Hil.
Vitex polygama Cham. – – – – – – – – – 6.59 – –
continuation
Table 2. Results of nested ANOVA for lagoons, sample areas nested within lagoons, strips nested within sample areas, for each factor: diversity, species richness and plant cover percentage, and the percentage of variation explained by each sampling level: lagoon, sample area and strip (MS = mean square; df = degrees of freedom; F = ANOVA statistic; P = probabilidade).
MS df F P % of variation
Diversity (H’)
Lagoon 0000.0760 01 0.0518 0.8240* 07.5
Sample area 0001.4680 10 1.9820 0.0820* 22.8
Strip 0000.7400 24 1.9930 0.0042* 69.6
Species Richness
Lagoon 0035.8500 01 0.0400 0.8430* 07.8
Sample area 0017.8300 10 2.0100 0.0782* 23.8
Strip 0008.6900 24 2.0500 0.0030* 68.2
% Plant Cover
Lagoon 3505.0000 01 1.3400 0.2730* 16.5
Sample area 2614.5000 10 3.4160 0.0060* 20.0
Strip 0765.1900 24 1.9510 0.0050* 63.3
percent plant cover varied significantly between the sample areas. Nevertheless, there was significant variation in plant cover, diversity and species richness between strips within each sample area. The percentage of variation explained at each sampling level was much higher for the strips, even in relation to plant cover (table 2), therefore variation was higher within than between sample areas.
Discussion
Wiens (1989) showed the limitations of extrapolations concerning processes that occur at one sampling scale to a different scale without a correction for the sampling effort. Although large-scale sampling is important, Condit (1995) also emphasized the importance of dividing sampling effort into smaller units. In this work, we attempted to analyze variation in vegetation structure parameters for an open “restinga” at a large spatial scale, while assessing also the small-scale variation at local level within each sample area. We found that characteristics found in one sample area often could not explain those of the entire community. This clearly indicates the need for a sampling design based on a broader spatial scale as well as on different-sized sampling scales for a better assessment of floristics and vegetation structure of open “restinga” vegetation.
The first question we addressed in this paper was if there is any variation in structural parameters, dominance and species composition between beach ridges in the open Clusia scrub. Although we found
considerable variation between sampled areas as regards species composition and structural parameters, the dominant species were the same throughout: Clusia hilariana and Protium icicariba. For instance, our
large-scale study had a sample size seven times greater than that of a small-scale study (using the line intercept method within a 1 ha area) conducted previously (see Araujo et al. 2004), which resulted in the addition of 17
intermediate and 13 rare species in the former as compared to the latter. However, the dominant plants were the same in both studies.
Moreover, in our study, the oligarchic structure (the concentration of IV in a few species plus many species of lesser importance) found is also common in tropical forest formations, especially in disturbed or early successional communities (Keel & Prance 1979, Campbell
et al. 1986, Pascal & Pélissier 1996), and in other open
vegetation types marginal to the Atlantic rain forest (Scarano 2002). Nevertheless, diversity (H’ = 3.07) is
expectedly lower than that of Atlantic (e.g, Sanchez et
al. 1999) and Amazon rain forests (e.g, Campbell et al.
1992), but surprisingly high considering the extreme environmental conditions these plants are often subjected to (e.g., Scarano et al. 2005). This diversity is, for instance,
higher than that obtained for other open woody “restinga” communities in Southeast Brazil (2.82-2.93; Pereira et al. 2001) sampled by the same method but with the diversity
index calculations based on the number of individuals. Diversity of the shrub layer H’ = 3.45 based on the number
of individuals was even higher (Araujo et al. 2004). These
results are due to the many species with low plant cover that occurred in only a few sample areas. These species were obviously included due to the extensive sampling scale.
The second question we addressed was as to whether this variation was a function of the distance from beach ridge to the sea. Unexpectedly, the variation in percent plant cover between the 12 sample areas was not related to distance from the sea. Thus, oceanicity effects such as those caused by wind and salt exposure, frequently found in coastal plant communities (Crawford 1998), was not responsible for the variation in several other vegetation parameters. This variation was detected in a study by Oliveira-Galvão et al. (1990) aimed at classifying
“restinga” vegetation in this region based on remote sensing. The open Clusia scrub showed two different patterns,
and according to the authors, the differences are in the density and size of the thickets as well as herb cover between thickets. The vegetation at points 6, 7 and 10 in our study area falls into the pattern with fewer, smaller thickets and lower herb cover between the thickets. The most conspicuous band of this open Clusia scrub pattern
begins at the outlet of Comprida Lagoon, and extends to the northeast along the coast, to well beyond the next large lagoon, suggesting that historical factors had considerable influence in the paleo-formation of this sector of the “restinga”. Curiously, the variation in intermediate and rare species composition between sample areas detected by TWINSPAN analysis was related to lagoon proximity. The six sample areas surrounding Cabiúnas lagoon showed a tendency for higher species richness than those surrounding Comprida lagoon (54 vs 45 spp.).
Interestingly, the richness of aquatic plants (Melo & Suzuki 1998), invertebrates (Callisto et al. 1998) and
fish (Reis et al. 1998) in the lagoons is in synchrony with
the results found for the vegetation. Further studies on the dynamics of the triangle terrestrial-vegetation/water-table/lagoon are needed to explain this pattern.
variation in diversity, species richness and plant cover percentage within some beach ridges was higher than the variation between sampling areas. Since ridges are separated from each other by swamp forests, this internal variation could be related to local topography (see Basnet 1992) or ridge breadth and proximity to forests and other vegetation types (e.g., “Restinga de Ericaceae”).
In addition to the answers provided to the central questions of this paper, our results also confirmed Myrtaceae as a key family in the “restinga” flora. It had the highest number of species and two of these, Eugenia umbelliflora and Myrcia lundiana, had high importance
values. High abundance and number of species of Myrtaceae has also been recorded in other “restingas” (Araujo 2000). This pattern is also found in Atlantic forest (Barroso & Peron 1994) and “cerrados” (Proença & Gibbs 1994), which further emphasizes the fact that Myrtaceae is one of the most important families of the Neotropical flora (Landrum & Kawasaki 1997). On the other hand, woody leguminous species had low importance values at this “restinga” site. Leguminosae is also one of the most frequent families at Atlantic Forest sites (Leitão-Filho 1982), including “restinga” ecosystems (Pereira & Araujo 2000), but trees and shrubs of this family are uncommon in open “restingas”. In conclusion, the large sampling scale applied in this study to investigate structural and floristic variation in open “restinga” vegetation revealed that dominant species were common throughout sampling locations although local species richness and composition varied between sites. Within-site variation was often high, which was related to the proximity of neighboring forests. Structural and floristic variation, surprisingly, were not related to the distance from the sea, but to neighboring lagoons. This study emphasizes that the understanding of plant community structure in “restinga” vegetation would benefit from the application of survey methods feasible to be carried out at spatial scales broader than the all too common one-hectare plots.
Acknowledgements – This work was supported by CNPq/ PELD (LTER) program and CT-Petro/FINEP. CAPES and CNPq provided research grants. We thank the staff of NUPEM – Macaé for logistic support.
References
ARAUJO, D.S.D. 1992. Vegetation types of sandy coastal plains of tropical Brazil: a first approximation. In Coastal plant communities of Latin America (U. Seeliger, ed.). Academic Press, San Diego, p.337-347.
ARAUJO, D.S.D. 2000. Análise florística e fitogeográfica das restingas do Estado de Rio de Janeiro. Tese de doutorado, Universidade Federal do Rio de Janeiro, Rio de Janeiro. ARAUJO, D.S.D. & SCARANO, F.R. 2007. Biogeographic features of Clusia with emphasis on South American and especially Brazilian species. In Clusia: a woody Neotropical genus of remarkable plasticity and diversity. (U. Lüttge, ed.). Springer-Verlag, Berlin, p.31-54. ARAUJO, D.S.D., SCARANO, F.R., KURTZ, B.C., ZALUAR,
H.L.T., MONTEZUMA, R.C.M. & OLIVEIRA, R.C. 1998. Comunidades vegetais do Parque Nacional da Restinga de Jurubatiba. In Ecologia das lagoas costeiras do Parque Nacional da Restinga de Jurubatiba e do Município de Macaé (F.A. Esteves, ed.). NUPEM-UFRJ, Rio de Janeiro, p.37-62.
ARAUJO, D.S.D., PEREIRA, M.C.A. & PIMENTEL, M.C.P. 2004. Flora e estrutura de comunidades da restinga de Jurubatiba – síntese dos conhecimentos com enfoque especial para a formação aberta de Clusia. In Pesquisas de longa duração na restinga de Jurubatiba: ecologia, história natural e conservação (C.F.D. Rocha, F.A. Esteves & F.R. Scarano, eds.). Editora Rima, São Carlos, p.59-76. BARROSO, G.M. & PERON, M.V. 1994. Myrtaceae. In Reserva
Ecológica de Macaé de Cima, Nova Friburgo, RJ. Aspectos florísticos das espécies vasculares. (M.P.M. Lima & R.R. Guedes-Bruni, eds.). Jardim Botânico do Rio de Janeiro, Rio de Janeiro, v.1, p.261-302.
BASNET, K. 1992. Effect of topography on the pattern of trees in tabonuco (Dacryodes excelsa) dominated rain forest in Puerto Rico. Biotropica 24:31-42.
BROWER, J.E. & ZAR, J.H. 1984. Field and laboratory methods for general ecology. Wm. C. Brown Publ., Dubuque, Iowa. CALLISTO, M., GONÇALVES JÚNIOR, J.F., LEAL, J.J.F. & PETRÚCIO, M.M. 1998. Macroinvertebrados bentônicos nas lagoas Imboassica, Cabiúnas e Comprida. In Ecologia das lagoas costeiras do Parque Nacional da Restinga de Jurubatiba e do Município de Macaé (F.A. Esteves, ed.). NUPEM-UFRJ, Rio de Janeiro, p.283-310.
CAMPBELL, D.G. 1994. Scale and patterns of community structure in Amazonian forests. In Large-scale ecology and conservation biology (P.J. Edwards, R.M. May & N.R. Webb, eds.). Blackwell, Oxford, p.179-197. CAMPBELL, D.G., DALY, D.C., PRANCE, G.T. & MACIEL,
U.N. 1986. Quantitative ecological inventory of terra firme and várzea tropical forest on the Rio Xingu, Brazilian Amazon. Brittonia 38:369-393.
CAMPBELL, D.G., STONE, J.L. & ROSAS, A. 1992. A comparison of the phytosociology and dynamics of 3 floodplain (várzea) forests of known ages, Rio-Juruá, western Brazilian Amazon. Botanical Journal of the Linnean Society 108:213-237.
CONDIT, R.1995. Research in large, long-term tropical forest plots. Trends in Ecology and Evolution 10:18-22. CRAWFORD, R.M.M. 1998. Shifting sands: plant survival in
DIAS, A.T.C. & SCARANO, F.R. 2007. Clusia as nurse plant. In Clusia: a woody Neotropical genus of remarkable plasticity and diversity. (U. Lüttge, ed.). Springer-Verlag, Berlin, p.55-71.
DIAS, A.T.C., ZALUAR, H.L.T., GANADE, G. & SCARANO, F.R. 2005. Canopy composition influencing plant patch dynamics in a Brazilian sandy coastal plain. Journal of Tropical Ecology 21:343-347.
EHRENFELD, J.G. 1990. Dynamics and processes of barrier island vegetation. Reviews in Aquatic Sciences 2:437-480.
ESPEJEL, I. 1992. Coastal sand dune communities and soil relationships in the Yucatan Peninsula, Mexico. In Coastal plant communities of Latin America. (U.Seeliger, ed.). Academic Press, San Diego, p.323-335.
FRANCO, A.C., HAAG-KERWER, A., HERZOG, B., GRAMS, T.E.E., BALL, E., de MATTOS, E.A., SCARANO, F.R., BARRETO, S., GARCIA, M.A., MANTOVANI, A. & LÜTTGE, U. 1996. The effect of light levels on daily patterns of chlorophyll fluorescence and organic acid accumulation in the tropical CAM tree Clusia hilariana. Trees 10:359-365.
HAY, J.D., HENRIQUES, R.P B. & LIMA, D.M. 1981. Quantitative comparisons of dune and fore dune vegetation in restinga ecosystems in the state of Rio de Janeiro, Brazil. Revista Brasileira de Biologia 41:655-662. JALONEN, J., MAJAMA, V.I. & TONTERI, T. 1998. Optimal
sample and plot size for inventory of field and ground layer vegetation in a mature Myrtillus-type boreal spruce forest. Annales Botanici Fennici 35:191-196.
KEEL, S.H.K. & PRANCE, G.T. 1979. Studies of the vegetation of a white-sand black-water igapó (Rio Negro, Brasil). Acta Amazonica 9:645-655.
LACERDA, L.D., ARAUJO, D.S.D. & MACIEL, N.C. 1993. Dry coastal ecosystems of the tropical Brazilian coast. In Dry coastal ecosystems: Africa, America, Asia, Oceania (E. van der Maarel, ed.). Elsevier, Amsterdam, p.477-493. LANDRUM, L.R. & KAWASAKI, M.L. 1997. The genera of Myrtaceae in Brazil: an illustrated synoptic treatment and identification keys. Brittonia 49:508-536.
LEITÃO-FILHO, H.F. 1982. Aspectos taxonômicos das florestas do Estado de São Paulo. Silvicultura em São Paulo 16a:197-206.
MAGURRAN, A.E. 1988. Ecological diversity and its measurement. Croom Helm, London.
MARTIN, L., SUGUIO, K. & FLEXOR, J.-M. 1993. As flutuações de nível do mar durante o quaternário superior e a evolução geológica de “deltas” brasileiras. Boletim do Instituto de Geologia-USP, 15 (Publicação Especial):1-186. MELO, S. & SUZUKI, M.S. 1998. Variações temporais e espaciais do fitoplâncton das lagoas Imboassica, Cabiúnas e Comprida. In Ecologia das lagoas costeiras do Parque Nacional da Restinga de Jurubatiba e do município de Macaé (F.A. Esteves, ed.). NUPEM-UFRJ, Rio de Janeiro, p.177-203.
MENEZES, L.F.T. & ARAUJO, D.S.D. 1999. Estrutura de duas formações vegetais do cordão externo da restinga de Marambaia, RJ. Acta Botanica Brasilica 13:115-236. MÜLLER-DOMBOIS, D. & ELLENBERG, H. 1974. Aims
and methods of vegetation ecology. New York, John Wiley.
MYERS, N., MITTERMEIER, R.A., MITTERMEIER, C.G., FONSECA, G.A.B. & KENT, J. 2000. Biodiversity hotspots for conservation priorities. Nature 403:853-858.
NASCIMENTO, H.E.M., DIAS, A.S., TABANEZ, A.A.J. & VIANA, V.M. 1999. Estrutura e dinâmica de populações arbóreas de um fragmento de floresta estacional semidecidual na região de Piracicaba, SP. Revista Brasileira de Biologia 59:329-342.
OLIVEIRA-GALVÃO, A.L.C., GALVÃO, W.S. & CARVALHO, V.C. 1990. Monitoramento da cobertura vegetal da restinga de Carapebus – Macaé (RJ), a partir de imagens orbitais. In Anais do II Simpósio de Ecossistemas da Costa Sul e Sudeste Brasileira: esturtura, função e manejo. (S. Watanabe, coord.). Aciesp, São Paulo, v.3, p.442-454.
PASCAL, J.P. & PÉLISSIER, R. 1996. Structure and floristic composition of a tropical evergreen forest in south-west India. Journal of Tropical Ecology 12:191-210.
PEREIRA, M.C.A., ARAUJO, D.S.D. & PEREIRA, O.J. 2001. Estrutura de uma comunidade arbustiva da restinga de Barra de Maricá–RJ. Revista Brasileira de Botânica 24: 273-281.
PEREIRA, M.C.A., CORDEIRO, S.Z. & ARAUJO, D.S.D. 2004. Estrutura do estrato herbáceo na formação aberta de Clusia do Parque Nacional da Restinga de Jurubatiba, RJ, Brasil. Acta Botânica Brasílica 18:677-687.
PEREIRA, O.J. & ARAUJO, D.S.D. 2000. Análise florística das restingas dos estados do Espirito Santo e Rio de Janeiro. In Ecologia de restingas e lagoas costeiras (F.A. Esteves & L.D. Lacerda, eds.). NUPEM-UFRJ, Rio de Janeiro, p.25-63.
PITMAN, N.C.A., TERBORGH, J., SILMAN, M.R. & NUNEZ, P.V. 1999. Tree species distributions in an upper Amazonian forest. Ecology 80:2651-2661.
PROENÇA, C.E.B. & GIBBS, P.E. 1994. Reprodutive biology of eight sympatric Myrtaceae from Central Brazil. New Phytologist 126:343-354.
REIS, R.A., AGUIARO, T & CARAMASCHI, E.P. 1998. Distribuição espacial da ictiofauna nas lagoas Cabiúnas e Comprida. In Ecologia das lagoas costeiras do Parque Nacional da Restinga de Jurubatiba e do município de Macaé (F.A. Esteves, ed.). NUPEM-UFRJ, Rio de Janeiro, p.37-62.
SANCHEZ, M, PEDRONI, F, LEITÃO-FILHO, H.F. & CÉSAR, O. 1999. Composição florística de um trecho de floresta ripária na Mata Atlântica em Picinguaba, Ubatuba, SP. Revista Brasileira de Botânica 22:31-42.
SCARANO, F.R. 2002. Structure, function and floristic relationships of plant communities in stressful habitats marginal to the Brazilian Atlantic Rainforest. Annals of Botany 90:517-524.
SCARANO, F.R., CIRNE, P., NASCIMENTO, M.T., SAMPAIO, M.C., VILLELA, D., WENDT, T. & ZALUAR, H.L.T. 2004. Ecologia Vegetal: integrando ecossistema, comunidades, populações e organismos. In Pesquisas de longa duração na restinga de Jurubatiba: ecologia, história natural e conservação (C.F.D. Rocha, F.A. Esteves & F.R. Scarano, eds.). Editora Rima, São Carlos, p.77-97.
SCARANO, F.R., DUARTE, H.M., FRANCO, A.C., GESSLER, A., de MATTOS, E. A., RENNENBERG, H. & LÜTTGE, U. 2005. Physiological synecology of tree species in relation to geographic distribution and ecophysiological parameters at the Atlantic forest periphery in Brazil: an overview. Trees, Structure and Function 19:493-496. SHRADER-FRECHETTE, K.S. & McCOY, E.D. 1993. Method
in ecology. Cambridge University Press, Cambridge. VALENTIN, J.L. 2000. Ecologia numérica. Editora Interciência,
Rio de Janeiro.
WORLD CONSERVATION MONITORING CENTRE (WCMC) 1992. Global biodiversity: status of the Earth’s living resources. Chapman & Hall, London.
WIENS, J.A. 1989. Spatial scaling in ecology. Functional Ecology 3:385-397.