Variability of Noise Levels from Railways
Vitor Rosão1, Eusébio Conceição1, Teresa Marques2 1
Faculdade de Ciências e Tecnologia da Universidade do Algarve Campus de Gambelas
8005-139 FARO - PORTUGAL Tel.: 289800100 | Fax: 289800072 {[email protected]; [email protected]}
2
Schiu, Engenharia de Vibração e Ruído, Unip., Lda. Avenida Villae de Milreu, Bloco E, Estoi
8005-466 FARO - PORTUGAL Tel.: 289998009 | Fax: 289998318
Abstract
The purpose of this study is to determine the variability of noise levels associated with the pass-by of the same type of train at a point, near a railway, and compare this variability with the standard uncertainty, due to the operation of the source, established in ISO 1996-2: 2007, and in the document ―Determination of Lden and Lnigth Using Measurements: 2006‖, from the European Work Group IMAGINE. With these results we can know the measurement effort required to achieve a certain standard uncertainty.
Keywords: Railway noise, measurement uncertainty.
1 Introduction
Measurements were made along the Railway Line in the Algarve (Portugal) on two points: one point near the Faro station (Point 1), where it is expected a higher variability of speed of trains and, subsequently, greater variability in the noise levels, and one point away from stations (Point 2), where it is expected a lower variability of train speeds and, subsequently, a lower variability of noise levels.
Class 1 integrating sound level meter: Solo 01 dB (Point 1) and NA27 Rion (Point 2).
Speedometer: Speed Gun Bushnell (precision ± 2 km/h).
2 Results
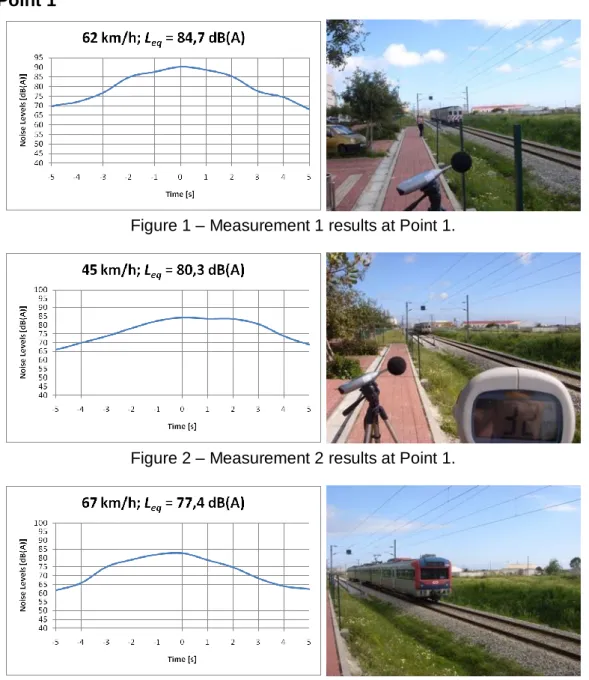
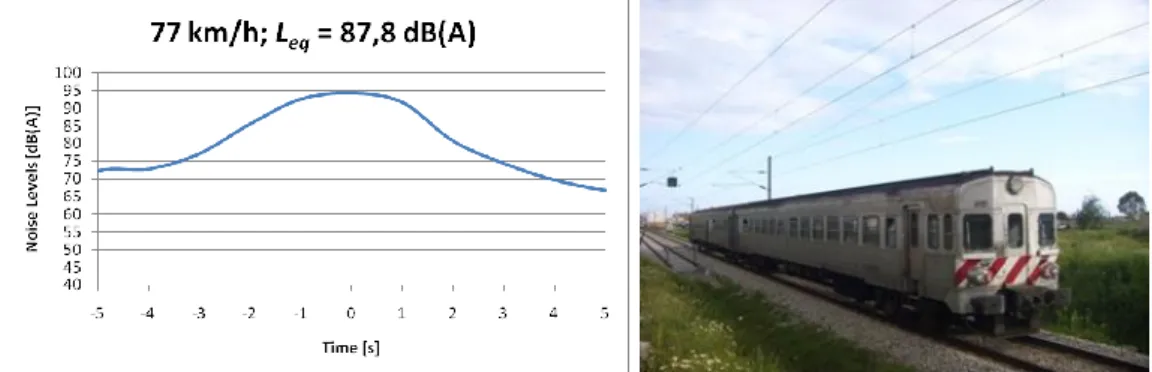
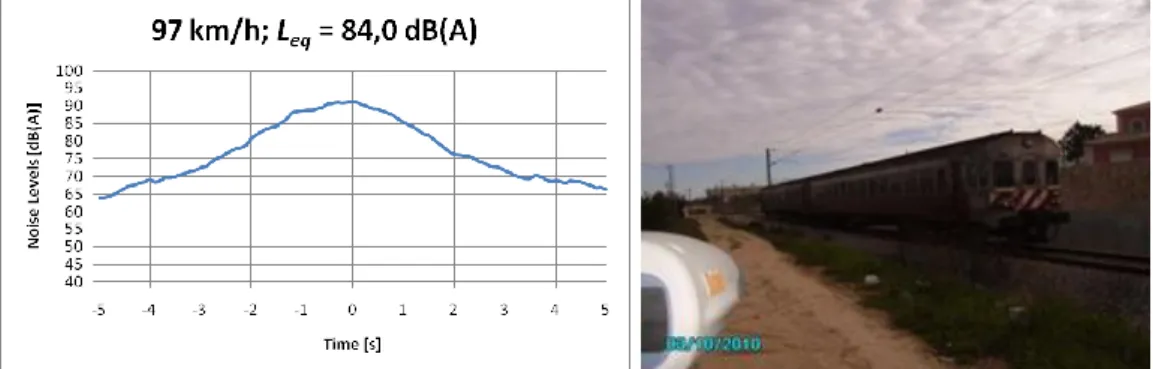
Are presented in the following Figures the results at the pass-by of trains in terms of variation of noise levels over time (between -5 and 5 seconds relative to the occurrence of the maximum value), equivalent continuous noise level of this range, and maximum operating speed of the train, and its photo, at Point 1 (Figure 1 to 5) and at Point 2 (Figure 6 to 10).
2.1 Point 1
Figure 1 – Measurement 1 results at Point 1.
Figure 2 – Measurement 2 results at Point 1.
Figure 4 – Measurement 4 results at Point 1.
Figure 5 – Measurement 4 results at Point 1.
2.2 Point 2
Figure 8 – Measurement 3 results at Point 2.
Figure 9 – Measurement 4 results at Point 2.
Figure 10 – Measurement 5 results at Point 2.
3 Uncertainty
According to [1] we have that the combined standard uncertainty ut, for a given measurement
of environmental noise, is given by: 2 2 2 2 0 , 1 X Y Z ut (1)
Where 1,0 is the standard uncertainty of the measuring instrument of class 1, X the standard uncertainty associated with the operating conditions, Y the standard uncertainty associated with weather and soil, and Z the standard uncertainty associated with the residual noise.
X should be determined by at least three and preferably five, measurements under repeatability conditions (same measurement procedure, the same instrument, same operator, same place) in a position where the variation of atmospheric conditions and residual noise are little influence on results.
The measuring points of this study verify this condition, so it is considered Y = 0 and Z = 0. According to reference [2] we can calculate the standard uncertainty u of the measurements by the following equations, where n represents the number of measurements, the standard deviation, xi the result of each measurement and
x
the arithmetic mean:n u
(2)
1
2 2 2 2 1 n x x x x x x n
(3)Are presented in Table 1, the Leq values obtained, the arithmetic mean of Leq (<Leq >),
standard deviation and standard uncertainty associated.
Table 1 – Results, Standard Deviation and Standard Uncertainty.
Leq <Leq> Standard Deviation Standard Uncertainty
Point 1 Point 2 Point 1 Point 2 Point 1 Point 2 Point 1 Point 2
84,7 dB(A) 83,4 dB(A)
82,5 dB(A) 84,3 dB(A) 4 dB(A) 0,9 dB(A) 1,8 dB(A) 0,4 dB(A) 80,3 dB(A) 85,5 dB(A)
77,4 dB(A) 84,0 dB(A) 87,8 dB(A) 83,8 dB(A) 82,1 dB(A) 85,0 dB(A)
Assuming a coverage factor of 2 (confidence level of 95%), the expanded uncertainty is given by 2u, then we can write [1] [2]:
Point 1:
o Leq = 83 ± 4 dB(A).
Point 2:
o Leq = 84,3 ± 0,8 dB(A).
3.1 Comparison with ISO 1996-2
The reference [1] states in section 6.3.1 which should be characterized at least the passage of 20 trains.
Assuming the maintenance of the standard deviations obtained in the measurements, it appears that, for 20 measurements at each point, would be expected the following standard uncertainties: Point 1: o 0,9 20 4 u dB(A).
Point 2: o 0,2 20 9 , 0 u dB(A).
In the case of Point 1 where there is less stability, we would have a standard uncertainty of the magnitude of the standard uncertainty of the measuring instrument, and at Point 2, where there is greater stability, we would have a standard uncertainty smaller than the standard uncertainty of the measuring instrument, which may indicate that was not necessary to characterize such a large number of trains when there is greater stability.
Since it is expressed the standard uncertainty of the measurements are not apparent reasons for that can not be held less than 20 measurements.
3.2 Comparison with IMAGINE
The reference [3] states in Section 7.3 to use a standard deviation of 5 dB (A), if we take into account the type of train, which corresponds to a value similar to that given in Point 1, and a value significantly higher than the determined at the Point 2. So, the standard deviation set out in document IMAGINE corresponds to a value significantly increased for situations of greater stability (as in Point 2). Cannot however be excluded that may correspond to a value decreased in situations of lower stability than that occurring at Point 1.
3.3 Other types of train
Since normally circulate more than one type of train, it is important to know how to determine the uncertainty associated with global value.
Assuming that ui is the standard uncertainty associated to the train type i (determined by
equations (2) and (3)), Leq,i is the equivalent continuous noise level associated with the
pass-by of the train type i, ti the time associated with Leq,i, and mi the number of trains running in a
given period T, we have:
T A Leq 10log (4) 10 10 2 2 10 1 1 , 2 , 1 , 10 10 10 log 10 i eq eq eq L i i L L t m t m t m A (5)According to reference [4] we can write the resulting standard uncertainty u using the following equation: 2 , 2 2 2 , 2 1 1 , i i eq eq eq eq eq eq u L L u L L u L L u (6)
10 2 10 2 2 10 2 2 2 1 10 1 1 10 10 10 10 , 2 , 1 , A i L i i L L u t m u t m u t m u i eq eq eq (7)
The expression (7) thereby takes into account the greater or lesser influence of a particular type of train in the overall noise level.
For example, suppose, for simplicity, the following:
n1 = n2 = 1. t1 = t2 = 1. Leq,1 = 90 dB(A). Leq,2 = 50 dB(A). u1 = 1 dB(A). u2 = 10 dB(A). It follows therefore: 90 10 10 log 10 10 50 10 90 A dB(A) (8) 1 10 10 10 1 10 10 90 10 50 10 90 u dB(A) (9)
Prevails the standard uncertainty associated to the train type 1, since the noise level is much higher than that associated with the train type 2.
4 Measurement effort
We think that can be established two methods of measurement effort: 1. Constant effort of measurement:
In this methodology the effort is always equal and therefore is vary the standard uncertainty of measurement results. For example, if it is established that they should always be perform three measurements of each type of train, the standard uncertainty of measurement will depend on the standard deviations that are encountered in the measurement.
2. Variable measuring effort towards a goal of standard uncertainty:
In this methodology the effort is variable, i.e., you need a larger or a smaller number of measurements to achieve one standard uncertainty of measurement. For example, if it is established the need to achieve a standard uncertainty of 3 dB (A), the number of measurements that will be needed will depend on the standard deviation of the measurements.
5 Conclusions
This study showed that in situations of greater stability the minimum number of measurements stated in ISO 1996-2 [1] may lead to very low standard uncertainties, so, in these cases, may be sufficient to do fewer measurements.
This study showed too how to calculate the global standard uncertainty if you measure separately each type of trains and to know what type of trains are more important to the overall results in terms of uncertainties.
Acknowledgments
We tanks to Liliano Abreu o helps in the measurements.
References
[1] ISO, International Standard 1996-2: Acoustics — Description, measurement and assessment of environmental noise – Part 2: Determination of environmental noise levels. 2007.
[2] ISO/IEC Guide 98-3: Uncertainty of measurement – Part 3: Guide to the expression of uncertainty in measurement (GUM:1995). 2008.
[3] Improved Methods for the Assessment of the Generic Impact of Noise in the Environment - Determination of Lden and Lnight using measurements. 2006.
[4] Taylor, John R. - An Introduction to Error Analysis: The Study of Uncertainties in Physical Measurements. University Science Books, 1997.