Spatial Databases for Decision Support in Agriculture
ERIC DE NORONHA VAZ
Instituto Superior de Estatística e Gestão da Informação, Universidade Nova de Lisboa
Centro de Investigação sobre o Espaço e as Organizações, Universidade do Algarve
PORTUGAL
TERESA DE NORONHA VAZ
Faculdade de Economia e Centro de Investigação sobre o Espaço e as Organizações,
Universidade do Algarve, Faro
PORTUGAL
mtvaz@ualg.pt
Abstract: - The Portuguese agriculture has experienced phases of change and its adaptation to the Common
Agriculture Policy. Although serious problems have subsisted as structural difficulties in spite of the many public aids, it seems that, slowly, agricultural productivity increased, integrating some technological progress. However, other expectations related to food auto sufficiency or a more balanced equilibrium in the food trade were however, not achieved. For that study, after having desegregated possible determinants of growth for the agricultural sector, the econometric results showed a stationary tendency for all the vegetal production variables; contrarily, some of the detected growth factors were correlated to animal production, particularly to pork, poultry and milk production.Beside, the classical econometrics, new methods could allow us to a more in depth analysis of the state in the Portuguese agricultural activities. Our research uses Geographic Information Systems to those prompt spatial databases for monitoring land use change. This short essay opens prospects for a much better understanding of rurality when all those factors contributing to its sustainability, much broader than agricultural activities will be evaluated under the methods earlier described.
Key-Words: -Common Agriculture Policy, rural, Geographic Information System, land use change.
1 Introduction
Since the eighties the Portuguese agriculture has experienced phases of change and its adaptation to the Common Agriculture Policy (CAP) points out for some in depth developments. Although serious problems have subsisted as structural difficulties in spite of the many public aids, it seems that, slowly, agricultural productivity increased, integrating some technological progress (Table 1). However, other expectations related to food auto sufficiency or a more balanced equilibrium in the food trade were however, not achieved (Table 2).
Table 1. Southern European countries labour productivity in the primary sector, for the period 1987 – 1997 Country 1987 (UM/UAL) 1997 (UM/UAL) % change Portugal 4075 4900 20,2 Spain 8653 15452 78,6 Italy 13041 22469 72,3 Greece 6410 8656 35,0 France 16395 28483 73,7
Source: European Commission, EUROSTAT
The Portuguese consumption was increasingly composed of imports, more significant in the food industry than in the agricultural production, as it can be seen by the loss of self-sufficiency shown in the data below.
Table 2. Level of self sufficiency for the Food Sector, for the period 1980 – 2000
Sectors 1980 1985 1990 1995 2000 Agriculture 78.4 75.9 80.8 74.6 74.9 Food Industry 93.8 94.1 90.1 85.1 83.6 Food Sector 86.7 83.2 86.4 81.3 80.7
Source: INE, Agricultural Statistics and National
Accounts
In summary, after 1986 and due to Portugal’s integration in the European Community (EC) most of the agricultural commercial flows took place within the European common market with two consequences: Firstly, an increase in the consumption levels of food and its consequent raise in associated imports; Secondly, international food distribution chains located gradually in the country and accessed
great part of the Portuguese population, first in big towns, then in small ones. Both factors drove Portuguese consumption patterns towards those of the other European countries at a time when producers and industrials were still not ready to move into new productive processes and new commercial chains.
So far, it is important to realize that while the agricultural production slowly tried to adapt to a new reality by changing into innovative productive forms, most of the national food industry was absorbed by big international companies. Table 3 shows the growth in the agricultural sector for the period 1981 – 1997 and compares several European countries.
Table 3. Growth of the Agricultural Sector, for the period 1981 – 1997 (%).
Countries GAV Vegetal production Animal production EU 15 1.83 2.04 1.15 Portugal 2.40 2.27 2.60 Spain 1.89 2.12 1.15 Italy 0.59 0.38 0.57 Greece 0.57 0.94 0.26 France 1.86 2.26 0.48 At constant prices 1990
Source: Own calculations from European Commission,
EUROSTAT and DGA, Ministery of Agriculture and Fisheries, different periods [1, 2].
Following Girão [3] this evolution of the Portuguese agriculture can be evaluated at an aggregated level, however not allowing drawing any conclusions of major trends that may have resulted from innovative processes in the sector. For that study, after having desegregated possible determinants of growth for the agricultural sector, the econometric results showed a stationary tendency for all the vegetal production variables; contrarily, some of the detected growth factors were correlated to animal production, particularly to pork, poultry and milk production.
2 Methodology
Beside, the classical econometrics, new methods could allow us to a more in depth analysis of the state in the Portuguese agricultural activities. Our research uses Geographic Information Systems (GIS) to those prompt spatial databases for monitoring land use change. Example of this is the CORINE (COoRdination of INformation on the Environment) Land Cover Project corresponds to a database with land use information regarding European soil. This database is of much importance, as the initial project CORINE Land Cover 1990 (CLC90) managed to
have a predecessor CORINE Land Cover 2000 (CLC00) allowing dynamic assessment of land use / cover change between a certain time period for 25 ha resolution cells. Combined to the main advantage of Geographic Information Systems (GIS) as tools to analyze, maintain and manipulate spatial data [4], allowed spatial cognizance of land use / land change phenomena at a more specific level and resulting analysis of changing environment dynamics.
At a 1:100000 scale, three levels can be separated for CLC. At the more general level we may assess artificial surfaces, agricultural areas, forests and semi-natural areas, wetlands and water bodies. Subsequent ungrouping of classes, will lead to a total of 44 available classes which adopt the common CORINE nomenclature [5].
Land use change is a phenomenon which has reached a larger intensity in recent years due to human action on natural environment. Examples of land use change and environmental endangerment is for instance urban growth which jeopardizes cultural and natural landscapes. [6].
Urban growth carries as a consequence the tendency to change land cover in its vicinities, as natural ecosystems tend to become adapted to the necessities of man’s growing cities. In this sense, it becomes even more important to understand land use change in other CLC classes besides urban growth.
CLC90 and CLC00 were synthesized by filtering only the desired land classes. The existent CAOP (Carta Administrativa Oficial de Portugal – Official Administrative Portuguese Map) allowed defining NUTS II boundaries and assembling a conversion of the original vector data into raster format in pixel units. Raster format data allowed the quantification and establishment of relative percentages per class giving us a cross tabulation matrix of change regarding CLC90 and CLC00 comparison. This effort permitted quantification and observation of dynamics of change regarding the agricultural classes of non-irrigated arable land, permanently non-irrigated land, rice fields, vineyards, fruit trees and berry plantations and olive groves.
3 Dynamics of rural change
In Portugal and since its integration into the EC in 1986, the CAP was the main instrument to promote both rural and regional development by means of increasing production of agricultural activities. Those measures, practiced at the time, have been the bastion of growth and development for so many European agricultural regions but their support in Portugal did not reflect the expected positive results.
Arguments have suggested that CAP was clearly designed for Northern regions with a protective policy towards products such as cereals and milk, putting apart those with more southern characteristics, such as wine, olive or horticultural productions. However, other reflections aware of the nature of the overall policy context in Portugal, suggest that much beyond a restrictive tendency resulting from the lack of an adequate specific support system, also a fragile governance structure missed those essential contributions typical from a modernized agriculture: Marketing and improving associative efforts should have been promoted by a clear national agricultural policy.
We have observed the effective changes in the use of land for agricultural proposes at a period in which CAP was at its fullest in the country and created the pillars of the reformed measures: single payment entitlements, decoupling, modulation, and cross-compliance were after 2003, the new instruments for a two step model in which the European Commission expects to create a progressive scheme as well as to dismantle the planting rights in order to achieve a more sustainable rural development. This reform, started in 2003, has completely changed the way how the EU has previously supported its farm sector. In a trial to give EU farmers the freedom to produce what the market needs, the vast majority of subsidies support independently from the volume of production and in conformity with the goals of sustainable development even if this includes land abandonment. Thus, today, the bigger those extensions of arable lands have been used in the past, the greater the advantages for the present and future.
Considering the five NUTS 2 Portuguese regions of Portugal (excluding the islands), Norte, Centro, Lisboa e Vale do Tejo, Alentejo and Algarve, several conclusions can be drawn:
1) For all the regions, with exception of Algarve, non-irrigated annual crops are those ones to have major expression. Certainly, Alentejo is the region with highest used land for this crop. Decreasing the total cultivated area from 75% to 70% we can see that the region was not able to fully benefit from the FEOGA support systems. When comparing the data for all the regions we realize that both Norte and Centro took more advantage of them; 2) Notwithstanding the previous fact, there is a significant decreasing tendency to grow non-irrigated annual crops in all the Portuguese regions;
3) Permanently irrigated land increased significantly in Lisbon, Centro and Alentejo justifying the flourishing production of some horticultural crops;
4) Those traditional Portuguese rice fields kept unchanged for the observed period;
5) Although wine production augmented significantly in Portugal, the fact is that the area occupied with vineyards stayed constant with exception of Alentejo and Algarve. The main reason for this is the fact that land for vineyards is restricted to governmental licensing and not to market pressures. Both cases indicate that a more rational and productive production processes started its way during the period with very positive impacts during the following years;
6) While the growth of olive trees stayed constant, in general, significant increases in the pasture lands can be detected;
7) Three regions have mainly contributed to the national increases in consumption of animal products: The northern part with increases of about 5% of landed allocated to pastures, the Lisbon and Tagus Valley region with 3% increase and surprisingly, Algarve with 1% increase.
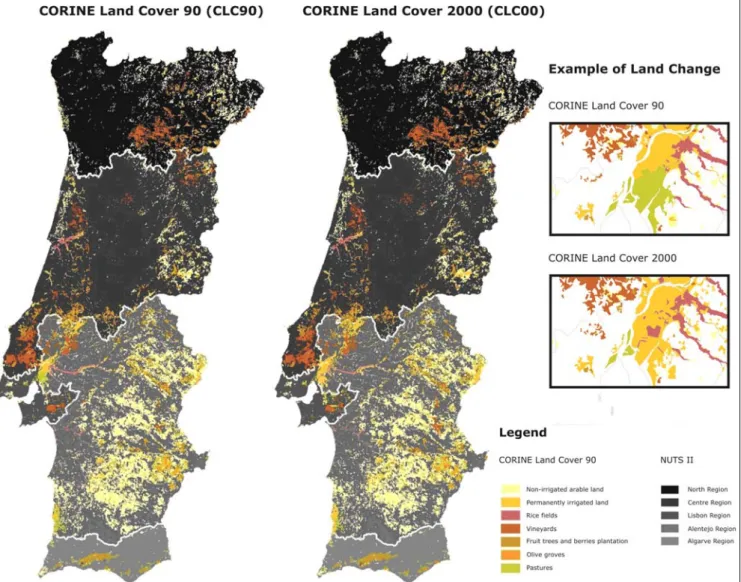
Just a note to refer that the reported percent changes refer the variations over the global values per regions and reflect the relative losses and gains of used land in each region and for each sector. We are not using the absolute values in our present comments. Figure 1 illustrates the changes taking place for the period 1990 – 2000, in total areas of arable land (non-irrigated arable land, permanently irrigated land, rice fields), permanent crops (vineyards, fruit trees and berry plantations, olive groves), and pastures. The few observed changes show the different propensities of regions to adapt to the same CAP instruments originating consequent distinct regional trends for each one of those sectors.
An attentive observation of the used surface by region in agricultural activities shows us that the application of the CAP had a clear impact on the extension of the vineyards for the northern region increasing the cultivated area on about 3%. This corroborates the idea that wine production significantly expanded in the Douro area, which has been strongly fighting for brands recognized for its quality. In this region the other crops have decreased used surface, not necessarily meaning a decrease in production, but justifying that policies did not serve to motivate producers further than they have been motivated.
The central region changed clearly the use of land: The use of CAP instruments resulted in a transfer of land used for non irrigated crops towards irrigated ones (2% land used) and relocation of areas voted to olive plantations into vineyards (1%).
The region of Lisbon, which integrates the Tagus Valley, is the one to have shown the most intensive
change in the allocation of land to different crops: First reducing in 13% the use of non irrigated crops, and secondly by starting to put away part of the traditional production of rice fields in benefit of vineyards. We should refer the existence of a significant increase (11% expresses the most significant change when crossing sectors and regions) in new irrigated productions. It may be opportune to explain that this region has a path of tomato processing industrial production which may serve to suggest the existence of a potential cluster related to the food industry in the long run. The other very interesting result for this region is the increase in pastures (3%), showing that three regions have mainly contributed for the new Portuguese northern diet: Norte (5% new land re-allocated to pastures) and Algarve (1%).
Table 4. Changes in the arable land, for the period 1990 – 2000 Pixels CLC 1990 CLC 2000 Variations Dry lands 26990602 25507406 -0,05 Irrigated lands 2339182 3777313 0,61 Rice fields 1087249 1017616 -0,06 Vineyards 4162182 4835550 0,16 Fruit trees 2203939 2307955 0,05 Olive 6371394 6201831 -0,02 Pasture lands 830552 897855 0,08 Totals 43985100 44545526 0,01
Source: Own calculations
The deviations taking place in the Algarve show that there is an increase in the use of land for irrigated crops, pastures and particularly, for vineyards; all this at the cost of fewer plantations of fruit trees, namely orange trees, and non irrigated crops.
An overall view of the global data indicated that the land used in Portugal for agricultural activities has expanded in all the five considered regions: 3.40% in the northern region, 1,01% in the central area, 1.02% in Lisbon and Tagus Valley area, 1,01% in Alentejo and 1,04% in Algarve. Altogether that expansion has a reduced significance, representing about 1,3% increase. However, when considering each of the agricultural sectors, dry land cultures have been put apart giving place to an increase of 61% land used for irrigated crops. Also vineyards, traducing an efficient use of CAP results have expended 16% and pasture lands 8%, reflecting the new Portuguese consumption tendencies.
4 Final considerations
This study confirms, from a different perspective, those conclusions raised by Vaz [7, 8], indicating the lack of efforts able to challenge those trends driving Portuguese agriculture out of a no-return way. Some, few agricultural products, however survived to an internal economic policy that for decades promoted services ahead the industry.
The results are identified in the MAPs I and II. Both represent the effective surface used for agricultural activities in Portugal, illustrating how it has modified during the decade in which Portugal most profited from its integration in the EC. Not so many changes to find.
The reasons for this situation are related to both the lack of strategies linking food industry to agricultural production, and the fact that a great majority of producers were unable to combine forces and create those structures required for commercializing their products, in spite of the specific European support schemes given to producer organizations. Notwithstanding, cork, wine and a few fruits were able to adapt to new market tendencies.
Using Geographic Information Systems to identify those changes occurred in the use of agricultural land between 1990 and 2000, few restrictions should be accepted: i) the generalization of certain CORINE Land Cover presented classes due to the Minimum Mapping Unit (MMU) of 25 ha, also leads to a certain fuzziness in assumption of land use change (LUC). This paradigm of LUC comparison is always present and should be considered in a context of the scope of study. In our case, as dynamics are assessed at national level, we conclude that MMU doesn’t interfere much, as the study in itself is more at a macro scale.
Fortunately, CAP has now a new vision, searching for alternative forms to better sustain the rural world which is not, fortunately, solely based upon agricultural production. The multifunctional agriculture should be faced in Portugal as a major challenge and a possible solution to keep population in those rural-interior areas that once were in charge of agricultural production. This short essay opens prospects for a much better understanding of rurality when all those factors contributing to its sustainability, much broader than agricultural activities will be evaluated under the methods earlier described.
References
[1] DGA, Ministry of Agriculture and Fisheries, different years
[2] Instituto Nacional de Estatistica, INE, Agricultural Statistics and National Accounts for Portugal
[3] Girão, J. A., A Agricultura Portuguesa: Em Passeio Aleatório ou em Regime Estacionário? in Instituto, Financeiro, Agricultura ,Economia e Sociedade, 2001, Lisboa, IFADAP, 2001
[4] Longley, P. A.; Goodchild, M. F.; Maguire, D. J.; Rhind, D. W. (Eds) Geographic Information Systems and Science, John Wiley & Sons, 2nd Edition, 2005
[5] Paínho, M.; Caetano, M., Cartografia de Ocupação do Solo: Portugal Continental, 1985-2000: CORINE Land Cover 2000, Instituto do Ambiente, 2006
[6] Vaz, E; Nijkamp. P. Historico-cultural sustainability and urban dynamics – A
geo-information science approach to the Algarve area in Giovanni Maciocco (Ed.), Place for Leisure/Place for the City, Series: Urban and Landscape Perspectives, Springer Verlag, in print, 2008
[7] Vaz, E. GIS from a Cultural Heritage Perspective: When Past and Future Collide, MSc Thesis, Superior Institute of Statistics and Information Management, New University of Lisbon, 2008
[8] Vaz, M.T.N. The Portuguese Agriculture and Fisheries at the Start of the Millennium: Is there a way out? Options Mediterraneennes, CIHEAM e FAO, Montpellier, France, in print, 2008.
Figure 1. Changes taking place for the period 1990 – 2000, in total areas of arable land (non-irrigated arable land, permanently irrigated land, rice fields), permanent crops (vineyards, fruit trees and berry plantations, olive groves), and pastures.