doi: 10.3389/fmars.2017.00318
Edited by: Tilmann Harder, University of Bremen, Germany Reviewed by: Rémi M. Daigle, Laval University, Canada Mario Barletta, Federal Rural University of Pernambuco, Brazil Robin Faillettaz, Lille University of Science and Technology, France *Correspondence: Pedro Morais [email protected]
Specialty section: This article was submitted to Marine Ecosystem Ecology, a section of the journal Frontiers in Marine Science Received: 27 April 2017 Accepted: 19 September 2017 Published: 13 October 2017 Citation: Morais P, Parra MP, Baptista V, Ribeiro L, Pousão-Ferreira P and Teodósio MA (2017) Response of Gilthead Seabream (Sparus aurata L., 1758) Larvae to Nursery Odor Cues as Described by a New Set of Behavioral Indexes. Front. Mar. Sci. 4:318. doi: 10.3389/fmars.2017.00318
Response of Gilthead Seabream
(Sparus aurata L., 1758) Larvae to
Nursery Odor Cues as Described by
a New Set of Behavioral Indexes
Pedro Morais1, 2*, María P. Parra2, Vânia Baptista2, Laura Ribeiro3,
Pedro Pousão-Ferreira3and Maria A. Teodósio2
1Department of Environmental Science, Policy, and Management, Mulford Hall, University of California, Berkeley, Berkeley, CA, United States,2Centre of Marine Sciences (CCMAR), University of Algarve, Faro, Portugal,3Aquaculture Research Station (EPPO), Portuguese Institute for the Ocean and Atmosphere (IPMA), Olhão, Portugal
Temperate marine fish larvae use a series of environmental cues (e.g., olfactory, hearing, visual) to mediate the selection of nursery habitats. However, habitat selection may vary according to individuals’ physiological condition. Therefore, this study aimed to determine the ability of gilthead seabream (Sparus aurata L., 1758) larvae to utilize natural odor cues to locate nursery habitats along ontogeny and to examine how it varies with individual’s physiological condition. The hypothesis being tested is that S. aurata larvae prefer coastal rocky reefs as nursery areas, but they might use coastal lagoons as nursery grounds—ecosystems known for their productivity—if under starvation conditions, as a compensatory mechanism to avoid slow growth or even death. A choice-chamber experiment was used to investigate the behavioral responses of satiated and starved laboratory-reared S. aurata larvae, along ontogeny (pre-flexion, flexion, post-flexion), to water collected in a coastal artificial rocky reef and a coastal lagoon. The physiological condition of S. aurata larvae was determined by analyzing several biochemical condition indices. Complementarily, a new set of four preference indexes were developed—Choice-Chamber Preference Indexes—and discussed to provide a clear measure of the behavioral changes of a species along ontogeny by balancing all the behavioral choices made during the experimental trials, including the unresponsive behavior. A developmental threshold was identified at 24 days post-hatching, before which insufficient swimming capability disabled responsive behavior. Beyond this threshold, post-flexion larvae preferred rocky coastal water over lagoon water, even if under starvation conditions or poor physiological condition, despite the fact that the unresponsive behavior was largely predominant. S. aurata larvae displayed a cautionary behavioral strategy, so the compensatory mechanisms to ensure metapopulation stability and resilience have to rely on their feeding plasticity and on being a batch-spawning species (i.e., diversified bet-hedging strategy) to compensate the lack of apparent behavioral plasticity.
INTRODUCTION
The value of nursery areas relies on a series of components that set their biological relevance, namely those components pertaining to connectivity and population dynamics (connectivity, ontogenic migration, seascape migration), ecological and ecophysiological factors (ecotone effects, eco-physiological factors, food/predation trade-offs, food webs), and resource dynamics (resource availability, ontogenic diet shifts, allochthonous inputs) (Sheaves et al., 2015). Therefore, the ability of species to respond to the intrinsic complexity of this ecosystem framework is vital for them. However, the relevance of the behavioral component of marine fish larvae, hatched from pelagic eggs, on their recruitment into coastal and estuarine temperate regions has never been quantified, and most often not even recognized (see Teodósio et al., 2016 for a review). Recently, the Sense Acuity And Behavioral (SAAB) hypothesis was proposed to explain how temperate fish larvae hatched from pelagic eggs in coastal areas find and swim toward estuarine ecosystems, which they will use as nursery grounds (Teodósio et al., 2016). The first premise of this hypothesis postulates that post-flexion larvae rely on their sense acuity to locate estuarine ecosystems by detecting a suite of environmental cues (odor, sound, visual) originated in these ecosystems when they are in coastal or offshore areas (Teodósio et al., 2016). The second premise postulates that once larvae sense estuarine cues, they will swim toward an estuarine ecosystem using distinct swimming strategies which vary according to their location (offshore areas with no influence of patchy estuarine cues, offshore or nearshore areas under the effect of patchy estuarine cues, estuarine plume, or near the entrance of an estuary). Larvae may also swim toward the coast when they are offshore and away from any estuarine cue as a result of an innate behavior (Faillettaz et al., 2015; Teodósio et al., 2016).
The capacity of fish larvae to respond to environmental cues depends first on their ability to detect stimuli, and then on their swimming abilities to follow those cues (Boehlert and Mundy, 1988; Huijbers et al., 2012). Generally, sense acuity and swimming abilities increase along ontogeny (Teodósio et al., 2016); however, some species are capable of physically responding to stimuli immediately upon hatching, while others may take nearly 2 months to react to stimuli (Arvedlund and Kavanagh, 2009). Potential larval stimuli include water pressure gradients (Burke et al., 1995), magnetism (Qin et al., 2015), visual (Whitfield, 1994; Faillettaz et al., 2015), auditory (Staaterman et al., 2014), and odor-based cues (McCormick and Manassa, 2008; Arvedlund and Kavanagh, 2009), which may be used in tandem to identify suitable habitats (Lecchini et al., 2005; Hale et al., 2008). These environmental cues will then trigger a variety of larval behaviors, such as orientation (Paris et al., 2013; Faillettaz et al., 2015), vertical migration (Fortier and Leggett, 1983), predator avoidance (Lehtiniemi, 2005), and habitat selection (Gerlach et al., 2007).
Fish larvae perceive odor cues over greater distances than any other cue (Teodósio et al., 2016), and they can distinguish the chemical signatures present in the water to pinpoint the location of a nursery habitat (Atema et al., 2002; Døving et al., 2006;
Paris et al., 2013). Chemical signatures are determined by abiotic or biotic factors, as type of substrate (V. Baptista, CCMAR, unpublished data), vegetation (Radford et al., 2012), or chemical signals released by conspecifics (Døving et al., 2006). However, most of the research done about habitat selection focused on coral reef fish larvae (seeTeodósio et al., 2016for a review), which suggests the existence of an olfactory-driven homing behavior (Gerlach et al., 2007). Such behavior is also relevant for the understudied temperate fish species (James et al., 2008; Radford et al., 2012), as proposed by the SAAB hypothesis (Teodósio et al., 2016).
Estuarine ecosystems are facultative nursery habitats for some of the temperate fish larvae hatching from pelagic eggs in coastal areas, despite the plentiful of resources and suitable abiotic characteristics that these ecosystems may offer to enhance larvae’s growth and survival (Chaoui et al., 2006; Escalas et al., 2015). Indeed, habitat selection is the outcome of a non-random use of space, driven by environmental stimuli and behavioral choices under changing resource conditions (Kramer et al., 1997; Railsback and Harvey, 2002) and balanced by the risks inherent in each behavioral decision (Lima and Dill, 1990). Habitat choice is a mechanism resulting from a coevolutionary process allowing individuals to choose the highest quality habitat available to acquire the greatest fitness benefit (Kristan, 2003), and thus putatively enabling metapopulations with increased stability and resilience. The conditional strategy hypothesis, which states that genetically monomorphic individuals decide on tactics depending on their status (size, sex, age) or condition (energy reserves) to acquire higher fitness (Gross, 1996), frames perfectly the conundrum posed by an individual’s habitat choice decisions. In the case of fish, the search for high-quality habitats depends also on density-independent (environmental variables as water temperature, salinity, oxygen concentration, light) (Craig and Crowder, 2002) and density-dependent factors (e.g., competition, predation risk, available substrate, and refuge area) (Craig and Crowder, 2002; Shepherd and Litvak, 2004). Additionally, the combination of factors leading to habitat selection may vary along ontogeny, which makes it a very dynamic process (Craig and Crowder, 2002; Kerr et al., 2010).
Under this framework, we hypothesize that fish larvae that use estuarine habitats as facultative nursery areas will ingress into such nutrient-rich habitats when in poor physiological condition, as a compensatory mechanism to avoid slow growth or even death. Thus, this study used the gilthead seabream Sparus aurata Linnaeus 1758 (Actinopterygii: Sparidae) larvae as a model species to determine their preference for coastal rocky reef or coastal lagoon habitats along ontogeny and at two different states of food supply (satiation and starvation). Habitat preference was quantified with a choice-chamber experiment, in which water from an artificial coastal rocky reef and a coastal lagoon were used to evaluate larvae’s preference.
The evolution of gilthead seabream larvae behavioral responses were quantified along ontogeny with a new set of four preference indexes developed in this paper and named Choice-Chamber Preference Indexes (Preference Index, Minimum Consecutive Time Index, Maximum Consecutive Time Index, Overall Time Index). The development of these indexes is
of prime importance because so far there is no consistent methodology to analyze data obtained with choice-chamber experiments. For example, Radford et al. (2012) present their results as the mean percentage of time larvae spent in the preferred water type, while Atema et al. (2002) and Gerlach et al. (2007) calculated a preference index that varied between –100 and +100% and calculated as the difference between the relative mean time spent in waters from two different habitats. Furthermore, and as far as we perceive them, none of these works accounted for unresponsive and inconclusive behavior (Atema et al., 2002; Gerlach et al., 2007; Radford et al., 2012). Thus, we also aim to evaluate the advantages and disadvantages of each one these indexes and their applicability to other taxa.
MATERIALS AND METHODS
Model Species: Sparus aurata Linnaeus
1758 (Actinopterygii: Sparidae)
Sparidae uses temperate coastal areas as preferential spawning grounds, where larvae might recruit into rocky reef areas or vegetated areas (Harmelin-Vivien et al., 1995; Borges et al., 2006; De Raedemaecker et al., 2010). Sparidae also uses estuarine ecosystems as alternative nursery areas (Chaoui et al., 2006; Abecasis and Erzini, 2008; Isnard et al., 2015), as the gilthead seabream, S. aurata Linnaeus, 1758 (Chaoui et al., 2006; Abecasis and Erzini, 2008; Isnard et al., 2015).
S. aurata may ingress into coastal lagoons as larvae (as early as pre-metamorphic larvae) or as juveniles during spring (Mercier et al., 2012; Tournois et al., 2013), returning to the coast during autumn (Mercier et al., 2012). Adults might re-ingress into coastal lagoons several times during their life even if they spent the juvenile phase at sea (Mercier et al., 2012). While in coastal lagoons, adults use seagrass habitats more frequently than any other type of habitat, but without exhibiting a consistent diel pattern of activity (Abecasis and Erzini, 2008). Yet, adults may exhibit a homing behavior when displaced from their home range within the lagoon (Abecasis and Erzini, 2008), but without necessarily returning to their nursery lagoon later in life (Mercier et al., 2012). S. aurata exhibits high trophic plasticity (i.e., incorporate organic matter with different origins— terrestrial, lagoon, marine) (Escalas et al., 2015) and feeding plasticity (Gamito et al., 2003; Tancioni et al., 2003). Some of their prey aggregate in seagrass patches, which might explain why they prefer this habitat over other coastal lagoon habitats (Abecasis and Erzini, 2008).
Experimental Design
The preference of S. aurata larvae for coastal and lagoon water was tested with 546 laboratory-reared larvae, of which 306 larvae and 240 larvae were tested under satiation and starvation conditions, respectively (Table 1). Each larva is an experimental unit assigned randomly to each treatment among those that were available at the Aquaculture Research Station of the Portuguese Institute for the Ocean and Atmosphere (Olhão, Portugal). The exogenous feeding of larvae used in this work initiated at 4 days post-hatching (DPH) and flexion occurred when larvae reached
TABLE 1 | Number of Sparus aurata larvae tested along ontogeny under satiation and starvation conditions.
Development stage Satiation Starvation
Pre-flexion 120 75
Flexion 20 20
Post-flexion 166 145
Total 306 240
∼7 mm (24 DPH). Generally, the planktonic life duration of S. aurata lasts for 60–70 days (Moretti et al., 1999). Experiments were carried out in a temperature controlled room at Ramalhete Marine Station (CCMAR, University of Algarve).
The water types used in this experiment were collected in an artificial rocky reef (coastal jetty) in Quarteira (Portugal, 37◦03′58′′ N, 8◦06′13′′W) and inside the Ria Formosa coastal
lagoon (Portugal, 37◦00′20′′ N, 7◦57′59′′ W). Each water type
was kept aerated in 70 l glass aquaria, which flowed into the choice-chamber through a peristaltic pump.
The swimming capabilities of Sparidae increase along ontogeny (Pattrick and Strydom, 2009; Faria et al., 2011), however, swimming capabilities are limited before post-flexion— for example, up to 3–4 times lower for Pagrus aurata (Sparidae) pre-flexion larvae (Clark et al., 2005). Indeed, a developmental threshold was identified at 24 DPH, before which insufficient swimming capability disabled responsive behavior. The flow rate was set at 20 ml min−1 in each choice lane (area 1 and 2
in Figure 1) for larvae younger than 24 DPH (i.e., pre-flexion larvae), and at 60 ml min−1 for larvae older than 24 DPH (i.e., flexion and post-flexion larvae). Such slow flow speeds (both <0.5 cm s−1) may not have altered the behavioral response of
larvae to odor cues since they were not forced to swim against the flow to hold their position in the chamber. The initial flow rate was the minimum flow rate possible to set in our choice-chamber experiment to guarantee a laminar flow in the choice-chamber, after testing it with a food coloring dye.
Water from the two sites was collected along the course of the experiment. Water temperature was kept at 19.1 ± 1.1◦C during
the entire experiment, while salinity was kept constant during trials. The average salinity at the coast and coastal lagoon was 35.5 ± 1.0 and 35.9 ± 0.3, respectively. Dwarf eelgrass Zostera noltii (Hornemann, 1832) was added to the aquarium containing the coastal lagoon water since this seagrass is a larval settlement habitat within the Ria Formosa lagoon (Cabaço et al., 2005).
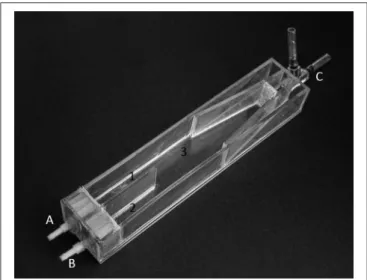
The behavioral responses of S. aurata larvae to the odor cues present in two water sources were tested in a choice chamber apparatus (Figure 1). The chamber’s design was based on the one developed byGerlach et al. (2007)and made with plexiglass (20 × 4 × 5 cm, L × W × H). The chamber features two frontal water inlets (one for each water source; see A and B in Figure 1) and a rear water outlet (see C in Figure 1). Larvae were tested along ontogeny every 2 days, from 4 to 57 DPH, to encompass all larval ontogenic stages—pre-flexion, flexion, and post-flexion. During the experimental period, larvae were fed sequentially with enriched rotifers (4 to 25 DPH), enriched Artemia metanauplii (15 to 30 DPH), and inert micro diet (15 to 57 DPH). Larvae
FIGURE 1 | Choice-chamber used to test the response of Sparus aurata larvae to odor cues along ontogeny. Legend: A, inlet hose 1; B, inlet hose 2; C, outlet hose; 1, choice-lane 1; 2, choice-lane 2; 3, area where larvae were placed at the beginning of each trial, and also the area where unresponsive behavior is assigned.
tested under starvation conditions were left without food for 2 days before trials.
For each trial, a single larva was placed in the mid-section of the choice-chamber (area 3 in Figure 1) and allowed to acclimatize for 2 min. Then, the position of each larva within the choice-chamber was visually tracked at every 10-s interval for 2 min. After, larva rested for 1 min, during which the position of the water inlet hoses was switched for randomization purposes. The larva was then given 2 min for acclimatization, followed by 2 min of behavioral tracking. Unresponsive behavior was assigned to larvae present in the central area of the choice-chamber at every 10-s interval (area 3 in Figure 1), while lagoon and coastal water preference were assigned to larvae at the corresponding lanes at every 10-s interval. This procedure follows the experimental design ofGerlach et al. (2007).
A minimum of 20 trials per trial-day was attempted; however, this was not always possible for larvae kept in starvation because some died (see Table 1 for differences in the number of larvae tested in satiation and starved conditions). The alleged interference of the observer on the behavior of larvae during trials was minimized by maintaining the maximum distance possible while assuring a correct observation of each larva behavior. After each trial, larvae were measured (± 1 mm) under a stereomicroscope and preserved in liquid nitrogen (−196◦C)
for subsequent RNA and DNA analyses.
Chi-square tests (data not shown) were used to verify the behavior differences displayed by each larva to odor cues before and after switching the water sources for each lane. If the larva showed distinct behavior between trials, then this larva was assigned as unresponsive to the odor cues, and discarded from further analyses. However, if the larva showed the same behavior in both trials, then data was analyzed by combining the observations done in each trial, thus totaling 240 s. Chi-square
tests were also used to test for the differences in the absolute frequencies registered between development stages (pre-flexion, flexion, post-flexion) between and within treatments (satiation, starvation).
Choice-Chamber Preference Indexes
The behavioral response of S. aurata larvae to olfactory stimuli along ontogeny, and under satiation and starvation conditions, was expressed by the Choice Chamber Preference Indexes: (i) Preference Index (PI), (ii) Minimum Consecutive Time (MinCT) index, (iii) Maximum Consecutive Time (MaxCT) index, (iv) Overall Time (OT) index. It is relevant to highlight that none of these indices account for the inconclusive behavior (i.e., when larvae spend the same time following each cue), whose interpretations have to be done based on its relative frequency.
The Preference Index (PI) (Equation 1) is calculated as follows: PI = " X tLW− X tCW ! ×T−1 # × 1 −XtUNR×T−1 ! (1)
where T represents the sum of both trials duration (i.e., 240 s), P tLWrepresents the total time larva spent exhibiting preference
for lagoon water, P tCW represents the total time larva spent
exhibiting preference for coastal water, and P tUNRrepresents
the total time larvae spent exhibiting an unresponsive behavior in both trials. PI varies between –1 (coastal water preference during the entire trial) and 1 (lagoon water preference during the entire trial), while 0 indicates that larvae were unresponsive (i.e., without following an odor cue) or undecided (i.e., alternating between the two odor cues during equal period of time).
The MinCT (Equation 2) and MaxCT (Equation 3) indexes are the minimum and maximum consecutive relative time a larva spent oriented toward the preferred water type, or exhibiting an unresponsive behavior during both trials (minCTtrial 1 v 2;
maxCTtrial 1 v 2—the subscript “v” represents the logical symbol
“Or”). Please note that these indexes report only to data referring to the predominant behavior during trials, and are normalized by dividing the registered time by the time of one trial (Ttrial,
120 s). For example, if a larva shows preference for lagoon water, and if the minimum time this larva spent following lagoon water was 30 s during trial 1 (minCTtrial 1) and 50 s during trial 2
(minCTtrial 2), in 120 s trials (Ttrial), then the MinCT for this larva
is 0.25 (Equation 2). The same concept applies to the MaxCT index (Equation 3).
MinCT = MinCTtrial 1×(Ttrial)−1 if minCTtrial 1≤minCTtrial 2or
MinCT = MinCTtrial 2×(Ttrial)−1 if minCTtrial 1>minCTtrial 2 (2)
MaxCT = MaxCTtrial 1×(Ttrial)−1 if maxCTtrial 1≥maxCTtrial 2or
MaxCT = MaxCTtrial 2×(Ttrial)−1 if maxCTtrial 1<maxCTtrial 2(3)
The Overall Time (OT) index is calculated for each behavioral response and larva. OT is calculated as the sum of all total non-consecutive time periods that a larva spent in each water source [tLWn—n partial time periods spent following lagoon water
(LW) cues—Equation 4.1, tCWn—n partial time periods spent
following coastal water (CW) cues—Equation 4.2] or exhibiting an unresponsive behavior [tUNRn—n partial time periods spent
exhibiting unresponsive behavior (UNR)—Equation 4.3] during both trials, and normalized by the sum of both trials (T, i.e., 240 s) (Equation 4). For example, if a larva spent three periods of 10, 40, and 50 s in trials 1 and 2 (240 s total) following lagoon water, then its’ OTLWindex is 0.42. OTLW = Xn 1tLWn×T −1 (4.1) OTCW = Xn 1tCWn×T −1 (4.2) OTUNR = Xn 1tUNRn×T −1 (4.3)
Data for each index is grouped by development stage (pre-flexion, (pre-flexion, post-flexion) and food condition (satiation and starvation), and displayed graphically in box-n-whisker plots for accurate visualization of data—a bar-chart is not appropriate for the correct interpretation of data. Data will often be described using the average and the standard deviation as a measure of data dispersal.
A multiple comparisons test, the Kruskal-Wallis one-way analysis of variance, was used to investigate the behavioral responses of S. aurata to odor cues along ontogeny (pre-flexion, flexion, post-flexion) and at different states of food supply (satiation, starvation). The significance of differences between each factor level was assessed with the Holm-Sidak post-hoc test, which presents unadjusted p-values which were compared with adjusted critical levels to avoid type I errors (Glantz, 2012). It was not possible to use a parametric test because ANOVA’s assumptions were not met.
Physiological Condition of Sparus aurata
Post-flexion Larvae
Nucleic acids derived indices, as the RNA/DNA ratio, are useful indicators of the nutritional condition of marine organisms (see
Chícharo and Chícharo, 2008for a review). Individual variability, as genetic background and/or maternal effect (yolk quantity and quality), may explain why individuals with similar age, size, and under the same diet regime exhibit distinct physiological conditions. Finally, the RNA/DNA ratio informs on individuals physiological condition which is essential to interpret their behavior.
Nucleic acid concentrations of 101 and 96 post-flexion S. aurata larvae in satiation and starvation conditions, respectively, were quantified according to Esteves et al. (2000) and Caldarone et al. (2001). Due to tissue effects on RNA and DNA concentration, whole larvae were analyzed (Olivar et al., 2009). The methodological analysis involves mechanical and chemical homogenization of tissues and subsequent fluorescence-photometric measurements using ethidium bromide (EB) as a specific nucleic acid fluorochrome dye. Fluorescence was measured on a microplate reader (Biotek Synergy HT model SIAFRTD) using an excitation wavelength of 365 nm and an emission wavelength of 590 nm. Concentrations were determined by running standard curves of DNA-EB and
RNA-EB every day with known concentrations of λ-phagus DNA (0.25 µg µl−1) and 16S-23S E. coli RNA (4 µg µl−1) (Roche),
in the appropriate range of values. The average ratio of DNA and RNA slopes (mean ± SE) was 4.1 ± 0.96. The nutritional condition was assessed by the following nucleic acid derived indices: sRD, DNA/DW, and RNA/mg indexes. The RNA/DNA ratios were standardized (sRD) using this information and the reference slope ratio of 2.4, according toCaldarone et al. (2006).
The size of post-flexion larvae had no influence on their sRD (N = 197; R2 = 0.013; P= 0.114). sRD ratios were converted to temperature-adjusted protein growth rates by applying the equation fromBuckley (1984)and Buckley et al. (2008), considering the average water temperature during the experiment (19.1 ± 1.1◦C). Thus, when larvae’s protein growth
rates are ≤ 0 or > 0, larvae are in poor and good nutritional condition, respectively (Robinson and Ware, 1988). In the case of our S. aurata larvae, the calculated sRD critical value was 0.8 (sRD ≤0.8—larvae in poor physiological condition; sRD > 0.8—larvae in good physiological condition). Fish larvae can be in good condition even if submitted to short-term starvation conditions, either due to genetic characteristics and/or to previously feeding history (Robinson and Ware, 1988).
The preference index was set as a dependent variable of sRD. This generates a scatterplot in which larvae are plotted in four quadrants: (i) preference for lagoon water (PI > 0) and in good physiological condition (sRD > 0.8); (ii) preference for lagoon water (PI > 0) and in poor physiological condition (sRD ≤ 0.8); (iii) preference for coastal water (PI ≤ 0) and in poor physiological condition (sRD ≤ 0.8); (iv) preference for coastal water (PI > 0) and in good physiological condition (sRD >0.8). The differences in the frequency distribution of larvae between treatments (satiation vs. starvation) were investigated with a chi-square test, while differences in the average value of each quadrant between treatments were assessed through a t-test if data is normally distributed, or with the corresponding non-parametric Mann-Whitney U-test.
RESULTS
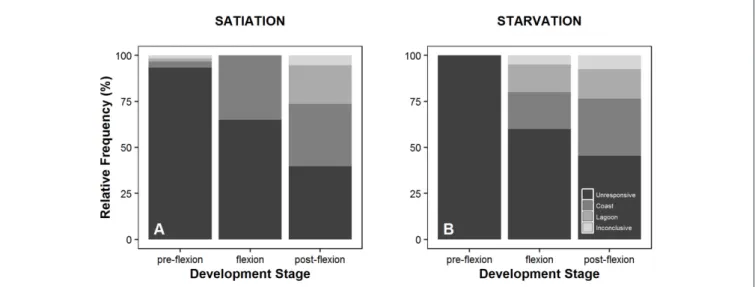
Overall, the response of larvae to coastal and lagoon water odor increased along ontogeny. During the pre-flexion stage, 93.3 and 100% of the larvae tested were unresponsive to odor cues under satiation (Figure 2A) and starvation conditions (Figure 2B), respectively. Unresponsive behavior decreased to a minimum of 39.8% for larvae at the post-flexion stage under satiation conditions (Figure 2B). Larvae tended to prefer coastal water in detriment of lagoon water during flexion and post-flexion development stages, either at satiation or starvation conditions. The smallest and biggest difference between the preference for coastal and lagoon water was observed while larvae were at the flexion stage. The maximum difference was 35.0% that was observed under satiation conditions (Figure 2A), while the minimum difference was 5.0% and observed under starvation conditions (Figure 2B). The inconclusive behavior accounted for 5.4 and 7.6% of satiated and starved post-flexion larvae, respectively (Figure 2). Overall, significant differences were
FIGURE 2 | Behavior exhibited by Sparus aurata larvae (unresponsive to water cues, coastal water preference, lagoon water preference, inconclusive behavior) during choice-chamber trials performed along ontogeny (pre-flexion, flexion, post-flexion) and in satiation (A) and starvation (B) conditions.
found in the absolute frequencies observed between all levels (pre-flexion, flexion, post-flexion) within treatments (satiation and starvation) (χ2test, p = 0.000), and for the level pre-flexion
between treatments (χ2test, p = 0.000) (Table 2).
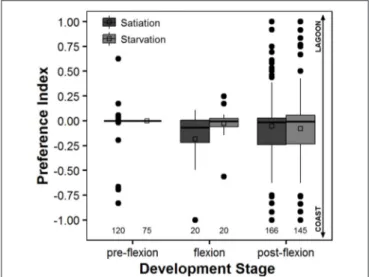
The preference index varied between −1.0 and 1.0, and averaged between −0.18 ± 0.32 (satiation, flexion larvae) and 0.0 ± 0.0 (starvation, pre-flexion larvae), which shows a slight preference toward coastal water (Figure 3). There were no significant differences between larvae at satiation and starvation conditions at any level of development stage (unadjusted P > 0.05) (Table 3). The only significant difference was observed between pre-flexion and flexion larvae at satiation conditions (unadjusted P = 0.013) (Table 3).
The MinCT and MaxCT indices must be evaluated in conjunction with the number of observations made for each behavior type at a given development stage, to assure statistical significance. Thus, data on MinCT and MaxCT will be used only to access the behavior of larvae along ontogeny regarding the time spent performing an unresponsive behavior, and comparing behaviors at the post-flexion stage.
The average MinCT for unresponsive larvae varied between 65 ±38 s (flexion at satiation conditions) and 120 ± 0 s (pre-flexion at starvation conditions) (Figures 4A,B). The MinCT index for unresponsive larvae did not vary significantly between larvae at satiation and starvation conditions within each development stage (0.196 < Unadjusted P < 0.738), but it varied significantly between pre-flexion and flexion larvae (unadjusted P < 0.001) and pre-flexion and post-flexion larvae (unadjusted P< 0.001) in the comparison “Development stage,” “Development stage within larvae at satiation conditions,” and “Development stage within larvae at starvation conditions” (Table 4). For those larvae at post-flexion, the MinCT index did not vary significantly between larvae at starvation and satiation conditions within each behavioral response (0.107 < unadjusted P < 0.790), but it varied significantly between those larvae exhibiting unresponsive
TABLE 2 | Significance level of the comparisons calculated with a Chi-square test for the absolute frequencies registered for the behavior exhibited by Sparus aurata larvae (unresponsive to water cues, coastal water preference, lagoon water preference, inconclusive behavior) during choice-chamber trials performed along ontogeny (pre-flexion, flexion, post-flexion) and in satiation and starvation conditions.
Comparisons p
SAME DEVELOPMENT STAGE BETWEEN CONDITIONS
Pre-flexion* 0.000
Flexion 0.096
Post-flexion 0.081
DEVELOPMENT STAGES WITHIN SATIATION
Pre-flexion vs. flexion* 0.000
Flexion vs. post-flexion* 0.000
Pre-flexion vs. post-flexion* 0.000
DEVELOPMENT STAGES WITHIN STARVATION
Pre-flexion vs. flexion* 0.000
Pre-flexion vs. post-flexion* 0.000
Flexion vs. post-flexion* 0.000
The asterisk (*) highlights the existence of significant differences.
behavior and coastal water preference (unadjusted P< 0.001) and unresponsive behavior and lagoon water preference (unadjusted P = 0.002) (Table 5).
The average MaxCT for unresponsive larvae varied between 101 ± 23 s (flexion at starvation conditions) and 120 ± 0 s (pre-flexion at starvation conditions) (Figures 4C,D). The MaxCT index for unresponsive larvae did not vary significantly between larvae at satiation and starvation conditions within each development stage (unadjusted P > 0.05), except for larvae at flexion (unadjusted P= 0.044), but this index varied significantly between larvae at different development stages
FIGURE 3 | Box-n-whiskers plots representing the Preference Index determined for Sparus aurata larvae under satiation and starvation conditions along their ontogeny. Negative values of this index indicate a preference for coastal water, while positive values indicate a preference for lagoon water. The plot depicts the 1st and 3rd quartiles, median, mean, and outliers, as well as the 5th and 95th percentiles as the minimum and maximum whiskers, respectively. Legend: open squares represent the mean; thick black line represents the median; full black circles represent the outliers; the numbers at the bottom of the graph account for the number of observations made.
(<0.001 < unadjusted P < 0.021) (Table 6). For those larvae at post-flexion, the MaxCT index did not vary significantly between larvae at starvation and satiation conditions within each behavioral response (0.282 < unadjusted P < 0.811), but it varied significantly between those larvae exhibiting unresponsive behavior and coastal water preference (unadjusted P< 0.001) and unresponsive behavior and lagoon water preference (unadjusted P = 0.014) (Table 7).
The overall time that larvae spent exhibiting an unresponsive behavior decreased along ontogeny development, from 240.0 ± 0.0 s (pre-flexion, starvation) (Figure 5B) to 106.0 ± 76.8 s (post-flexion, satiation) (Figure 5A). In contrast, the time spent following the odor cues from coastal and lagoon water increased.
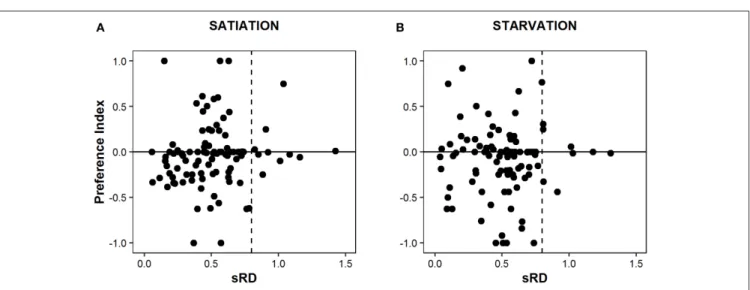
The average standard RNA:DNA ratio (sRD) of satiated (n = 101; 0.51 ± 0.25) and starved (n = 96; 0.50 ± 0.25) post-flexion larvae did not differed significantly (U-test, p = 0.941) (Figure 6). The distribution of larvae among the four quadrants – combination of lagoon (PI > 0) and coastal (PI ≤ 0) preference vs. above and below the 0.8 critical level—is non-significantly different for satiated and starved larvae (χ2test, p = 0.17), as well
as the average sRD and PI values within each quadrant (p > 0.05, t-test) (Figure 6).
DISCUSSION
Considerations about the Choice-Chamber
Preference Indexes
The Preference Index has two main advantages. First, it aims to provide a uniform methodology enabling researchers to
TABLE 3 | Multiple comparisons’ statistical output for the Preference Index. Comparisons Diff. of Means t Unadjusted P Critical level CONDITION
Satiation vs. starvation 11.537 1.369 0.172 0.050 CONDITION WITHIN EACH DEVELOPMENT STAGE
Pre-flexion 2.882 0.284 0.776 0.050 Flexion 37.750 1.732 0.084 0.050 Post-flexion 6.021 0.769 0.442 0.050 DEVELOPMENT STAGE Pre-flexion vs. flexion 23.851 1.985 0.048 0.025 Pre-flexion vs. post-flexion 14.609 2.280 0.023 0.017 Flexion vs. post-flexion 9.242 0.798 0.425 0.050 DEVELOPMENT STAGE WITHIN LARVAE AT SATIATION CONDITIONS Pre-flexion vs. flexion* 41.285 2.481 0.013 0.017 Flexion vs. post-flexion 31.127 1.909 0.057 0.025 Pre-flexion vs. post-flexion 10.158 1.230 0.219 0.050 DEVELOPMENT STAGE WITHIN LARVAE AT STARVATION CONDITIONS
Pre-flexion vs. flexion 6.417 0.370 0.711 0.050
Pre-flexion vs. post-flexion 19.060 1.945 0.052 0.017 Flexion vs. post-flexion 12.644 0.769 0.442 0.025
The post-hoc Holm-Sidak test was used to access the statistical significance of the comparisons made for the factors condition and development stage. The asterisk (*) highlights the existence of significant differences.
compare data between species and at distinct development stages, even if data were obtained using different experimental designs (particularly the time length of experimental trials). The second advantage, and probably the most important, is that the Preference Index provides a clear measure of the behavioral changes of a species along ontogeny (or any other grouping factor–sex, habitat, pCO2) by balancing all the behavioral choices
made during the experimental trials, including the unresponsive behavior. We advocate that unresponsive behavior should be included in the calculation of a preference index since its exclusion overestimates, the preference of a certain species for a given habitat, even if slightly. Also, the assignment of a behavioral choice to areas outside the choice lanes is prone to bias since the mixture of water from two different sources in this area does not have to be necessarily uniform at all times.
The MinCT and MaxCT Indexes complement the information provided by the Preference Index. In the particular case of our study, where the Preference Index only suggests that flexion and post-flexion larvae have a slight preference for coastal habitats, these MinCT and MaxCT indexes demonstrate that the unresponsive behavior diminished along ontogeny. This fact is especially evident for the MinCT index, however for other species or the same species but if tested at subsequent life stages, the maximum time spent exhibiting unresponsive behavior would decrease and reveal even more the usefulness of the MaxCT index. The Overall Time (OT) index did not exhibit the constraints shown by the MaxCT index for S. aurata larvae since it clearly captured the decrease of the unresponsive behavior, and also the effect of starvation on larvae’s behavior.
FIGURE 4 | Box-n-whiskers plots representing the minimum (A,B) and maximum (C,D) consecutive time (seconds) that Sparus aurata larvae spent exhibiting a given behavior (unresponsive, or preference for coastal or lagoon water), during choice-chamber trials performed along ontogeny (pre-flexion, flexion, post-flexion) and in satiation (A,C) and starvation (B,D) conditions. The behavior of each larva was assigned after two choice-chamber trials, and those larvae with inconclusive behavior were not considered in these analyses. The plot depicts the 1st and 3rd quartiles, median, mean, and outliers, as well as the 5th and 95th percentiles as the minimum and maximum whiskers, respectively. Legend: open squares represent the mean; thick black line represents the median; full black circles represent the outliers; the numbers at the bottom of the graph account for the number of observations made.
Finally, the Choice Chamber Preference Indexes also have the potential to be important contributors for parameterizing the behavioral responses of fish larvae in lagrangian behavioral models. However, these indexes should be used cautiously when the inconclusive behavior is predominant—which was not the case in our study. In such situations, the information obtained from the frequency of each behavior (as displayed in Figure 2) should be preferentially used for the interpretation of larvae behavior and in parameterizing lagrangian models, since the indexes do not account for inconclusive behavior.
Response of Sparus aurata Larvae to Odor
Cues
The response of S. aurata larvae to nursery odor cues increased along ontogeny, thus coinciding with the development of olfactory structures and increased swimming abilities (up to 19.3 cm s−1, 20.2 body lengths s−1, Faria et al., 2011), as proposed by the SAAB hypothesis (Teodósio et al., 2016). The absence of pre-flexion and flexion larvae response to odor cues can be due to their incapacity to swim toward the cues, to sensing incapacity, and/or because their attraction to nursery grounds develop later during the ontogeny closer to settlement. Certainly, immunohistochemistry studies focusing on the development of
TABLE 4 | Multiple comparisons’ statistical output for the Minimum Consecutive Time (MinCT) index calculated for all larvae exhibiting an unresponsive behavior. Comparisons Diff. of Means t Unadjusted P Critical level
CONDITION
Satiation vs. starvation 2.550 0.579 0.563 0.050
CONDITION WITHIN EACH DEVELOPMENT STAGE
Pre-flexion 5.536 1.295 0.196 0.050 Flexion 3.782 0.330 0.742 0.050 Post-flexion 1.667 0.334 0.738 0.050 DEVELOPMENT STAGE Pre-flexion vs. flexion* 49.957 8.163 <0.001 0.025 Pre-flexion vs. post-flexion* 44.884 13.666 <0.001 0.017 Flexion vs. post-flexion 5.073 0.811 0.418 0.050
DEVELOPMENT STAGE WITHIN LARVAE AT SATIATION CONDITIONS Pre-flexion vs. flexion* 49.080 5.846 <0.001 0.025 Pre-flexion vs. post-flexion* 41.282 9.285 <0.001 0.017
Flexion vs. post-flexion 7.797 0.897 0.370 0.050
DEVELOPMENT STAGE WITHIN LARVAE AT STARVATION CONDITIONS Pre-flexion vs. flexion* 50.833 5.706 <0.001 0.025 Pre-flexion vs. post-flexion* 48.485 10.027 <0.001 0.017
Flexion vs. post-flexion 2.348 0.261 0.794 0.050
The post-hoc Holm-Sidak test was used to access the statistical significance of the comparisons made for the factors condition and development stage. The asterisk (*) highlights the existence of significant differences.
odor receptor cells along temperate fish larvae ontogeny will shed light on this issue.
Contrary to our hypothesis, post-flexion larvae did not follow the odor cues from a coastal lagoon (i.e., an alternative nursery area) as a compensatory mechanism to minimize the detrimental effects of starvation on growth and survival. Two hypotheses might have contributed to this outcome.
First, hatchery-reared larvae might have a different response behavior to odor cues than wild larvae. However, in a similar experiment, hatchery-reared larvae preferred seagrass habitat water in detriment of other water types (Radford et al., 2012). The capture of wild larvae in different stages of larval development and controlled conditions of food availability would be impossible given our experimental design. For example, a work using wild larvae in a choice-chamber experiment tested 37 larvae (James et al., 2008), while we tested 546 larvae. In this experiment, larvae preferred estuarine waters, in detriment of coastal water (James et al., 2008). However, it is important to highlight that these two studies did not consider the unresponsive behavior of larvae in their tests which is a trait that cannot be neglected in animal behavior studies.
A second hypothesis concerns with a putative necessity to exist a combination of odor cues, signaling the habitat (i.e., seagrass odor cues) and the presence of prey, and not just the habitat itself. This hypothesis deserves being investigated in future works and was suggested to explain the unresponsive behavior of S. aurata larvae in following the odor cues of another seagrass species signaling a nursery habitat in the Mediterranean Sea (Díaz-Gil et al., 2017). In
TABLE 5 | Multiple comparisons’ statistical output for the Minimum Consecutive Time (MinCT) index calculated for all post-flexion larvae.
Comparisons Diff. of Means t Unadjusted P Critical level CONDITION
Satiation vs. starvation 5.540 1.228 0.220 0.050
CONDITION WITHIN EACH BEHAVIORAL RESPONSE
Unresponsive 1.667 0.267 0.790 0.050 Coast 11.603 1.616 0.107 0.050 Lagoon 6.683 0.694 0.488 0.050 BEHAVIORAL RESPONSE Unresponsive vs. coast* 17.261 3.628 <0.001 0.017 Unresponsive vs. lagoon* 17.864 3.114 0.002 0.025 Coast vs. lagoon 0.603 0.100 0.920 0.050
BEHAVIORAL RESPONSE OF LARVAE AT SATIATION CONDITIONS Unresponsive vs. coast* 23.896 3.667 <0.001 0.017 Unresponsive vs. lagoon* 22.039 2.939 0.004 0.025
Coast vs. lagoon 1.857 0.240 0.810 0.050
BEHAVIORAL RESPONSE OF LARVAE AT STARVATION CONDITIONS
Unresponsive vs. coast 10.626 1.533 0.126 0.025
Unresponsive vs. lagoon 13.689 1.576 0.116 0.017
Coast vs. lagoon 3.063 0.333 0.739 0.050
The post-hoc Holm-Sidak test was used to access the statistical significance of the comparisons made for the factors condition and response. The asterisk (*) highlights the existence of significant differences.
future studies, it would also be interesting to include offshore and conspecific cues, as well as different temperature and salinity conditions, to rank larvae’s preferences among different cues.
The facultative behavior of S. aurata in using coastal lagoons as nursery habitats for larvae, as observed in the Mediterranean Sea (Mercier et al., 2012; Tournois et al., 2013), confirms previous observations made in the Ria Formosa lagoon. The larvae of Sparidae were among the most abundant in this lagoon, and most of these larvae were post-flexion larvae collected during flood tides (Chícharo and Teodósio, 1991). So, the absence of a meaningful number of pre-flexion larvae and the presence of post-flexion larvae during flood tides suggests that spawning does not occur inside the lagoon, as observed for other species in an estuary located nearby (Faria et al., 2006; Morais et al., 2009). Larvae’s ingress mechanisms were never evaluated, so larvae’s ingress could result from purely stochastic events (e.g., winds, tides) (Hare et al., 2005; Schieler et al., 2014) or due to active ingress strategies (e.g., selective tidal stream transport, bottom-inflow ingress, or ingress near the bottom or margins where water velocity is slower) which include ingress during flood tides (Hare et al., 2005). However, if S. aurata larvae would employ active ingress strategies then larvae would likely use active retention strategies and their abundance would build-up in the lagoon, but this was not observed. The abundance of larvae was almost 900 times higher during the high-tide than during the low-tide (Chícharo and Teodósio, 1991). So, these observations
TABLE 6 | Multiple comparisons’ statistical output for the Maximum Consecutive Time (MaxCT) index calculated for all larvae exhibiting an unresponsive behavior. Comparisons Diff. of Means t Unadjusted P Critical level
CONDITION
Satiation vs. starvation 3.100 1.778 0.076 0.050 CONDITION WITHIN EACH DEVELOPMENT STAGE
Pre-flexion 0.625 0.369 0.712 0.050 Flexion* 9.167 2.019 0.044 0.050 Post-flexion 0.758 0.384 0.701 0.050 DEVELOPMENT STAGE Pre-flexion vs. flexion* 14.271 5.892 <0.001 0.025 Pre-flexion vs. post-flexion* 8.551 6.578 <0.001 0.017 Flexion vs. post-flexion* 5.720 2.311 0.021 0.050 DEVELOPMENT STAGE WITHIN LARVAE AT SATIATION CONDITIONS Pre-flexion vs. flexion* 9.375 2.822 0.005 0.025 Pre-flexion vs. post-flexion* 7.860 4.467 <0.001 0.017 Flexion vs. post-flexion 1.515 0.440 0.660 0.050 DEVELOPMENT STAGE WITHIN LARVAE AT STARVATION CONDITIONS Pre-flexion vs. flexion* 19.167 5.437 <0.001 0.017 Pre-flexion vs. post-flexion* 9.242 4.829 <0.001 0.025 Flexion vs. post-flexion* 9.924 2.789 0.006 0.050
The post-hoc Holm-Sidak test was used to access the statistical significance of the comparisons made for the factors condition and development stage. The asterisk (*) highlights the existence of significant differences.
suggest a passive ingress of S. aurata larvae into the Ria Formosa lagoon.
The decision of S. aurata post-larvae to adjust to new contexts (e.g., migrate or explore new habitats in the face of reducing prey availability or presence of a predator—Chapman et al., 2011; Killen et al., 2012), can also depend on individual’s personality (i.e., shy or bold). Individuals can deal with uncertainty in three ways: (1) reduce uncertainty by gathering information; (2) use a strategic behavior according to the options available (state-dependent) which will produce distinct levels of reward (i.e., variance-sensitivity), (3) invest in insurance to mitigate the consequences of uncertainty (Mathot et al., 2012). In the case of S. aurata post-flexion larvae, it seems that they prefer insurance (i.e., unresponsive behavior, preference for coastal water) rather than mitigate the effect of starvation with uncertainty (i.e., swim toward lagoon water). Therefore, S. aurata ought to employ other compensatory mechanisms to mitigate the effect of starvation on metapopulation stability and resilience.
Coastal fish larvae can rely, for example, on high feeding plasticity to avoid prey mismatch (Morote et al., 2010; Chícharo et al., 2012), while batch spawning (i.e., multiple spawning events along the spawning season) would compensate for prey mismatch or other biotic and abiotic detrimental conditions (Helfman et al., 2009). In essence, this conundrum fits within the scope of the bet-hedging theory (Helfman et al., 2009). This theory is an evolutionary hypothesis proposing that individuals “optimize fitness in varying and unpredictable environments by sacrificing mean fitness to decrease variation in fitness” which can concern to any life history stage and
TABLE 7 | Multiple comparisons’ statistical output for the Maximum Consecutive Time (MaxCT) index calculated for all post-flexion larvae.
Comparisons Diff. of Means t Unadjusted P Critical level CONDITION
Satiation vs. starvation 2.592 1.132 0.259 0.050
CONDITION WITHIN EACH BEHAVIORAL RESPONSE
Unresponsive 0.758 0.239 0.811 0.050 Coast 1.750 0.480 0.631 0.050 Lagoon 5.267 1.078 0.282 0.050 BEHAVIORAL RESPONSE Unresponsive vs. coast* 8.261 3.422 <0.001 0.017 Unresponsive vs. lagoon* 7.198 2.473 0.014 0.025 Coast vs. lagoon 1.063 0.349 0.727 0.050
BEHAVIORAL RESPONSE OF LARVAE AT SATIATION CONDITIONS
Unresponsive vs. coast 7.765 2.348 0.020 0.017
Unresponsive vs. lagoon 4.944 1.299 0.195 0.025
Coast vs. lagoon 2.821 0.719 0.472 0.050
BEHAVIORAL RESPONSE OF LARVAE AT STARVATION CONDITIONS
Unresponsive vs. coast* 8.758 2.489 0.013 0.017
Unresponsive vs. lagoon 9.453 2.145 0.033 0.025
Coast vs. lagoon 0.696 0.149 0.882 0.050
The post-hoc Holm-Sidak test was used to access the statistical significance of the comparisons made for the factors condition and response. The asterisk (*) highlights the existence of significant differences.
not only with a trade-off between the survival of adults and reproduction (Olofsson et al., 2009). Bet-hedging has several strategies, the conservative hedging, the diversified hedging, the adaptative hedging, and the dynamic bet-hedging (Crean and Marshall, 2009; Olofsson et al., 2009). The dynamic bet-hedging stipulates that when environmental conditions are unpredictable, as conditions at sea most of the time, mothers will invest in offspring phenotypic plasticity (Crean and Marshall, 2009). However, in the case of S. aurata, it seems that larvae’s lack of behavioral plasticity precludes the existence of other strategy or strategies. Probably, S. aurata use a diversified bet-hedging strategy (“don’t put all eggs in one basket”) (sensu Olofsson et al., 2009) through a protracted reproduction period (i.e., batch spawning), to compensate the lack of larvae’s behavioral plasticity regarding using another nursery area to compensate poor physiological condition and prey mismatch (i.e., lack of food). Therefore, the dynamics of the different bet-hedging strategies used by coastal fish, and how it influences their fitness and metapopulation stability and resilience is far from being understood, which turns this topic prone to new research and debate.
ETHICS STATEMENT
CCMAR facilities and their staff are certified to house and conduct experiments with live animals (“group-1” license by the Veterinary General Directorate, Ministry of Agriculture, Rural
FIGURE 5 | Box-n-whiskers plots representing the non-consecutive overall time (seconds) that Sparus aurata larvae spent exhibiting a given behavior (unresponsive, or preference for coastal or lagoon water), during choice-chamber trials, performed along ontogeny (pre-flexion, flexion, post-flexion) and in satiation (A) and starvation (B) conditions. The behavior of each larva was assigned after two choice-chamber trials, and those larvae with inconclusive behavior were not considered in these analyses. The plot depicts the 1st and 3rd quartiles, median, mean and outliers, as well as the 5th and 95th percentiles as the minimum and maximum whiskers, respectively. Legend: open squares represent the mean; thick black line represents the median; full black circles represent the outliers; the numbers at the bottom of the graph account for the number of observations made.
FIGURE 6 | Variability of Sparus aurata post-flexion larvae Preference Index (PI) in function of their standard RNA:DNA ratio (sRD) at satiation (A) and starvation (B) conditions. Negative values of the Preference Index indicate a preference for coastal water, while positive values indicate a preference for lagoon water. The vertical dashed line represents the 0.8 sRD critical level determined for gilthead seabream larvae using the equations ofBuckley (1984)andBuckley et al. (2008).
Development and Fisheries of Portugal) in accordance with the three “R” policy and national and European legislation.
AUTHOR CONTRIBUTIONS
MT and PM conceived the study. LR and PP provided the fish larvae used in this study. MP performed the fish behavior tests. MP, VB, MT, and PM performed the biochemical analyses. PM, MT, and MP analyzed the data. PM and MP wrote the paper. All authors revised the paper.
ACKNOWLEDGMENTS
The authors would like to thank Sara Castanho from Estação Piloto de Piscicultura de Olhão (EPPO)/Aquaculture Research Station—Instituto Português do Mar e da Atmosfera (IPMA, Portugal), and João Reis from Centro do Ramalhete (CCMAR) during the fish larvae behavioral tests, and Mark Ashton for the English revision. This study was funded by Fundação para a Ciência e a Tecnologia (Portugal) through project UID/Multi/04326/2013. PM is funded by the Delta Stewardship Council and Delta
Science Program under Grant No. (1167). The contents of this material do not necessarily reflect the views and policies of the Delta Stewardship Council, nor does mention of trade names or commercial products constitute endorsement or recommendation for use. VB and MT were funded by Fundação para a Ciência e a Tecnologia
with a Ph.D. (SFRH/BD/104209/2014) and a sabbatical (SFRH/BSAB/113684/2015) fellowship, respectively. The authors also acknowledge the contributions made by three reviewers. Publication made possible in part by support from the Berkeley Research Impact Initiative (BRII) sponsored by the UC Berkeley Library.
REFERENCES
Abecasis, D., and Erzini, K. (2008). Site fidelity and movements of gilt-head seabream Sparus aurata in a coastal lagoon (Ria Formosa, Portugal). Estuar. Coast. Shelf Sci. 79, 758–763. doi: 10.1016/j.ecss.2008.06.019
Arvedlund, M., and Kavanagh, K. (2009). “The senses and environmental cues used by marine larvae of fish and decapod crustaceans to find tropical coastal ecosystems,” in Ecological Connectivity among Tropical Coastal Ecosystems, ed L. Nagelkerken (Dordrecht: Springer), 135–184.
Atema, J., Kingsford, M. J., and Gerlach, G. (2002). Larval reef fish could use odour for detection, retention and orientation to reefs. Mar. Ecol. Prog. Ser. 241, 151–160. doi: 10.3354/meps241151
Boehlert, G. W., and Mundy, B. C. (1988). Roles of behavioural and physical factors in larval and juvenile fish recruitment to estuarine nursery areas. Am. Fish. Soc. Symp. 3, 51–67.
Borges, R., Ben-Hamadou, R., Chícharo, M. A., Ré, P., and Gonçalves, E. J. (2006). Horizontal spatial and temporal distribution patterns of nearshore larval fish assemblages at a temperate rocky shore. Estuar. Coast. Shelf Sci. 71, 412–428. doi: 10.1016/j.ecss.2006.08.020
Buckley, L. (1984). RNA-DNA ratio: an index of larval fish growth in the sea. Mar. Biol. 80, 291–298. doi: 10.1007/BF00392824
Buckley, L. J., Caldarone, E. M., and Clemmesen, C. (2008). Multi-species larval fish growth model based on temperature and fluorometrically derived RNA/DNA ratios: results from a meta-analysis. Mar. Ecol. Prog. Ser. 371, 221–232. doi: 10.3354/meps07648
Burke, J. S., Tanaka, M., and Seikai, T. (1995). Influence of light and salinity on behaviour of larval Japanese flounder (Paralichthys olivaceus) and implications for inshore migration. Neth. J. Sea Res. 34, 59–69. doi: 10.1016/0077-7579(95)90014-4
Cabaço, S., Alexandre, A., and Santos, R. (2005). Population-level effects of clam harvesting on the seagrass Zostera noltii. Mar. Ecol. Prog. Ser. 298, 123–129. doi: 10.3354/meps298123
Caldarone, E. M., Clemmesen, C., Berdalet, E., Miller, T. J., Folkvord, A., Holt, G., et al. (2006). Intercalibration of four spectrofluorometric protocols for measuring RNA/DNA ratios in larval and juvenile fish. Limnol. Oceanogr. Methods 4, 153–163. doi: 10.4319/lom.2006.4.153
Caldarone, E. M., Wagner, M., St. Onge-Burns, J., and Buckley, L. J. (2001). Protocol and Guide for Estimating Nucleic Acids in Larval Fish Using a Fluorescence Microplate Reader. Northeast Fisheries Science Center Reference Document 01-11, 22.
Chaoui, L., Kara, M. H., Faure, E., and Quignard, J. P. (2006). Growth and reproduction of the gilthead seabream Sparus aurata in Mellah lagoon (north-eastern Algeria). Sci. Mar. 70, 545–552. doi: 10.3989/scimar.2006.70n3545 Chapman, B. B., Hulthén, K., Blomqvist, D. R., Hansson, L.-A., Nilsson,
J.-A., Brodersen, J., et al. (2011). To boldly go: individual differences in boldness influence migratory tendency. Ecol. Lett. 14, 871–876. doi: 10.1111/j.1461-0248.2011.01648.x
Chícharo, L. M. Z., and Teodósio, M. A. A. (1991). Caracterização geral do ictioplâncton da Ria Formosa. Rev. Biol. U. Aveiro 4, 287–299.
Chícharo, M. A., Amaral, A., Faria, A., Morais, P., Mendes, C., Piló, D., et al. (2012). Are tidal lagoons ecologically relevant to larval recruitment of small pelagic fish? An approach using nutritional condition and growth rate. Estuar. Coast. Shelf Sci. 112, 265–279. doi: 10.1016/j.ecss.2012.07.033
Chícharo, M. A., and Chícharo, L. (2008). RNA:DNA ratio and other nucleic acid derived indices in marine ecology. Int. J. Mol. Sci. 9, 1453–1471. doi: 10.3390/ijms9081453
Clark, D. L., Leis, J. M., Hay, A. C., and Trnski, T. (2005). Swimming ontogeny of larvae of four temperate marine fishes. Mar. Ecol. Progr. Ser. 292, 287–300. doi: 10.3354/meps292287
Craig, J. K., and Crowder, L. B. (2002). “Factors influencing habitat selection in fishes with a review of marsh ecosystems,” in Concepts and Controversies in Tidal Marsh Ecology, eds M. P. Weinstein and D. A. Kreeger (Dordrecht: Springer), 241–266.
Crean, A. J., and Marshall, D. J. (2009). Coping with environmental uncertainty: dynamic bet hedging as a maternal effect. Philos. Trans. R. Soc. Lond. B Biol. Sci. 364, 1087–1096. doi: 10.1098/rstb.2008.0237
De Raedemaecker, F., Miliou, A., and Perkins, R. (2010). Fish community structure on littoral rocky shores in the Eastern Aegean Sea: effects of exposure and substratum. Estuar. Coast. Shelf Sci. 90, 35–44. doi: 10.1016/j.ecss.2010.08.007 Díaz-Gil, C., Cotgrove, L., Smee, S. L., Simón-Otegui, D., Hinz, H., Grau,
A., et al. (2017). Anthropogenic chemical cues can alter the swimming behaviour of juvenile stages of a temperate fish. Mar. Environ. Res. 125, 34–41. doi: 10.1016/j.marenvres.2016.11.009
Døving, K. B., Stabell, O. B., Östlund-Nilsson, S., and Fisher, R. (2006). Site fidelity and homing in tropical coral reef cardinal fish: are they using olfactory cues? Chem. Senses 31, 265–272. doi: 10.1093/chemse/bjj028
Escalas, A., Ferraton, F., Paillon, C., Vidy, G., Carcaillet, F., Salen-Picard, C., et al. (2015). Spatial variations in dietary organic matter sources modulate the size and condition of fish juveniles in temperate lagoon nursery sites. Estuar. Coast. Shelf Sci. 152, 78–90. doi: 10.1016/j.ecss.2014.11.021
Esteves, E., Pina, T., Chícharo, M. A., and Andrade, J. P. (2000). The distribution of estuarine fish larvae: nutritional condition and co-occurrence with predators and prey. Acta Oecol. 21, 161–173. doi: 10.1016/S1146-609X(00)01078-X Faillettaz, R., Blandin, A., Paris, C. B., Koubbi, P., and Irisson, J.-O. (2015).
Sun-compass orientation in Mediterranean fish larvae. PLoS ONE 10:e0135213. doi: 10.1371/journal.pone.0135213
Faria, A., Chícharo, M. A., and Gonçalves, E. J. (2011). Effects of starvation on swimming performance and body condition of pre-settlement Sparus aurata larvae. Aquat. Biol. 12, 281–289. doi: 10.3354/ab00345
Faria, A., Morais, P., and Chícharo, M. A. (2006). Ichthyoplankton dynamics in the Guadiana estuary and adjacent coastal area, South-East Portugal. Estuar. Coast. Shelf Sci. 70, 85–97. doi: 10.1016/j.ecss.2006.05.032
Fortier, L., and Leggett, W. C. (1983). Vertical migrations and transport of larval fish in a partially mixed estuary. Can. J. Fish. Aquat. Sci. 40, 1543–1555. doi: 10.1139/f83-179
Gamito, S., Pires, A., Pita, C., and Erzini, K. (2003). Food availability and the feeding ecology of ichthyofauna of a Ria Formosa (South Portugal) water reservoir. Estuaries 26, 938–948. doi: 10.1007/BF02803352
Gerlach, G., Atema, J., Kingsford, M. J., Black, K. P., and Miller-Sims, V. (2007). Smelling home can prevent dispersal of reef fish larvae. Proc. Natl. Acad. Sci. U.S.A. 104, 858–863. doi: 10.1073/pnas.0606777104
Glantz, S. A. (2012). Primer of Biostatistics, 7th Edn. New York, NY: McGraw Hill. Gross, M. R. (1996). Alternative reproductive strategies and tactics: diversity within
sexes. Trends Ecol. Evol. 11, 92–898. doi: 10.1016/0169-5347(96)81050-0 Hale, R., Downes, B. J., and Swearer, S. E. (2008). Habitat selection as a source of
inter-specific differences in recruitment of two diadromous fish species. Freshw. Biol. 53, 2145–2157. doi: 10.1111/j.1365-2427.2008.02037.x
Hare, J. A., Thorrold, S., Walsh, H., Reiss, C., Valle-Levinson, A., and Jones, C. (2005). Biophysical mechanisms of larval fish ingress into Chesapeake Bay. Mar. Ecol. Prog. Ser. 303, 295–310. doi: 10.3354/meps303295
Harmelin-Vivien, M. L., Harmelin, J. G., and Leboulleux, V. (1995). “Microhabitat requirements for settlement of juvenile sparid fishes on Mediterranean rocky shores,” in Space Partition within Aquatic Ecosystems; Proceedings of the Second International Congress of Limnology and Oceanography held in Evian, ed G. Balvay (Dordrecht: Springer), 309–320.
Helfman, G. S., Collette, B. B., Facey, D. E., and Bowen, B. W. (2009). The Diversity of Fishes. Biology, Evolution, and Ecology, 2nd Edn. Petaling Jaya: Wiley-Blackwell.
Huijbers, C. M., Nagelkerken, I., Lössbroek, P. A. C., Schulten, I. E., Siegenthaler, A., Holderied, M. W., et al. (2012). A test of the senses: fish select novel habitats by responding to multiple cues. Ecology 93, 46–55. doi: 10.1890/10-2236.1
Isnard, E., Tournois, J., McKenzie, D. J., Ferraton, F., Bodin, N., Aliaume, C., et al. (2015). Getting a good start in life? A comparative analysis of the quality of lagoons as juvenile habitats for the gilthead seabream Sparus aurata in the Gulf of Lions. Estuar. Coast. 38, 1937–1950. doi: 10.1007/s12237-014-9939-6
James, N. C., Cowley, P. D., Whitfield, A. K., and Kaiser, H. (2008). Choice chamber experiments to test the attraction of postflexion Rhabdosargus holubi larvae to water of estuarine and riverine origin. Estuar. Coast. Shelf Sci. 77, 143–149. doi: 10.1016/j.ecss.2007.09.010
Kerr, L. A., Cadrin, S. X., and Secor, D. H. (2010). The role of spatial dynamics in the stability, resilience, and productivity of an estuarine fish population. Ecol. Appl. 20, 497–507. doi: 10.1890/08-1382.1
Killen, S. S., Marras, S., Ryan, M. R., Domenici, P., and McKenzie, D. J. (2012). A relationship between metabolic rate and risk-taking behaviour is revealed during hypoxia in juvenile European sea bass. Funct. Ecol. 26, 134–143. doi: 10.1111/j.1365-2435.2011.01920.x
Kramer, D. L., Rangeley, R. W., and Chapman, L. J. (1997). “Habitat selection: patterns of spatial distribution from behavioural decisions,” in Behavioural Ecology of Teleost Fishes, ed J. J. Godin (New York, NY: Oxford University Press), 37–80.
Kristan, W. B. III. (2003). The role of habitat selection behavior in population dynamics: source-sink systems and ecological traps. Oikos 103, 457–468. doi: 10.1034/j.1600-0706.2003.12192.x
Lecchini, D., Shima, J., Banaigs, B., and Galzin, R. (2005). Larval sensory abilities and mechanisms of habitat selection of a coral reef fish during settlement. Oecology 143, 326–334. doi: 10.1007/s00442-004-1805-y
Lehtiniemi, M. (2005). Swim or hide: predator cues cause species specific reactions in young fish larvae. J. Fish Biol. 66, 1285–1299. doi: 10.1111/j.0022-1112.2005.00681.x
Lima, S. L., and Dill, L. M. (1990). Behavioral decisions made under the risk of predation: a review and prospectus. Can. J. Zool. 68, 619–640. doi: 10.1139/z90-092
Mathot, K. J., Wright, J., Kempenaers, B., and Dingemanse, N. J. (2012). Adaptive strategies for managing uncertainty may explain personality-related differences in behavioural plasticity. Oikos 121, 1009–1020. doi: 10.1111/j.1600-0706.2012.20339.x
McCormick, M. I., and Manassa, R. (2008). Predation risk assessment by olfactory and visual cues in a coral reef fish. Coral Reefs 27, 105–113. doi: 10.1007/s00338-007-0296-9
Mercier, L., Mouillot, D., Bruguier, O., Vigliola, L., and Darnaude, A. M. (2012). Multi-element otolith fingerprints unravel sea–lagoon lifetime migrations of gilthead sea bream Sparus aurata. Mar. Ecol. Prog. Ser. 444, 175–194. doi: 10.3354/meps09444
Morais, P., Faria, A., Chícharo, M. A., and Chícharo, L. (2009). The unexpected occurrence of late Sardina pilchardus (Walbaum, 1792) (Osteichthyes: Clupeidae) larvae in a temperate estuary. Cah. Biol. Mar. 50, 79–89. Available online at: http://application.sb-roscoff.fr/cbm/issue.htm? execution=e3s1
Moretti, A., Fernandez-Criado, M. P., Cittollin, G., and Guidastri, R. (1999). Manual on Hatchery Production of Seabass and Gilthead Seabream. Rome: FAO. Morote, E., Olivar, M. P., Villate, F., and Uriarte, I. (2010). A comparison of anchovy (Engraulis encrasicolus) and sardine (Sardina pilchardus) larvae feeding in the Northwest Mediterranean: influence of prey availability and ontogeny. ICES J. Mar. Sci. 67, 897–908. doi: 10.1093/icesjms/fsp302 Olivar, M. P., Diaz, M. V., and Chícharo, M. A. (2009). Tissue effect
on RNA/DNA ratios of marine fish larvae. Sci. Mar. 73, 171–182. doi: 10.3989/scimar.2009.73s1171
Olofsson, H., Ripa, J., and Jonzén, N. (2009). Bet-hedging as an evolutionary game: the trade-off between egg size and number. Proc. R. Soc. Lond. B Biol. Sci. 276, 2963–2969. doi: 10.1098/rspb.2009.0500
Paris, C. B., Atema, J., Irisson, J. O., Kingsford, M., Gerlach, G., and Guigand, C. M. (2013). Reef odor: a wake up call for navigation in reef fish larvae. PLoS ONE 8:e72808. doi: 10.1371/journal.pone.0072808
Pattrick, P., and Strydom, N. A. (2009). Swimming abilities of wild-caught, late-stage larvae of Diplodus capensis and Sarpa salpa (Pisces: Sparidae) from temperate South Africa. Estuar. Coast. Shelf Sci. 85, 547–554. doi: 10.1016/j.ecss.2009.09.022
Qin, S., Yin, H., Yang, C., Dou, Y., Liu, Z., Zhang, P., et al. (2015). A magnetic protein biocompass. Nat. Mater. 15, 217–226. doi: 10.1038/nmat4484 Radford, C. A., Sim-Smith, C. J., and Jeffs, A. G. (2012). Can larval snapper,
Pagrus auratus, smell their new home? Mar. Freshw. Res. 63, 898–904. doi: 10.1071/MF12118
Railsback, S. F., and Harvey, B. C. (2002). Analysis of habitat- selection rules using an individual-based model. Ecology 83, 1817–1830. doi: 10.1890/0012-9658(2002)083[1817:AOHSRU]2.0.CO;2
Robinson, S. M. C., and Ware, D. M. (1988). Ontogenetic development of growth rates in larval Pacific herring, Clupea harengus PalIasi, measured with RNA-DNA ratios in the Strait of Georgia, British Columbia. Can. J. Fish. Aquat. Sci. 45, 1422–1429. doi: 10.1139/f88-166
Schieler, B. M., Hale, E. A., and Targett, T. E. (2014). Daily variation in ingress of fall-spawned larval fishes into Delaware Bay in relation to alongshore and along-estuary wind components. Estuar. Coast. Shelf Sci. 151, 141–147. doi: 10.1016/j.ecss.2014.10.004
Sheaves, M., Baker, R., Nagelkerken, I., and Connolly, R. M. (2015). True value of estuarine and coastal nurseries for fish: incorporating complexity and dynamics. Estuar. Coast. 38, 401–414. doi: 10.1007/s12237-014-9846-x Shepherd, T. D., and Litvak, M. K. (2004). Density-dependent habitat selection and
the ideal free distribution in marine fish spatial dynamics: considerations and cautions. Fish Fish. 5, 141–152. doi: 10.1111/j.1467-2979.2004.00143.x Staaterman, E., Paris, C. B., and Kough, A. S. (2014). First evidence of fish larvae
producing sounds. Biol. Lett. 10:20140643. doi: 10.1098/rsbl.2014.0643 Tancioni, L., Mariani, S., Maccaroni, A., Mariani, A., Massa, F., Scardi, M., et al.
(2003). Locality-specific variation in the feeding of Sparus aurata L.: evidence from two Mediterranean lagoon systems. Estuar. Coast. Shelf Sci. 57, 469–474. doi: 10.1016/S0272-7714(02)00376-1
Teodósio, M. A., Paris, C. B., Wolanski, E., and Morais, P. (2016). Biophysical processes leading to the ingress of temperate fish larvae into estuarine nursery areas: a review. Estuar. Coast. Shelf Sci. 183, 187–202. doi: 10.1016/j.ecss.2016.10.022
Tournois, J., Ferraton, F., Velez, L., McKenzie, D. J., Aliaume, C., Mercier, L., et al. (2013). Temporal stability of otolith elemental fingerprints discriminates among lagoon nursery habitats. Estuar. Coast. Shelf Sci. 131, 182–193. doi: 10.1016/j.ecss.2013.07.006
Whitfield, A. K. (1994). Abundance of larval and 0+ juvenile marine fishes in the lower reaches of three southern African estuaries with differing freshwater inputs. Mar. Ecol. Prog. Ser. 105, 257–267.
Conflict of Interest Statement: The authors declare that the research was conducted in the absence of any commercial or financial relationships that could be construed as a potential conflict of interest.
Copyright © 2017 Morais, Parra, Baptista, Ribeiro, Pousão-Ferreira and Teodósio. This is an open-access article distributed under the terms of the Creative Commons Attribution License (CC BY). The use, distribution or reproduction in other forums is permitted, provided the original author(s) or licensor are credited and that the original publication in this journal is cited, in accordance with accepted academic practice. No use, distribution or reproduction is permitted which does not comply with these terms.