DOI: 10.1002/eng2.12029
R E S E A R C H A R T I C L E
Season influence on rapid thermal sensation assessment by
young adults
Denis A. Coelho
1,2,3Pedro D. Silva
1,21Department of Electromechanical Engineering, Convento de Santo António, Universidade da Beira Interior, Covilhã, Portugal
2Centro de Ciências e Tecnologias Mecânicas e Aeroespaciais, Convento de Santo António, Covilhã, Portugal 3School of Engineering, Department of Supply Chain and Operations Management, Jönköping University, Jönköping, Sweden
Correspondence
Denis A. Coelho, Department of
Electromechanical Engineering, Convento de Santo António, Universidade da Beira Interior, 6201-001 Covilhã, Portugal; or Centro de Ciências e Tecnologias Mecânicas e Aeroespaciais, Convento de Santo António, 6201-001 Covilhã, Portugal; or School of Engineering, Department of Supply Chain and Operations Management, Jönköping University, Gjuterigatan 5, Jönköping, 551 11, Sweden.
Email: denis@ubi.pt; denis.coelho@ju.se
Funding information
Fundação para a Ciência e a Tecnologia, Grant/Award Number:
UID/EMS/00151/2013 C-MAST
Thermal comfort is one of the most important ergonomic aspects of building occupancy. In this research, laboratory experiments are performed in a climatic chamber and described in detail. Experiments are carried out under two sce-narios: with two different college students cohorts and with five different but comparable experimental conditions in each cohort. Three hundred twenty-two individual assessments under specific controlled thermal environment condi-tions are collected. The actual thermal sensation assessments obtained in the experiments are compared to the results obtained by a predicted mean vote (PMV) model. The correlation analysis shows that statistically significant dif-ferences are meaningful between the spring-summer and the autumn-winter experiments but not between genders. This paper discusses the plausible fac-tors contributing to the different correlations experienced in the autumn-winter and spring-summer experiments. A correction factor between PMV according to Fanger's comfort equation and the actual thermal sensation values reported by the participants is also sought with a focus on the seasonal effects. The pre-dicted results are in good agreement with the experimental results. This allows for further considerations about the influence of the season on the initial thermal sensations experienced by young adults.
K E Y WO R D S
association analysis, climatic chamber, correction factor, predicted mean vote, seasonal differences, thermal comfort
1
I N T RO D U CT I O N
1.1
Background
Building design requires to consider thermal sensation of its occupants at an early phase of the design process. Hence, good models are needed for predictive evaluation of thermal sensation. Thermal comfort is defined by standard ISO 77301 as the “state of mind that expresses satisfaction with the thermal environment.” Despite being a simple and consensual definition, it is not straightforwardly translated into measurable physical parameters. Moreover, thermal environment is one of a myriad of potential sources of disruption to performance, health, comfort, and well being,2such as noise, lighting, air quality, vibrations, and inadequately set psychosocial factors.3
This is an open access article under the terms of the Creative Commons Attribution-NonCommercial-NoDerivs License, which permits use and distribution in any medium, provided the original work is properly cited, the use is non-commercial and no modifications or adaptations are made.
© 2019 The Authors. Engineering Reports Published by John Wiley & Sons Ltd.
Engineering Reports. 2019;1:e12029. wileyonlinelibrary.com/journal/eng2 1 of 14
The predicted mean vote (PMV) model is an internationally accepted model4-8to describe the predicted average ther-mal perception of building occupants, which was created by P.O. Fanger (1934-2006)9,10based on laboratory research. This model was developed by resorting to college-aged participants experimentally set in nonchanging environmental conditions and was meant for use in air-conditioned buildings located within moderate thermal climate zones.10Fanger developed his model in the late 1960s, a time when environmental techniques improved, wealth increased, and working conditions were a concern.11 Fanger's method is intended to enable heating and air conditioning engineers to predict, for any type of activity and clothing, all the combinations of thermal factors in the environment for which the highest percentage of people experience thermal comfort.12
1.2
Theory and aim
Calculations of thermal sensations are commonly done by Fanger's energy balance models.13 However, more recent experimental studies have shown that observed and calculated values might differ considerably14-18leading to the devel-opment of theories explaining the differences according to factors such as “short-term thermal adaptation” and “thermal expectation.”19
Additionally, thermal sensation of females and males in the same thermal environment, activity, and clothing insula-tion has been reported as being consistently different.20Chun et al21also indicate that there is a strong interaction and influence of people's experience with outdoor weather and their indoor thermal comfort.
A PMV model of thermal comfort is currently used worldwide to assess thermal comfort.22-24However, multiple pieces of evidence have shown that the PMV model is not generally applicable in every building and climate zone.25-30Given the aforementioned evidence and interest for architectural design and building engineering in ascertaining whether the dis-crepancies found in other countries and climatic zones regarding the PMV model of thermal sensation are also applicable to Portugal, the study reported in this article focuses on a Portuguese sample of young adults. The current study hence contributes to ascertain the level of validity of the PMV model of thermal sensation, by investigating the differences (with statistical significance assessed) between self-assessed thermal sensation and PMV. These differences are evaluated across two important dimensions: climatic season (autumn-winter versus spring-summer), as well as the gender of the partici-pants (female versus male). Moreover, a correction factor between the PMV according to Fanger's comfort equation and actual thermal sensation values reported by the participants in the experiments is sought through analysis of correlation and regression analysis.
The following section describes the methods, with focus on the experimental design, including the features of the climatic chamber used, how the data collection was done (including the measurements done using sensors, the PMV calculator used, and the subjective thermal sensation assessment), and the overview of the statistical analysis carried out. The results are presented according to season and are also presented according to gender. Results of regression analysis are presented modeling the thermal sensation on other experimental variables. The results and analysis section conclude with a discussion and an overview of the limitations of the study. Finally, the conclusions and future studies are outlined.
2
M ET H O D S
2.1
Experimental design
The experiments were designed to enable comparison between the PMV and thermal sensation (as the actual mean vote) akin to previous work by Chen et al,15Del Ferraro et al,17and Yang et al.18Laboratory experiments in a controlled climatic chamber were the basis to evaluate adequateness of the PMV equation to thermal sensation assessment by a Portuguese sample. Experiments were carried out in two occasions (May and December 2014), with two different cohorts of college students, under five experimental conditions in each cohort. The conditions in each of the five trials carried out in each experimental block were controlled. The climatic environmental conditions in each trial are reported in Table 1. As shown in Table 1, for the sake of readability, the type of experiments are classified in six categories (A, B, C, and E comparable across the two seasons; D only in the autumn-winter block and F only in the spring-summer block). Although the ambient temperature happened to be comparable on the experimental occasions in different seasons, the length of daylight was very different (much shorter in December than in May).
The trial of each condition was performed in a different day and all the participants were exposed to the five conditions. The climatic conditions were selected based on an attempt to cover varying conditions of the PMV spectrum from very cold to very warm, and in between, to sweep the spectrum of the PMV scale. However, only four of these experimental
Season Autumn-winter Spring-summer Trial 1 2 3 4 5 1 2 3 4 5 Comparability A B C D E A B C E F Tind[◦C] 13.5 15.5 21.8 24.6 27.5 22.6 19.8 25.7 30.1 31.1 Top[◦C] 14.5 16.1 20.4 22.7 25.1 21.9 19.4 24.7 28.9 30.0 Tg [◦C] 14.6 17.0 20.9 23.1 25.5 22.6 20.1 25.2 29.4 30.5 RHind[%] 49.1 37.2 33.6 29.0 24.1 42.8 43.4 32.2 27.8 57.2 v [m/s] 0.09 0.06 0.07 0.09 0.11 0.08 0.07 0.10 0.12 0.11 Tout[◦C] 9.1 6.6 7.0 9.5 5.2 8.0 10.6 13.1 13.6 13.4 RHout[%] 68.0 81.0 72.0 68.0 89.5 85.5 72.0 64.5 71.5 73.5
TABLE 1 Average values of measured thermal parameters in each season and trial (outside temperature and relative humidity are the daily average for the whole day in which the trial took place)
climate conditions are comparable across the two climatic seasons of the year, yielding six different conditions (assessed by proximity of calculated average PMV). The difficulties in conditioning the environment and compensating for different levels of clothing worn by the subjects in the two times of the year, led to the limitation of comparability reported.
A total of 37 college students (28 male participants and nine female participants) aged 20 to 24 years took part in the May 2014 experiments. The December 2014 experiments were participated by a different group of 29 college students, with 14 female participants and 15 male participants. In both seasons, students from architecture, industrial design, and industrial engineering programs took part in the experiments.
A total of 322 individual assessments of specific controlled thermal environment conditions were collected. Subjects sat down in a chair inside the chamber and evaluated the thermal environment (this was the only task performed by the participants, with a metabolic rate of 1 MET, according to the PMV equation reference values). The climate chamber is located inside a climate-controlled laboratory. This indoor climate-controlled laboratory was set to neutral invariant ther-mal comfort conditions and not the same as the climate chamber that changed in every sitting trial. Acclimatization to this indoor climate-controlled laboratory environment took place for 30 minutes, while each subject answered a survey focus-ing on metabolism and clothfocus-ing insulation. Subjects then, one by one, took turns at sittfocus-ing for 3-minute uninterrupted periods inside the climate-controlled chamber, which was inside the aforementioned climate-controlled laboratory. At the end of their 3-minute-long stay inside the climatic chamber, performing a metabolically neutral activity, subjects assessed their thermal sensation. Each participating subject in one of the two seasons undertook the sitting in the chamber in five different days, with different climatic conditions each time. Different participants took part in the autumn-winter exper-iments in December 2014, compared to the ones that had taken part in the spring-summer experexper-iments in May the same year. Participants were dressed as they pleased, and the clothing insulation was individually assessed for each individual case and for each trial, in both winter and summer trials.
Predicted mean vote (PMV) and thermal sensation as assessed in the climatic chamber are compared, yielding correla-tion coefficients that differ between the spring-summer experiments and the autumn-winter experiments. Gender-based differences are also explored in the data.
2.2
Climate chamber
The climate chamber used in this work presents inner dimensions of 1.5 m, 1.2 m, and 1.0 m, with one fully transparent see-through wall, and allows reproducing the inside or outside climatic conditions of a building. The walls of the cham-ber are made up of 15-cm-thick XPS (extruded polystyrene), with this material limited by 2-cm-thick MDF panels. The chamber was connected to an open-loop independent air conditioning system continuously providing fresh air at preset values of temperature (Tind) and humidity (RHind). The imposed conditions are monitored in real time through a dedi-cated data acquisition system. A closed circuit with an air-conditioned unit ensured constant values of air temperature, air velocity, and air relative humidity inside the climatic chamber. The experimental trials started only after stabilization of conditions inside the chamber.
This climatic chamber had already been used in previous research work and additional constructive details can be found in the work of Pires et al.31A chair was placed in a central position inside the chamber to accommodate the occupant in the sitting position. To allow access to the interior of the climatic chamber, its closing and opening were achieved through the use of a removable frame. This frame was covered with a clear plastic film to allow the occupant to visualize the outside environment, thereby reducing the feeling of being in a confined space. An unbalanced air flow rate was used at the inlet and outlet of the climate chamber to ensure a slight internal overpressure. In this way, the entrance of the student inside the climatic chamber resulted in a minimal disturbance of the interior environment.
TABLE 2 Pairing of experimental trials across seasons based on calculated predicted mean vote (PMV) mean for a whole cohort in each season
Calculated PMV Spring-summer Autumn-winter Paired trial Mean SD Mean SD
A −2.4 0.46 −2.0 0.65 B −1.4 0.40 −1.3 1.01 C −0.5 0.19 −0.5 0.56 D --- --- +0.2 0.82 E +1.0 0.08 +0.6 0.51 F +1.7 0.07 ---
---2.3
Measurements
The measurements inside the climatic chamber were performed using a thermal comfort system including a thermal comfort data logger (INNOVA 1221) and several transducers. The inside environmental conditions of the climatic cham-ber were monitored in real time using the software of this thermal comfort equipment to ensure stable test conditions. The air temperature was measured using a radiantly shielded platinum sensor (Pt100) with an accuracy of ±0.2◦C. A wet bulb temperature transducer that complies with ISO724332was used to measure the wet bulb air temperature with an accuracy of ±0.5◦C.
To take account of the thermal radiation exchange between the occupant and the climatic chamber walls, a globe tem-perature (Tg) transducer was used. This sensor complies with the ISO724332and ISO772633standards and consists of a Pt100 temperature-sensing element situated at the centre of a globe with 150 mm in diameter and surface emissivity of 0.98. This sensor allows a globe temperature measurement with an accuracy of ±0.5◦C.
In addition, the operative temperature (Top) was measured directly in the chamber using an operative temperature transducer that complies with the ISO7726 standard.33This sensor presents a gray surface of ellipsoid shape and includes a Pt100 resistor in a four-wire configuration. The transducer was placed at an angle of 30◦from the vertical to represent the occupant sitting position and allows an operative temperature measurement with an accuracy of ±0.3◦C. Moreover, the operative temperature was also calculated from averaging the separate air temperature and the mean radiant temperature readings. The operative temperature was calculated for means of validation, as it is also obtained from the sensor.
The indoor air velocity (v) was measured with an omnidirectional air velocity transducer based on the constant temper-ature difference anemometer principle. According to the range of velocity values obtained during the experimental work the air velocity accuracy can be reported as better than ±0.06 m/s.
Local climatic data as outdoor air temperature (Tout) and outdoor relative humidity (RHout) were obtained from a Davis Vantage Pro2 weather station located in the university campus. These data were gathered every 10 minutes and average daily values were calculated. An overview of the climatic data collected inside the chamber and the outdoors is shown in Table 2.
2.4
Predicted mean vote
The Predicted Mean Vote Calculator prepared and made freely and publicly available by Håkan Nilsson34was used. To use this calculator, yielding operative temperature, PMV and predicted percentage of dissatisfied (PPD) (Figure 1), a number of parameters were provided as input to the calculator. The parameters, bound by preset intervals, are clothing (Clo), [0 to 2clo], air temperature (◦C) [10 to 30◦C], mean radiant temperature (◦C) [10 to 40◦C], activity (Met) [0.8 to 4 Met], air speed (m/s) [0 to 1 m/s], and relative humidity (%) [30 to 70%].
The PMV calculator was used to obtain the calculated PMV value individually, based on the values measured in real time by the instruments and a detailed assessment of the clothing insulation level of the individual participant in each of the sitting trials in the climatic chamber and considering the level of activity of 1 Met, which corresponds to the activity of sitting. The same calculator was used to evaluate operative temperature starting from values of the mean radiant temper-ature, air tempertemper-ature, and velocity. The mean radiant temperature was obtained according with the procedure set in the ISO7726 standard.33A plot of the measured operative temperature against the calculated operative temperature is shown in Figure 2 and a Pearson correlation factor of 0.988 was found between these two parameters.
2.5
Subjective assessment of thermal sensation
Upon arrival to the laboratory, setting each participant was given a survey that assessed the participant's physical condi-tions and psychological state at the time of the trial. Every trial was carried out in a different day of the week. Participants were sitting and resting for 15 to 30 minutes prior to the start of each experiment. After this, an individual participant
FIGURE 1 The relationship between predicted mean vote (PMV) and predicted percentage of dissatisfied (PMD)34(originally proposed by Fanger35)
FIGURE 2 Experimental (Topexp) versus calculated (Topcalc) operative temperature in the 10 climatic chamber conditions (linear interpolation determination coefficient shown)
stepped inside the climatic chamber. The climatic chamber had been prepared and thermally stabilized and instrumented. The transparent door of the chamber was then sealed to maintain the internal thermal environment. The participant was invited to sit in a relaxed manner in the chair supplied within the chamber. Upon completing the sitting trial in the cham-ber, the participant was asked “What is your current sensation with regards to the thermal environment?” and registered her or his thermal sensation and then exited the climatic chamber. This process was repeated for every participant.
The scale used for thermal sensation assessment was the Portuguese version of the ASHRAE thermal sensation scale.36 This scale consists of −3 (cold), −2 (cool), −1 (slightly cool), 0 (neutral), +1 (slightly warm), +2 (warm), and + 3 (hot). This scale is directly equivalent to the results of the PMV calculation from Fanger's models.13
2.6
Statistical analysis
IBM SPSS v.23 was the software used to support the statistical analysis, which consisted of both parametric and nonpara-metric tests. Pearson correlation coefficients were obtained across pairs of variables, considering the data altogether and subsets of data according to dichotomous selections (eg, gender of participant, season when trial took place). Moreover, linear regression analysis was fitted to the prediction of Thermal sensation based on the calculated PMV and the thermal environment physical factors. Nonparametric tests (Mann-Whitney U test and Kolmogorov-Simonov test) were deployed to ascertain differences among PMV distributions of cohorts for specific selection variables.
3
R E S U LT S A N D A NA LY S I S
The average and standard deviation of the PMV calculations for all individuals involved in each trial are shown in Table 2. Predicted mean vote calculated for each individual in each trial was different; hence, comparability is limited. This is a
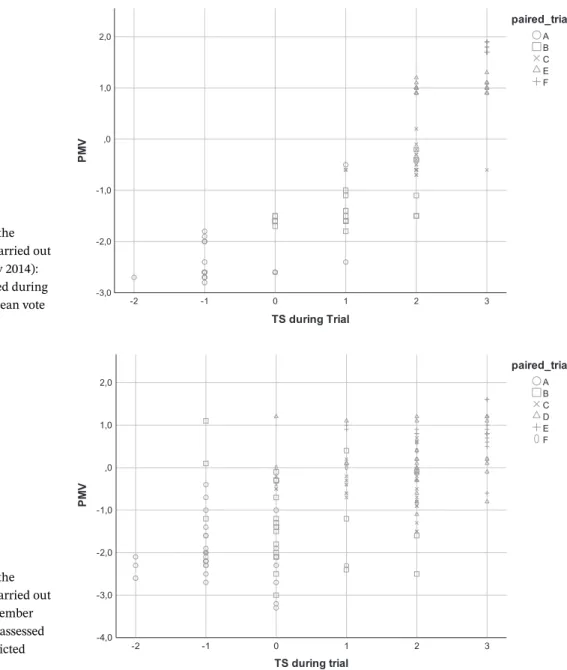
FIGURE 3 Overall outlook for the results of the experimental trials carried out in the spring-summer season (May 2014): thermal sensation (TS) self-assessed during trial versus calculated predicted mean vote (PMV) value
FIGURE 4 Overall outlook for the results of the experimental trials carried out in the autumn-winter season (December 2014): thermal sensation (TS) self-assessed during trial versus calculated predicted mean vote (PMV) value
consequence of limited controls in place, but it brings the experiment closer to naturalistic conditions, eg, each person in an indoor environment may wear different clothing, unless there is a uniform policy in place.
3.1
Spring-summer trials
The scatterplot of the results obtained for the trials carried out in May 2014 is shown in Figure 3. The Pearson correlation factor between the calculated PMV and the self-assessed thermal sensation computed for the 185 data points encompassed yielded r = 0.871 (p< 0.0005).
3.2
Autumn-winter trials
The scatterplot of the results obtained for the trials carried out in December 2014 is shown in Figure 4. The Pearson correlation factor between the calculated PMV and the self-assessed thermal sensation computed for the 137 data points encompassed yielded r = 0.667 (p< 0.0005).
3.3
Female subjects
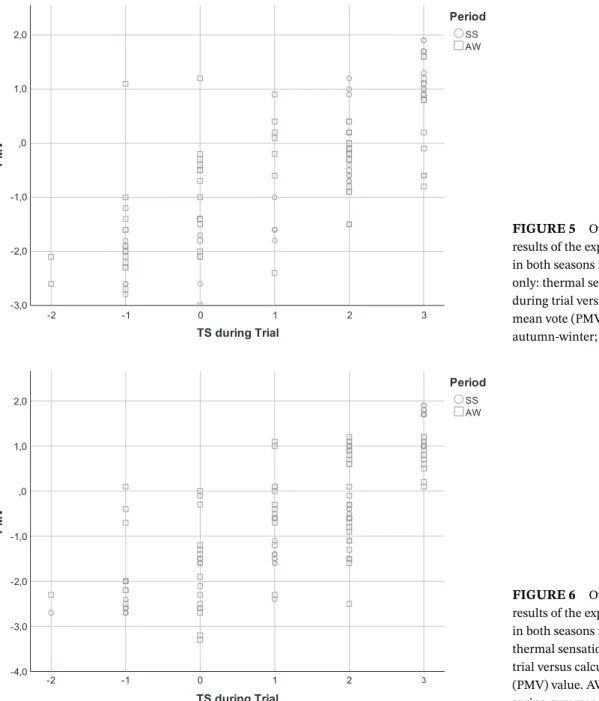
When considering the female participants only (Figure 5), the Pearson correlation factor between PMV and thermal sensation combining the experiments carried out in the two seasons is r = 0.762 (p< 0.0005). When looking only at
FIGURE 5 Overall outlook for the results of the experimental trials carried out in both seasons for female participants only: thermal sensation (TS) self-assessed during trial versus calculated predicted mean vote (PMV) value. AW,
autumn-winter; SS, spring-summer
FIGURE 6 Overall outlook for the results of the experimental trials carried out in both seasons for male participants only: thermal sensation (TS) self-assessed during trial versus calculated predicted mean vote (PMV) value. AW, autumn-winter; SS, spring-summer
the spring-summer data, the correlation is r = 0.686 (p< 0.0005), whereas it is higher at r = 0.850 (p < 0.0005) for the autumn-winter data, considering only data from female subjects.
3.4
Male subjects
When focusing on the male participants only (Figure 6), the Pearson correlation factor between PMV and thermal sensation combining the experiments carried out in the two seasons is r = 0.821 (p< 0.0005).
When looking only at the spring-summer data, the correlation is r = 0.656 (p< 0.0005), whereas it is higher, at r = 0.878 (p< 0.0005) for the autumn-winter data, considering only data from male subjects.
3.5
Seasonal differences across comparable trials
The mean difference between calculated PMV and the self-assessed thermal sensation is shown in Figure 7, according to the trial matches shown in Table 1 and Table 2. Inspection of Figure 7 reveals a V-shaped pattern in both seasons and that differences between calculated PMV and self-assessed thermal sensation display reversing behaviors, progressing toward neutral PMV values (zero value and values close to zero in the PMV scale) and then diminishing toward higher PMV
FIGURE 7 Seasonal comparison of differences across experimental trials A through F (see Tables 1 and 2): thermal sensation (TS) self-assessed during trial versus calculated predicted mean vote (PMV) value. AW, autumn-winter; SS, spring-summer
values. Moreover, there is an interesting reversal in that differences are greater for spring-summer than for autumn-winter in the lower PMV values region (experiments A, B, and C) and vice versa for the higher PMV values region (experiments D, E, and F).
Nonparametric statistical testing (independent samples Kolmogorov–Smirnov test) yielded statistically significant dif-ferences across the two seasons for all comparable experiments: A (p = 0.048), B (p = 0.005), C (p = 0.032), and E (p = 0.003). Additionally, the independent samples Mann-Whitney U test led to significant differences for experiments B (U = 321; p = 0.009) and E (U = 678; p = 0.006).
3.6
Regression analysis
Season and gender, as well as the remaining variables registered in the study, were the basis on which to establish a linear regression of the reported thermal sensation as a dependent variable. The autumn-winter season was coded as −1, with the spring-summer season coded as +1, for the independent variable Season (number). Results using the backward method yielded a determination coefficient of 0.746 with the unstandardized coefficients, errors, and significance shown in Table 3.
In regression analysis, unstandardized coefficients or predicted values are useful for predicting things in the real world, whereas standardized coefficients make it easier to compare different predictors to see which one is important. The experi-mental data produced two highly significant models of regression, with similar determination coefficients, and the results show the simplest one (the model shown in Equation 1, with a coefficient of determination of 0.746). The model shown in Equation 2 is based on four variables, for a marginal improvement in the coefficient of determination, which stands at 0.752.
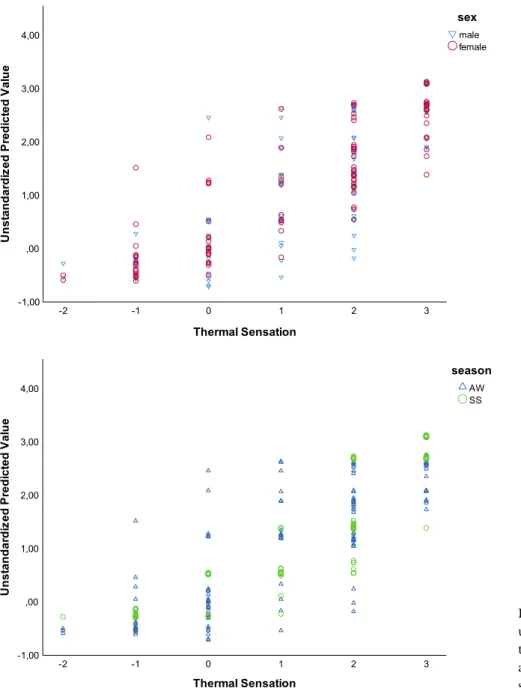
Predicted TS = −4.097 + 0.178 PMV + 0.244 Top−0.434 Season (number) (1) Predicted TS = 1.898 + 0.311 PMV + 0.245 Top−0.232 Tout−4.978 RHout (2) Scatterplots of the unstandardized predicted value according to the regression model shown in Table 3 (according to Equation 1) are depicted in Figure 8, showing both seasons and sex differences. As a result of the results obtained from TABLE 3 Regression coefficients for
thermal sensation, obtained from the linear regression using the backward method in IBM SPSS v.25
Model Unstandardized coefficients t Significance
B SE
(Constant) −4.097 0.575 −7.124 0.000
PMV 0.178 0.070 2.549 0.011
Operative temperature (Top) 0.244 0.024 10.037 0.000
Season (number) −0.434 0.070 −6.221 0.000
FIGURE 8 Scatterplots of
unstandardized predicted value according to the regression model shown in Table 3 and according to Equation 1, showing both seasons and sex differences
regression analysis for the most succinct regression, modeling thermal sensation as a function of the operative temper-ature, the season, and the PMV obtained from Fanger's comfort equation, the isographs for constant values of thermal sensation per season were graphed and are shown in Figure 9. This figure illustrates that the operative temperature range based on thermal sensation between slightly cool and slightly warm depends on the season: higher values are obtained in the warm season. Besides, regardless of the season, this operative temperature range tends to decrease with increas-ing values of the PMV. It must be pointed out that only operative temperature values correspondincreas-ing to the upper limit of the warm season (TS = 1) are inside of the current ASHRAE standard comfort zone36; all other isocurves are outside this region.
An alternative regression analysis was carried out considering slightly different sets of variables, yielding the results depicted in Table 4. Scatterplots of the unstandardized predicted value according to the regression model shown in Table 4 (according to Equation 2) are depicted in Figure 10, showing both seasons and sex differences. The coefficient of deter-mination for the alternative regression model is 0.752. Correlation between PMV and the predicted values from the first regression analysis was 0.864, whereas it was 0.867 for the alternative. To set this in context, the correlation factor between PMV and the experimental thermal sensation is 0.807.
FIGURE 9 Isocurves for PMV as a function of operative temperature [◦C], for a given thermal sensation (TS) constant and for a given season, springing from the results of regression analysis of thermal sensation on predicted mean vote (PMV), operative temperature, and season
TABLE 4 Regression
coefficients for thermal sensation, obtained from an alternative linear regression using the backward method in IBM SPSS v.25
Model Unstandardized coefficients t Significance
B SE
(Constant) 1.898 0.777 2.443 0.015
PMV 0.311 0.056 5.592 0.000
Operative temperature (Top) 0.245 0.023 10.620 0.000 Outside temperature (Tout) −0.232 0.034 −6.728 0.000 External relative humidity (RHout) −4.978 0.995 −5.006 0.000
Abbreviation: PMV, predicted mean vote.
3.7
Discussion and limitations of the study
Analysis of correlation suggests improved performance of the PMV model in the spring-summer season as opposed to the autumn-winter season for the sample under study. Other studies have noticed differences across climates,37supporting higher comfortable indoor temperatures in warmer climates.
In both seasons the PMV model underpredicts the thermal sensation reported by the students and consequently over-predicts the neutral operative temperature (comfort temperature). The same behavior was found by other authors.38-40 However, an opposite behavior, over prediction of the thermal sensation, can be found in several other studies.41-43 This behavior (underprediction and/or overprediction of the thermal sensation) depends on climatic conditions, season, clothing isolation, and operative temperature.41,42,44,45
As reported by other researchers,46 Equations 1 and 2 also show that parameters that are not included in the PMV model, such as outdoor air temperature and relative humidity or season, are important factors to predict thermal comfort. According to Karjalainen,47more than half of the laboratory and field studies show that females express more dissatis-faction than males under the same indoor environmental conditions. However, in this study, no significant correlations were found according to sex in relation to thermal sensation, with a statistically insignificant Pearson correlation factor of 0.034.
This study is not without limitations. One of the limitations is the fact that the study was carried out in teaching settings and that the students participating for course credit were responsible for part of the experimental controls. The clothing insulation values were self-assessed individually by each participating student, based on predefined values in tabular format. Moreover, the actual time within the thermal climatic chamber was 3 minutes per participant in each sitting trial. This is a short period; hence, the results should be looked as rapid thermal assessment, from a neutral thermal environment as a starting point. This notwithstanding, the first impressions on the thermal environment may influence the desire to change the temperature settings and, hence, to be overly important. A third major limitation of this study has to do with the limitations of the thermal comfort equation, according to ISO 7730, the ambient thermal conditions in the climate chamber in at least one of the trials were slightly beyond the envelope for use of the equation (indoor temperature slightly over 30◦C). This set of major limitations detract from the quality of the study, yet the major findings are still
FIGURE 10 Scatterplots of
unstandardized predicted value according to the alternative regression model shown in Table 4, showing both seasons and sex differences
applicable, concerning the contribution of the season (whether due to daylight duration differences, or temperature itself) to the indoor thermal environment assessment. In addition, due to somewhat similar values of outside temperature in both occasions when tests took place, it is also a consequence that Equation 2, which takes the outside temperature into account, was not modeled on high temperatures typical of summer days.
4
CO N C LU S I O N A N D F U T U R E ST U D I E S
Individuals' considerations on thermal comfort constantly change overtime. There is hence a need for up to date stud-ies that develop extended but rapid evaluation of the thermal environment, from a neutral thermal condition (eg, climate-controlled laboratory environment) to a modified and climate-controlled chamber. This work sheds light on the importance of taking the prevailing outdoor climate conditions into account when evaluating the thermal sensation through a model. The time lag required for an individual to adapt to the new thermal conditions might be relatively long. This long-term adjustment is shown to be dependent on the yearly cycles in the seasons, especially in places away from the equator, where temperature and daylight duration can vary considerable throughout the year. This paper hence reports the results from an experimental study that focuses on a Portuguese sample of young adults to evaluate poten-tial discrepancies between the PMV model equation and the thermal sensation assessment. The results show that the
correlation between PMV equation and thermal sensation presents a higher determination coefficient in spring-summer experiments (r = 0.871) than in the autumn-winter experiments (r = 0.667). This calls for an improvement of the PMV model specifically for this season, considering geographical and climatic differences.
The results of linear regression enable the computation of a correction factor for PMV in two similarly meaningful for-mulations: one considering thermal sensation as a function of PMV, operative temperature, and the season (whether cold or warm), and the other considering four variables to model the thermal sensation, namely, PMV, operative temperature, outside temperature, and outside relative humidity.
Analysis by gender shows a different set of correlations by season. Nevertheless, the results do not confirm any asso-ciation between the sex of the participants and the thermal sensation but provide evidence of the importance of outside weather in terms of the psychological adjustment in thermal sensation. The results are a further confirmation of the hypothesis of a season bias in thermal sensation. To the best of our knowledge, this has not been considered in earlier studies and should be developed further in other experimental studies for additional empirical evidence and validation.
This study concurs with previous research carried out throughout the world calling for a revision of the PMV equation, with adaptation to different geographical areas, according to climatic specificity. This contribution is hence a stepping stone toward gathering significant empirical evidence that is needed for reaching a consensus on the need to revise and expand the existing thermal comfort equation. Future studies might be beneficial to investigate further the factors that may explain the variant but statistically significant discrepancies between thermal sensation and calculated PMV, accord-ing to season, whether consideraccord-ing subjects from both genders, or separataccord-ing subjects accordaccord-ing to gender. Further work is necessary to expand this line of research, such as experiments carried out in different parts of the world and at differ-ent latitudes to ascertain the effect of the distance to the equator in the seasonal adjustmdiffer-ent of the quality of the thermal assessment prediction without considering a correction factor that takes season into consideration.
AC K N OW L E D G E M E N T
The authors acknowledge that support for performing this research was achieved from partial funding from Fundação para a Ciência e a Tecnologia through project UID/EMS/00151/2013 C-MAST.
O RC I D
Denis A. Coelho https://orcid.org/0000-0001-9759-9133 Pedro D. Silva https://orcid.org/0000-0003-2204-3397
R E F E R E N C E S
1. International Organization for Standardization (ISO). Standard 7730: ergonomics of the thermal environment- analytical determina-tion and interpretadetermina-tion of thermal comfort using calculadetermina-tion of the PMV and PPD indices and local thermal comfort criteria. Geneva, Switzerland: ISO; 2005.
2. Parsons K. Human Thermal Environments: The Effects of Hot, Moderate and Cold Environments on Human Health, Comfort and
Performance. London, UK: Taylor & Francis; 2003.
3. Coelho DA, Tavares CS, Lourenço ML, Lima TM. Working conditions under multiple exposures: a cross-sectional study of private sector administrative workers. Work. 2015;51:781-789.
4. Broday EE, de Paula Xavier AA, de Oliveira R. Comparative analysis of methods for determining the clothing surface temperature (tcl) in order to provide a balance between man and the environment. Int J Ind Ergon. 2017;57:80-87.
5. Cardoso V, Ramos N, Almeida R, et al. Thermal comfort evaluation in cruise terminals. Build Environ. 2017;126:276-287.
6. Maykot JK, Rupp RF, Ghisi E. A field study about gender and thermal comfort temperatures in office buildings. Energ Build. 2018;178:254-264.
7. Rupp RF, Dear R, Ghisi E. Field study of mixed-mode office buildings in southern Brazil using an adaptive thermal comfort framework.
Energ Build. 2018;158:1475-1486.
8. Rupp RF, Ghisi E. Predicting thermal comfort in office buildings in a Brazilian temperate and humid climate. Energ Build. 2017;144:152-166.
9. Alfano FRD, Palella BI, Riccio G, Toftum J. Fifty years of Fanger's equation: is there anything to discover yet? Int J Ind Ergon. 2018;66:157-160.
10. Van-Hoof J. Forty years of Fanger's model of thermal comfort: comfort for all. Indoor Air. 2008;18:182-201. 11. McIntyre DA. Evaluation of thermal discomfort. In: Proceedings of the Indoor Air'84; 1984; Stockholm, Sweden.
12. Fanger PO. Calculation of thermal comfort: introduction of a basic comfort equation. ASHRAE Transactions. 1967;73:III4.1-III4.20. 13. Fanger PO. Thermal Comfort: Analysis and Applications in Environmental Engineering. New York, NY: McGraw-Hill; 1972.
14. Broday EE, Moreto JA, de Paula Xavier AA, de Oliveira R. The approximation between thermal sensation votes (TSV) and predicted mean vote (PMV): a comparative analysis. Int J Ind Ergon. 2019;69:1-8.
15. Chen X, Wang Q, Srebric J. Model predictive control for indoor thermal comfort and energy optimization using occupant feedback.
Energ Build. 2015;102:357-369.
16. Cheung T, Schiavon S, Parkinson T, Li P, Brager G. Analysis of the accuracy on PMV – PPD model using the ASHRAE global thermal comfort database II. Build Environ. 2019;153:205-217.
17. Del Ferraro S, Iavicoli S, Russo S, Molinaro V. A field study on thermal comfort in an Italian hospital considering differences in gender and age. Applied Ergonomics. 2015;50:177-184.
18. Yang Y, Li B, Liu H, Tan M, Yao R. A study of adaptive thermal comfort in a well-controlled climate chamber. Appl Therm Eng. 2015;76:283-291.
19. Becker S, Potchter O, Yaakov Y. Calculated and observed human thermal sensation in an extremely hot and dry climate. Energ Build. 2003;35:747-756.
20. Amai H, Tanabe S, Akimoto T, Genma T. Thermal sensation and comfort with different task conditioning systems. Build Environ. 2007;42:3955-3964.
21. Chun C, Kwok A, Mitamura T, Miwa N, Tamura A. Thermal diary: connecting temperature history to indoor comfort. Build Environ. 2008;43:877-885.
22. Hughes C, Natarajan S. Summer thermal comfort and overheating in the elderly. Build Serv Eng Res Technol. 2019;40(4):426-445. 23. Piasecki M, Fedorczak-Cisak M, Furtak M, Biskupski J. Experimental confirmation of the reliability of Fanger's thermal comfort
model—case study of a near-zero energy building (NZEB) office building. Sustainability. 2019;11(9):2461.
24. Wu Z, Li N, Wargocki P, Peng J, Li J, Cui H. Field study on thermal comfort and energy saving potential in 11 split air-conditioned office buildings in Changsha, China. Energy. 2019;182:471-482.
25. Antoniadou P, Papadopoulos AM. Occupants' thermal comfort: state of the art and the prospects of personalized assessment in office buildings. Energ Build. 2017;153:136-149.
26. Maiti R. PMV model is insufficient to capture subjective thermal response from Indians. Int J Ind Ergon. 2014;44:349-361.
27. Manu S, Shukla Y, Rawal R, Thomas LE, de Dear R. Field studies of thermal comfort across multiple climate zones for the subcontinent: India model for adaptive comfort (IMAC). Build Environ. 2016;98:55-70.
28. Morgado M, Talaia M, Teixeira L. A new simplified model for evaluating thermal environment and thermal sensation: an approach to avoid occupational disorders. Int J Ind Ergon. 2017;60:3-13.
29. Rupp RF, Vásquez NG, Lamberts R. A review of human thermal comfort in the built environment. Energ Build. 2015;105:178-205. 30. Maykot J, Rupp R, Ghisi E. Assessment of gender on requirements for thermal comfort in office buildings located in the Brazilian humid
subtropical climate. Energ Build. 2018;158:1170-1183.
31. Pires L, Silva PD, Castro-Gomes JP. Experimental study of an innovative element for passive cooling of buildings. Sustain Energy Technol
Assess. 2013;4:29-35.
32. International Organization for Standardization (ISO). Standard 7243: hot environments – estimation of the heat stress on working man, based on the WBGT-index (wet bulb globe temperature). 3rd ed. Geneva, Switzerland: ISO; 2017.
33. International Organization for Standardization (ISO). Standard 7726: ergonomics of the thermal environment – instruments for measuring physical quantities. Geneva, Switzerland: ISO; 1998.
34. Nilsson H. PMV calculator v.2, English language MS Excel macro enriched file. Gävle, Sweden: Department of Technology and Built Environment, Laboratory of Ventilation and Air Quality, University of Gävle; 2005.
35. Fanger PO. Thermal Comfort. Copenhagen, Denmark: Danish Technical Press; 1970.
36. ASHRAE. Standard 55–2004, thermal environmental conditions for human occupancy. Atlanta, GA: American Society of Heating, Refrigerating and Air-Conditioning Engineers (ASHRAE); 2004.
37. de Dear RJ, Brager GS. Thermal comfort in naturally ventilated buildings: revisions to ASHRAE standard 55. Energ Build. 2002;34(6):549-561.
38. Almeida RMSF, Ramos NMM, de Freitas VP. Thermal comfort models and pupils' perception in free-running school buildings of a mild climate country. Energ Build. 2016;111:64-75.
39. Beizaee A, Firth SK. A comparison of calculated and subjective thermal comfort sensation in home and office environment. In: Proceedings of People and Buildings (MC2011); 2011; London, UK.
40. Pourshaghaghy A, Omidvari M. Examination of thermal comfort in a hospital using PMV – PPD model. Applied Ergonomics. 2012;43:1089-1095.
41. Alfano FRA, Ianniello E, Palella BI. PMV–PPD and acceptability in naturally ventilated schools. Build Environ. 2003;67:129-137. 42. Gilani SIH, Khan MH, Pao W. Thermal comfort analysis of PMV model prediction in air conditioned and naturally ventilated buildings.
Energ Procedia. 2015;75:1373-1379.
43. Pereira LD, Raimondo D, Corgnati SP, da Silva MG. Assessment of indoor air quality and thermal comfort in Portuguese secondary classrooms: methodology and results. Build Environ. 2014;81:69-80.
44. Liu H, Wu Y, Li B, Cheng Y, Yao R. Seasonal variation of thermal sensations in residential buildings in the hot summer and cold winter zone of China. Energ Build. 2017;140:9-18.
45. Nico MA, Liuzzi S, Stefanizzi P. Evaluation of thermal comfort in university classrooms through objective approach and subjective preference analysis. Applied Ergonomics. 2015;48:111-120.
46. Chaudhuri T, Soh YC, Li H, Xie L. Machine learning based prediction of thermal comfort in buildings of equatorial Singapore. In: Proceedings of 2017 IEEE International Conference on Smart Grid and Smart Cities (ICSGSC); 2017; Singapore.
47. Karjalainen S. Thermal comfort and gender: a literature review. Indoor Air. 2012;22:96-109.
How to cite this article: Coelho DA, Silva PD. Season influence on rapid thermal sensation assessment by young


![FIGURE 9 Isocurves for PMV as a function of operative temperature [ ◦ C], for a given thermal sensation (TS) constant and for a given season, springing from the results of regression analysis of thermal sensation on predicted mean vote (PMV), operative tem](https://thumb-eu.123doks.com/thumbv2/123dok_br/18940325.939544/10.892.464.823.71.358/isocurves-operative-temperature-sensation-springing-regression-sensation-predicted.webp)

