http://www.uem.br/acta ISSN printed: 1679-9275 ISSN on-line: 1807-8621
Doi: 10.4025/actasciagron.v38i2.26551
Phosphorus uptake and use efficiency of different cotton cultivars in
savannah soil (Acrisol)
Nericlenes Chaves Marcante1*, Takashi Muroaka1, Isabeli Pereira Bruno2 and Marcos Antonio Camacho3
1
Universidade de São Paulo, Avenida Centenário, 303, 13400-970, Piracicaba, São Paulo, Brazil. 2Instituto de Agronomia do Paraná, Londrina,
Paraná, Brazil. 3Universidade Estadual do Mato Grosso do Sul, Aquidauana, Mato Grosso do Sul, Brazil. *Author for correspondence.
E-mail: marcante1987@gmail.com
ABSTRACT. Low soil phosphorus (P) is a limiting factor for plant growth in the Brazilian savannah, where P diffuses slowly and has a high fixation rate in soil (as Al-P and Fe-P). In this study, we investigated the variation in P uptake by different cotton cultivars grown in savannah soil. We conducted a greenhouse experiment using a fully factorial 2 x 17 randomized design with two P treatments (low P = 20 mg kg-1 and
high P = 120 mg kg-1) and 17 cotton cultivars. The plants were potted in Acrisol soil labeled with
radioisotope 32P. There was genetic variation in the P use efficiency among the cotton cultivars. The
P treatments significantly influenced the dry weight of shoots (DWS), P accumulation, the specific activity of 32P, and the L-value (both the standardized and L-values discounted the P present in the cottonseed).
Hierarchical clustering analysis classified the cotton cultivars into distinct, internally homogeneous clusters. Our results suggest that cotton cultivars could be selected to maximize P absorption efficiency in conditions of low plant-available P. The cultivars FMT 523, FM 910 and CNPA GO 2043 were the most responsive to P fertilization, while Barbadense 01, FM 966LL, IPR Jataí, BRS Aroeira and BRS Buriti were most efficient at absorbing plant-available P.
Keywords:32P activity, G. barbadense, G. hirsutum, Brazilian Cerrado.
Eficiência de absorção e utilização de fósforo por cultivares de algodão em um solo de
Cerrado (Latossolo Vermelho Amarelo)
RESUMO. A baixa disponibilidade de fósforo (P) é um fator limitante para o crescimento de plantas no Cerrado Brasileiro, onde a difusão do P é baixa e o solo tem grande capacidade de fixação do P por óxidos de ferro e alumínio. Nesse estudo foi investigado a variação da absorção de P por diferentes cultivares de algodão cultivados em solo proveniente da região do Cerrado. Foi conduzido um experimento de casa de vegetação em delineamento inteiramente casualizado em esquema fatorial 2 x 17, dois tratamento com P (baixo P = 20 mg kg-1 e alto P = 120 mg kg-1) e 17 cultivares de algodão. As plantas foram cultivadas em
vasos com um solo marcado com o radioisótopo 32P. Houve variação genética para eficiência uso de P entre
cultivares de algodão. O tratamentos com P influenciaram significativamente a matéria seca da parte aérea, acúmulo de P, atividade específica do 32P, valor L e valor L descontando o P proveniente das sementes. A
análise multivariada classificou os cultivares de algodão em grupos distintos e homogêneos internamente. Os resultados desse trabalho sugerem que pode-se selecionar cultivares de algodão mais eficientes em absorver e utilizar P em solos com baixa disponibilidade de P para as plantas. Os cultivares FMT 523, FM 910 e CNPA GO 2043 foram os mais responsivos a adubação fosfatada, enquanto que os cultivares Barbadense 01, FM 966LL, IPR Jataí, BRS Aroeira e BRS Buriti foram os mais eficientes na utilização de P.
Palavras-chave: atividade do radioisótopo 32P, G. barbadense, G. hirsutum, Cerrado.
Introduction
Phosphorus (P) availability is a major constraint on plant growth in many terrestrial ecosystems, especially in the tropics and subtropics (Vance, Uhde-Stone, & Allan, 2003). Limited P availability inhibits the growth of many crops, such as soybean (Glycine max L.), corn (Zea mays L.), wheat (Triticum
spp. L.), bean (Phaseolus vulgaris L.), rice (Oryza saliva
L.) and cotton (Gossypium hirsutum L.). Low P
that developing cultivars that have a greater capacity to grow in soils with low P availability could offer an alternative to P fertilizers (Zhang et al., 2012).
Research on phosphorus efficiency has been conducted in a variety of crop species, including soybean (Wang, Guppy, Watson, Sale, & Tang, 2011), corn (Fageria & Baligar, 1997), common bean (Liao et al., 2004), rice (Fageria, Baeta, & Alexandre, 2011), and wheat (Ma et al., 2011). However, very little is known about cotton P use efficiency. P efficiency studies require two levels of P availability to identify efficient and inefficient cultivars (Fageria & Baligar, 1997; Ahmad, Hans-peter, Johann, Josef, & Walter, 2014). Although previous research has found a strong correlation between cotton P uptake and the proportion of P bonded to iron and aluminum oxides (Dohary, Rochester, & Blair, 2004; Wang, Tang, Guppy, & Sale, 2008) as well as a weak correlation between cotton P uptake and P fertilization in alkaline soils (Bronson et al., 2001), further work is needed to better understand and evaluate the P use efficiency of cotton plants.
Cotton is primarily cultivated in China, India, USA, Pakistan and Brazil, but it is a crucial global resource for textile manufacturing, accounting for 50% of all fiber used in this industry. In Brazil, cotton fiber production is concentrated in large savannah habitats (Cerrado), which commonly have acidic soils with low P availability. P deficiency in cotton crops causes slow shoot development, dark green leaves, flower bud necrosis, and the yellowing of older leaves. Low P availability may also directly affect flower bud development, and decrease the absorption of N and Mg, as a result of inhibited cell growth (Dohary et al., 2004). The development of P-efficient cotton cultivars coupled with good management practices could result in a decrease in the use of phosphate fertilizer, thereby improving the sustainability of cotton production.
Several legume species are able to access sparingly available P. Among these, white lupin (Lupinus albus L.) is considered to be the standard P-efficient plant. White lupin has some traits that have made it ideal for growth in soils where P availability is low, such as the formation of cluster roots, and the exudation of citrate and malate (phosphate mobilizing substances) (Dissanayaka, Maruyama, Masuda, & Wasaki, 2015). These traits may partially account for the use of white lupin as a control, when evaluating the P efficiency of other crops in soil with low available phosphorus (Hocking, Keerthisinghe, Smith, & Randall, 1991; Lambers, Clements, & Nelson, 2013).
In the present study, a set of 15 herbaceous and 2 wild cotton cultivars was used to evaluate the extent
of genetic variability in P use efficiency and provide insight into the selection and breeding of cultivars with enhanced P use efficiency.
Material and methods
Plant materials
Fifteen herbaceous cotton cultivars (Gossypium
hirsutum L.), two wild cotton cultivars (Gossypium barbadense L.) and one white lupin cultivar (Lupinus albus L.) were grown in pots in a greenhouse experiment. We used white lupin as a control to evaluate the P efficiency of the cotton cultivars. The 15 agricultural cotton were: BRS – Aroeira; BRS – Buriti; CNPA – GO 2043; IPR – Jataí; IPR – 05-513; IPR – 140; FMT – 523; FMT – 701; FM – 910;
FM – 966LL; FB – 0403; IAC – 25; NuOpal®; Sicala
– 40; and the 2 wild cottons were: Barbadense – 01 and Barbadense – 02.
Soil properties
The topsoil (0 to 20 cm) was collected from a typical savannah biome in the city of Aquidauana, Mato Grosso do Sul State, Brazil - (20º 28' S and 55º 40' W). The soil meets the classification requirements of Acrisol, according to the World Reference Base for Soil Resources, or Argissolo Vermelho-Amarelo Litólico, according the Brazilian Soil Classification System (Empresa Brasileira de Pesquisa Agropecuária [Embrapa], 2013). This soil type was selected because it best represents the weathered soils of the savannah biome (Cerrado), where there are subsurface soil layers that contain clay particles and abundant hydrous oxides of aluminum and iron.
The collected soil was air-dried, sieved with a 2 mm mesh, and homogenized. The physical (Camargo, Moniz, Jorge, & Valadares, 1986) and chemical (Raij, Andrade, Cantarella, & Quaggio, 2001) characteristics of the soil were as follows: clay,
silt, and sand content was 225, 62, and 713 g kg-1,
respectively; the pH (CaCl2) was 4.2; resin
extractable P was 3.0 mg dm-3; organic matter was
11.0 g kg-1; S was 5.0 mg kg-1; and K, Ca, Mg and
H+Al were 2.7, 15.0, 10.0 and 34.0 mmolc kg-1,
respectively. The soil base saturation was raised to 70% by applying lime with 95% relative total power of neutralization (27.50% CaO and 18.5% MgO).
Labelling soil with 32P
The P availability was assessed with an isotopic-dilution technique based on the specific activity (Sa)
of 32P (DMP μg P-1) and the L-value method
(Larsen, 1952). The air-dried soil (3 kg per pot) was
radioisotope 32P solution (6.9 KBq pot-1), free of
P-charger, to each pot. After the solution was applied, the soil was incubated for 15 days until isotopic
equilibrium between the 32P and 31P was reached.
Experimental design
This experiment had a fully factorial, randomized design (17 cultivars x 2 P treatments X 4 replications). The two P treatments were the
following: (1) low P (20 mg kg-1) and (2) high P
(120 mg kg-1). The phosphorus source was triple
superphosphate, which was readily available to plants.
Growth conditions
The experiment was conducted in a greenhouse, with maximum and minimum temperatures of 35 and 22ºC, respectively. Plants were grown in plastic pots containing 3 kg of sieved soil; five seeds were sown per pot. At the seedling stage, N and K were
applied (100 mg kg-1 of N as ammonium sulfate,
(NH4)2SO4, and 200 mg kg-1 K as potassium sulfate,
K2SO4). Micronutrients were also applied in
nutrient solutions (0.5 mg kg-1 B as boric acid,
1.5 mg kg-1 Cu as copper sulfate, 1.5 mg kg-1 Zn as
zinc sulfate, and 0.1 mg kg-1 Mo as ammonium
molybdate). At 7days post-emergence, plants were
thinned to two plants per pot. Then, at 15 days
post-emergence, 100 mg kg1 of N as ammonium sulfate
was applied. The plants were irrigated and the soil moisture was monitored and maintained at approximately 70% of the maximum water retention.
Harvest and analysis of plant material
At 40 days post-emergence, shoots were harvested, washed, dried at 70ºC for 72h, and weighed to determine the dry weight of shoots (DWS). Dried shoots were subsequently milled and sieved through a 0.30 mm screen. Sub-samples of the ground tissue (500 mg) were used to determined P concentration in shoots ([P]) via nitric-perchloric acid digestion. The nutrient content of the tissue was determined with the metavanadate colorimetric method, as described by Malavolta, Vitti and
Oliveira (1996). The Activity of 32P in the extract of
nitric-perchloric acid digestion was determined using a liquid scintillation counter (Vose, 1980).
The data were used to calculate the specific 32P
activity (Sa) of each plant (DPM μg P-1), according
equation 1:
Sa= ℎ
ℎ (1)
Isotopically exchangeable P values (L-values) were calculated from the following equation 2:
− =Sa applied
Sa shoots − 1 (2)
Phosphorus uptake (PU) mg pot-1 was calculated
as equation 3:
= [P] (3)
Before beginning the greenhouse experiment, 10 seeds of each cotton cultivar and white lupin were analyzed for P content. The P content in the seeds was subtracted from the total content of P in plants, to standardize the measurement of P uptake from
the soil (Lseed value mg kg-1), according equation 4.
Lseed =Y[XT – Z]YT − X (4)
where:
Lseed is the L-value, discounting the P from the
seed (P mg kg-1); Y is the 32P activity in the solution
applied per pot (DPM); XT is the total P activity in
the plant (mg); YT is the 32P activity in the plant
(DPM); Z is the total P from the seed (mg); and X is
the dose of 31P charger applied per pot (mg).
Data analysis
The data were analyzed using analysis of variance (ANOVA), Pearson correlation, and hierarchical
clustering in SAS®, ‘Statistical Analysis System’.
Comparisons were made between the means (T-student) of the yield, DWS, [P], PU, Sa, L-value, Lseed, and the value for both levels of P.
The hierarchical cluster analysis was used to verify similarities among the cotton cultivars in
DWS, [P], PU, Sa, L-value and Lseed; all variables
Results and discussion
The white lupin data are presented separately from those of the cotton cultivars, as the white lupin data would affect the analysis of variance and hierarchical cluster analysis, and would thus prevent the classification of cotton cultivars into distinct, internally homogeneous clusters. The mean values
for DWS, [P] and PU, Sa, L-value and Lseed in the
high and low P levels for white lupin are presented in Table 1. The mean values for DWS, [P] in the high and low P levels for cotton cultivars are presented in Table 2.
Table 1. Mean values of DWS, [P], PU, Sa, L, Lseed of white
lupin cultivated in high P (120 mg kg-1
) and low P (20 mg kg-1
) conditions.
120 mg kg-1
DWSa [P]b PUc Sad Le L
seed f
White Lupine g g kg
-1
mg pot-1
DPM μg P-1
mg kg-1
soil
1.1 5.8 3.8 3.7 1236.2 967.1
20 mg kg-1
White Lupine 1.3 3.8 3.4 1.1 3298.0 1627.0
aDWS represent dry weight of shoots; b[P] represent concentration of phosphorus; cPU represent phosphorus uptake; dSa represent specific activity; eL represent L-value; fL
seed represent L-value discounting the P in the plant from the seed.
Table 2. Mean values of DWS, [P] and PU of cotton cultivated in high P (120 mg kg-1
) and low P (20 mg kg-1
) conditions.
Cultivar 120 mg kg-1 20 mg kg-1
DWSa [P]b PUc DWSa [P]b PUc
g g kg-1 mg pot-1 g g kg-1 mg pot-1
CNPA GO 2043 14.2 a 5.0 ab 72.7 a 9.8 a 3.7 cb 36.3 a BRS Aroeira 13.0 a 4.7 a-c 59.0 ab 10.4 a 3.3 bc 36.0 a IAPAR 40 12.9 a 4.3 b-d 54.7 bc 9.5 ab 3.7 cb 35.0 ab FM 993 10.6 b 3.6 d 38.3 de 6.6 c-e 4.0 ab 26.0 c-f FM 910 10.5 b 4.7 a-d 47.0 b-d 6.8 c-e 4.8 a 32.3 a-e IAC 25 10.5 b 4.2 b-d 43.7 c-e 8.0 bc 4.3 ab 34.0 a-c FM 966 LL 10.0 b 4.0 cd 36.7 de 6.1 e 4.3 ab 25.3 d-f BRS Buriti 10.0 b 4.3 b-d 41.0 c-e 6.9 c-e 3.7 bc 24.3 ef IPR 05-513 10.0 bc 3.7 cd 39.0 de 6.9 c-e 3.7 bc 24.7 ef IPR Jataí 9.9 bc 4.3 b-d 41.7 c-e 6.0 e 5.0 a 28.3 a-f Barbadense 1 9.6 bc 4.7 a-d 41.3 c-e 8.9 b-d 3.0 bc 28.7 d-f FMT 523 9.5 bc 4.7 a 48.7 bc 6.3 d-e 4.0 bc 23.7 f FMT 701 8.9 bc 4.0 b-d 39.3 de 7.0 c-e 3.7 bc 26.0 c-f Barbadense 2 8.8 bc 4.7 ab 42.3 c-e 7.3 c-e 3.3 c 23.0 f Sicala 40 8.5 bc 5.0 ab 42.7 c-e 7.0 c-e 5.0 ab 33.0 a-d FB 0403 8.3 cd 5.0 ab 41.7 c-e 6.4 c-e 4.3 ab 27.3 b-f NuOpal 7.1 d 4.7 a-d 32.0 e 6.9 c-e 4.3 ab 29.0 a-f
Mean 10.1 4.5 45.0 7.4 4.0 30.0
F 6.4** 2.4* 3.6** 4.8*** 2.0* 2.6**
LSD 2.1 0.9 14.6 1.7 0.9 8.2
CV (%) 12 15 19 12 15 17
aDWS represent dry weight of shoots; b[P] represent concentration of phosphorus; c PU represent phosphorus uptake; *, **, ***Significant levels of probability of 5, 1 and
0.1%, respectively, from T-test.
Significant variation was observed for [P] and PU within the cotton cultivars and white lupin (Tables 1 and 2) both two P levels. The DWS of all cotton cultivars in the low P treatment was significantly reduced (> 50%) because of the low plant-available P in the Acrisol (Table 2). However, there was no influence of low P availability on the DWS of white lupin (Table 1). Low P conditions resulted in a small reduction in the [P] of cotton
cultivars (Table 2), but for white lupin the reduction was significant (35%) (Table 1). The cotton cultivars differed significantly in PU between high and low P treatments (Table 2), while no difference was observed between treatments in white lupin
(Table 1). In white lupin, the L-value and Lseed
varied considerably between high and low P treatments (Table 1).
The correlation coefficients (correlation matrix)
between DWS, [P], PU, Sa, L-value, and Lseed in the
two P treatments are shown in Table 3. In addition to the significance of the correlations (Table 3), we also considered their practical importance when drawing the dendrograms. Therefore, the results were presented in two dendrograms: the first based on the DWS, [P], and PU; and the second based on
the Sa, L-value and Lseed for both P treatments. The
correlation between the DWS and the PU was
0.86*** and 0.73*** in the high P and low P
treatments, respectively, and the correlation between
the Sa and the L-value was -0.73*** and 0.90*** in the
high P and low P treatments, respectively (Table 3).
Table 3. Correlation coefficients between the DWS, [P], PU, Sa, L and Lseed of cotton cultivars grown in high P (120 mg kg-1) and
low P (20 mg kg-1
) conditions.
120 mg kg-1
[P]b PUc Sad L-valuee Lseed f
g kg-1 mg pot-1DMP μg P-1 mg kg-1 soil mg kg-1 soil
DWSa
g pot-1
-0.009ns
0.86***
0.08ns
-0.08ns
-0.28ns
[P]b g kg-1 0.47ns 0.054ns 0.29ns 0.34ns
PUc mg pot-1 0.18ns 0.10ns -0.06ns
Sad
DMP μg P-1
-0.73***
-0.79***
L-valueemg kg-1 solo 0.76***
20 mg kg-1
DWSa g pot-1 -0.49* 0.73*** 0.67*** -0.50* -0.46ns
[P]b
g kg-1
0.24ns
-0.56ns
0.35ns
0.25ns
PUc mg pot-1 0.28ns -0.24ns -0.28ns
Sad
DMP μg P-1
-0.90***
-0.85***
L-valueemg kg-1 soil 0.95***
aDWS represent dry weight of shoots; b[P] represent concentration of phosphorus; cPU represent phosphorus uptake; dSa represent specific activity; eL-value represent L
value; fL
seed represent L value discounting the P in the plant from the seed; ns, *, *** not
significant, significant at probability 0.1 and 5%, respectively.
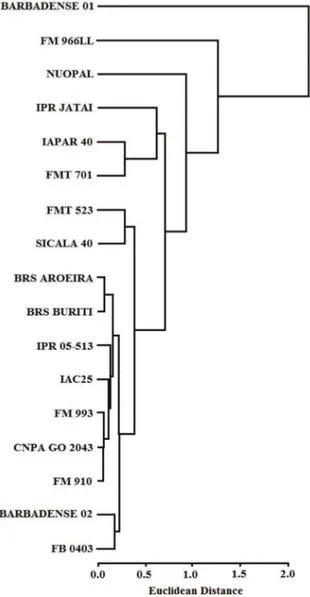
Figure 1. Dendrogram resulting from the hierarchical cluster analysis of cotton cultivars based on the dry weight of shoots (DWS), concentration of phosphorus ([P]) and the phosphorus uptake (PU) in high P (120 mg kg-1
) conditions.
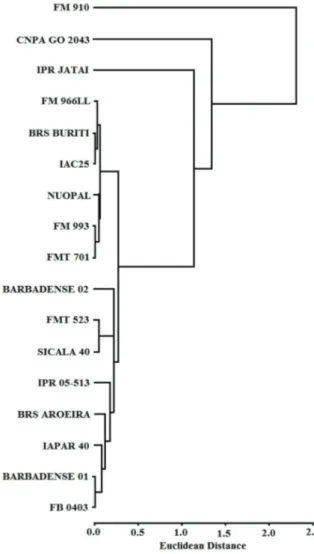
Under low P conditions, the DWS was
correlated with [P] (-0.49*) and PU (0.73***)
(Table 3). Hierarchical cluster analysis divided the cotton cultivars into three clusters, according to their efficient absorption of low plant-available P, as measured by their DWS, [P], and PU (the cutoff was 1.5 Euclidean distance): (1) highly efficient (high DWS, [P] and PU); (2) efficient (high DWS, moderate [P] and PU), and (3) low efficiency (low DWS, [P] and PU). These clusters comprised the following cotton cultivars (Figure 2): (1) Barbadense 01; (2) FM 966LL and (3) NuOpal, IPR Jataí, IAPAR 40, FMT 701, FMT 523, Sicala 40, BRS Aroeira, BRS Buriti, IPR 05-513, IAC 25, FM 993, CNPA GO 2043, FM 910, Barbadense 02, and FB 0403.
Table 4 shows the mean values of the Sa, L-value
and Lseed of cotton cultivars in both P treatments.
There were no significant differences in Sa values
among cotton cultivars grown in the high P treatment. Conversely, cotton cultivars grown in the low P treatment had a significant decrease in Sa and
increase in the L-value and Lseed (p > 0.01%) (Table 4).
Figure 2. Dendrogram resulting from the hierarchical cluster analysis of cotton cultivars based on the dry weight of shoots (DWS), concentration of phosphorus ([P]) and phosphorus uptake (PU) in low P (20 mg kg-1) conditions.
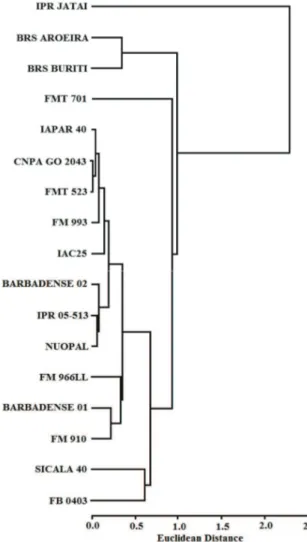
In high P conditions, the cotton cultivar Sa values were strongly correlated with the L-values
and Lseed, - 0.73*** and - 0.79***, respectively, and the
L-values were strongly correlated with Lseed value
(0.76***) (Table 3). Hierarchical analysis divided the
cotton cultivars into four clusters (Figure 3), according to their P absorption efficiency: (1) highly
efficient (low Sa, high L-value and Lseed);
(2) efficient (low Sa, moderate to high L-value and
Lseed); (3) moderately efficient (low Sa, moderate
L and Lseed values). These groups were comprised by
the following cotton cultivars (the cutoff was 1 Euclidean distance): (1) FM 910; (2) CNPA GO 2043; (3) IPR Jataí; and (4) FM 966LL, BRS Buriti, IAC 25, Nuopal, FM 993, FMT 701, Barbadense 02, FMT 523, Sicala 40, IPR 05-513, BRS Aroeira, IAPAR 40, Barbadense 01, and FB 0403.
Table 4. Mean values of Sa, L and Lseed of cotton cultivars grown
in the high P (120 mg kg-1) and low P (20 mg kg-1) conditions.
Cultivar 120 mg kg-1 20 mg kg-1
Saa
Lb
Lseed c
Saa
L-valueb
Lseed c
DPM μg P-1
mg kg-1
soil mg kg-1
soil
DPM μg P-1
mg kg-1
soil mg kg-1
soil FM 966LL 8.9 342.2 170.6 4.0 hi 414.3 c-e 257.1 bc BRS Buriti 8.5 340.1 169.7 7.5 c-f 347.4 ef 173.5 b-e FMT 701 8.3 327.8 163.6 2.8 i 776.8 a 495.5 a BRS Aroeira 7.7 340.4 170.0 10.9 ab 236.4 fg 118.0 e Barbadense
01 7.6 344.7 164.2 10.7 a-d 240.4 fg 97.4 e
IAPAR 40 7.4 350.0 174.7 10.0 a-c 265.1 fg 132.2 c-e IPR 05-513 7.3 353.3 176.4 9.0 b-e 291.0 e-g 144.9 b-e IAC 25 7.1 401.3 200.3 6.7 e-g 408 c-e 203.5 b-e NuOpal 6.8 401.4 267.2 8.7 b-e 301.9 e-g 150.5 b-e Barbadense
02 6.8 275.5 134.1 12.0 a 219.5 g 109.4 e
FMT 523 6.6 414.9 221.9 5.3 f-i 506.5 b-d 252.3 b-d FM 993 6.4 423.7 211.6 8.3 b-e 322.9 e-g 160.9 b-e FB 0403 6.0 438.7 303.3 4.2 hi 532.9 bc 265.9 b CNPA GO 5.9 433.6 216.5 11.0 ab 243.3 fg 121.5 ed FM 910 5.4 367.9 319.0 6.9 d-g 331.9 e-g 197.0 b-e IPR Jataí 5.2 417.9 268.2 6.4 e-g 402.2 de 200.5 b-e Sicala 40 4.4 516.3 306.7 4.8 g-i 547.0 b 222.7 b-e
Mean 6.8 381.7 235.5 8.5 375.7 194.3
F O.7ns 1.3ns 1.2ns 8.5*** 11.1*** 4.2**
LSD 4.1 145.0 140.1 2.7 126.0 131.1
CV (%) 17.8 14.9 36.9 33.8 39.1 48.4
aSa represent specific activity; bL represent L value; cL
seed represent L value discounting
the P in the plant from the seed; ns, *, **, ***not significant, significant at probability 0.1,
1.0 and 5%, respectively, from T-test.
For cotton cultivars in the low P treatment, Sa was
strongly correlated with the L and Lseed values, - 0.90***
and - 0.85***, respectively, and the L-value was
correlated with Lseed value (0.95***) (Table 3).
Hierarchical cluster analysis divided the cotton cultivars into five clusters (Figure 4), according to their P absorption efficiency in low P conditions:
(1) highly efficient (low Sa, high L-value and Lseed), (2)
very efficient (low Sa, high L-value and moderate Lseed),
(3) moderately efficient (low to moderate Sa, high to
moderate L-value and Lseed), (4) poor efficiency
(moderate Sa, L-value and Lseed), and (5) low efficiency
(high Sa, low L and Lseed values). These clusters were
comprised by the following cotton cultivars (the cutoff was 1 Euclidean distance): (1) IPR Jataí; (2) BRS Aroeira and BRS Buriti; (3) FMT 701; and (4) IAPAR 40, CNPA GO 2043, FMT 523, FM 993, IAC 25, Barbadense 02, IPR 05-513, Nuopal, FM 966LL, Barbadense 01 and FM 910; (5) Sicala 40, and FB 0403.
The P uptake efficiency can be determined from
the Sa of 32P present in the plant, i.e. the lower the
Sa, the higher the P absorption efficiency of cultivar,
and the higher the Sa is, the lower the P absorption efficiency. If all cotton cultivars and white lupin had identical P uptake efficiencies, they would have the
same Sa, and an equal DPM μg-1 of P (Larsen, 1952;
Hocking et al., 1991). However, white lupin had a lower Sa, indicating it was able to access P in the soil that was less available to the other plants. White lupin most likely increased its access to otherwise unavailable soil P by excreting organic acid (citrate) or extruding protons, thereby acidifying the rhizhosphere, and allowing it to solubilize P-Al and P-Fe.
Figure 3. Dendrogram resulting from hierarchical cluster analysis of cotton cultivars based on specific activity (Sa), L-value (L) and L-value discounting the P present in the cottonseed (Lseed) in high P (120 mg kg-1) conditions.
Despite differences in the concentration and accumulation of P between white lupin and cotton
cultivars, their Sa of 32P in DWS can nonetheless be
Figure 4. Dendrogram resulting from hierarchical cluster analysis of cotton cultivars based on specific activity (Sa), L-value (L) and L-value discounting the P present in the cottonseed (Lseed) in low P (20 mg kg-1) conditions.
In this study, white lupin had a lower Sa in both high and low P treatments, indicating the greater ability of this species to take up P compared to the cotton cultivars (Shane, Lambers, Cawthray, Kuhn & Schurr, 2008). Hocking, Keerthisinghe, Smith and Randall (1991) showed that compared to a variety of crop species, white lupin is able to access up to six times more P from low P soils. White lupin has been reported to emit organic compounds into the rhizosphere (such as citrate), which could increase P solubility and availability, and result in increased P absorption (Richardson, Hocking, Simpson & George, 2009; Fageria & Moreira, 2011). Additionally, this species has been shown to develop cluster roots as an adaptation for nutrient acquisition in nutrient-poor soils. Under low P conditions, cluster roots increase the root surface area, thereby releasing larger amounts of P-solubilizing compounds, as well as augmenting the efficiency of solubilized P recovery (Shane et al., 2008). The
anion citrate most likely solubilizes inorganic and organic soil P by several mechanisms, including anion exchange, chelation, and suppressing the reabsorption and precipitation of inorganic P (Hocking et al., 1991).
In a comparison of the P efficiency of corn hybrids using white lupin as a control crop, Fernandes and Muraoka (2002) reported that white lupin had a higher P efficiency than the corn hybrids tested. White lupin had a Sa that was 2.3 times lower than the most efficient hybrid. This supports the findings of the present study, where white lupin was more P efficient in both P treatments, with lower Sa and higher
L-values and Lseed than the cotton cultivars (Table 1). The
higher L-value and Lseed in white lupin under low P
conditions compared to high P conditions further supports its greater P efficiency, and indicates that this species was accessing a larger pool of available P than the cotton cultivars (Hocking et al., 1991). The L-value is an estimate of the total quantity of plant-available P in the soil and soil solution (Larsen, 1967). The resin extractable P soil test indicated that the soil would be
classified as P deficient (3.0 mg dm-3) for cropping, but
it appeared adequate for white lupin.
The results of this study indicate that there is substantial genetic variation for P efficiency in the 17 tested cotton cultivars. The cotton cultivars had significant differences in both growth under low P conditions and their response to P fertilization (high P conditions) (Table 2 and 4). Referring to Figure 1 and the average values shown in Table 2, the cultivars CNPA GO 2043 and FMT 523 were the most responsive to P fertilization, when cultivated in high P conditions. The DWS is considered a good indicator of maximum economic yield and, therefore, can be used as selection criteria in the evaluation of cultivars for nutritional efficiency (Fageria, Baligar, Moreira, & Portes, 2010). According to Wang, Tang, Guppy and Sale (2008), P
treatment (0 - 20 mg kg-1) significantly influenced
suitable for cultivation in areas where the concentration of P is limiting (Ahamad et al., 2001). A study comparing the P efficiency of two genotypes
of rapeseed (Brassica napus) in low P conditions
(5 μM), found that the more efficient genotype had
an 80.5% greater DWS than the less efficient genotype (Hu, Ye, Shi, Duan, & Xu, 2010). Furthermore, the authors observed that there was greater variation in DWS between the high and low P treatments in the less efficient genotype, confirming that efficient genotypes can be more tolerant to the stress caused by P deficiency.
The variation in PU between cotton cultivars is related to the morphological characteristics of the plants, which have a significant impact on their ability to cope with the stress caused by P deficiency. The exploitation of the soil through the proliferation and extension of a metabolically efficient root system can determine plant fitness in low P conditions (Baligar et al., 2001; Lynch & Ho, 2005). According to Wang et al. (2008) cotton plants grown in field conditions are not able to release organic acids through their roots, and so have not changed the rhizosphere chemistry to increase the immobilization of P. P uptake by cotton plants primarily depends on the extent of the roots in soil layers (Wang et al., 2011). The cotton cultivar CNPA GO 2043 had the greatest PU, but had a 51% reduction in accumulated P under low P conditions. The same trend was observed for most cultivars. It is possible that this reduction is linked to the stress caused by P deficiency, which reduces the rate of cell division in meristematic apex shoots (Akhtar, Oki, & Adachi, 2001), and limits plant growth (Table 2).
An efficient cultivar is one that has the ability to absorb relatively high amounts of soil nutrients, has high biomass production per unit of nutrient absorbed, and has low storage of nutrients in the straw (Fageria & Baeta, 2008). Plant P uptake efficiency may be affected by several factors, such as the formation of proteoid roots observed in P-efficient species (white lupin), the release of organic acids of low molecular weight from the root system, and the acidification of the rhizhosphere (Wang et al., 2008). In addition to biochemical adaptations, physiological changes in root architecture also increase the P acquisition efficiency of a root system (Raghothama & Karthikeyan, 2005; Clair & Lynch, 2010). Identifying cotton cultivars with a high nutrient absorption and utilization efficiencies could reduce the amount of P applied in fertilizer inputs, as well as allow cotton to be cultivated in regions with nutrient poor soils (Fageria & Baeta, 2008). In a study using the
radioisotopes 32P and 33P, Dohary, Rochester and
Blair (2004) found that over 95% of P present in cotton plants came from the soil and only 5% from the fertilizer applied. Thus, it is evident that P uptake by cotton plants in field conditions is based primarily on the extent of the roots in soil.
Conclusion
Cotton cultivars differ in their P absorption capacity. There is substantial genetic variation in P efficiency between 17 cotton cultivars and this could be exploited in breeding to produce new P-efficient, high-yielding cultivars for P-deficient acid soils. The cultivars FMT 523, FM 910, and CNPA GO 2043 were the most responsive to phosphate fertilizer in areas with a sufficient level of P. The cultivars Barbadense 01, FM 966LL, IPR Jataí, BRS Aroeira, and BRS Buriti were the most efficient in accumulating P when grown in low available P conditions.
References
Ahmad, M. M., Hans-Peter, K., Johann, V., Josef, E., & Walter, W. (2014). Developing phosphorus-efficient crop varieties - An interdisciplinary research framework. Field Crops Research, 162(1), 87-98.
Ahmad, Z., Gill, M. A., Qureshi, R. H., & Hamud-Ur-Rehman, M. T. (2001). Phosphorus nutrition of cotton cultivars under deficient and adequate levels in solution culture. Communications in Soil Science and Plant Analysis, 32(2), 171-187.
Akhtar, M. S., Oki, Y., & Adachi, T. (2001). Genetic variations of Brassica cultivars for P acquisition in a P stress environment and comparison of P sources for sustainable crop management. Communications in Soil Science and Plant Analysis, 40(20), 3023-3045.
Baligar, V. C., Fageria, N. K., & He, Z. L. (2001). Nutrient use efficiency in plants. Communications in Soil Science and Plant Analysis, 32(8), 921-950.
Bronson, K. F., Onken, A. B., Booker, J. D., Lascano, R. J., Provin, T. L., & Torbert, H. A. (2001). Irrigated cotton yields as affected by phosphorus fertilizer and landscape position. Communication in Soil Science and Plant Analysis, 32(12), 1959-1967.
Camargo, O. A., Moniz, A. C., Jorge, J. A., & Valadares, J. M. A. S. (1986). Métodos de análise química, mineralógica e física de solos do Instituto Agronômico de Campinas. Campinas, SP: Instituto Agronômico de Campinas. Clair, S. B., & Lynch, J. P. (2010). The opening of
Pandora’s Box: climate change impacts on soil fertility and crop nutrition in developing countries. Plant and Soil, 335(1), 101-115.
Dohary, C. G., Rochester, I. J., & Blair, G. J. (2004). Response of field grown cotton (Gossypium hirsutum L.) to phosphorus fertilization on alkaline soils in eastern Australia. Australian Journal of Soil Research, 42(8), 913-920.
Empresa Brasileira de Pesquisa Agropecuária (2013). Sistema brasileiro de classificação de solos. Brasília, DF: Embrapa.
Fageria, N. K., & Baeta, A. B. (2008). The role of nutrient efficient plants in improving crop yields in the twenty first century. Journal of Plant Nutrition, 31(6), 1121-1157. Fageria, N. K., & Baligar, V. C. (1997). Upland rice
genotypes evaluation for phosphorus use efficiency. Journal of Plant Nutrition, 20(5), 499-509.
Fageria, N. K., & Moreira, A. (2011). The role of mineral nutrition on root growth of crop plants. Advances in Agronomy, 110(1), 251-331.
Fageria, N. K., Baeta, A. B., & Alexandre, B. H. (2011). Lowland rice genotypes evaluation for phosphorus use efficiency in tropical lowland. Journal of Plant Nutrition, 34(8), 1087-1095.
Fageria, N. K., Baligar, V. C., Moreira, A., & Portes, T. A. (2010). Dry bean genotypes evaluation for growth, yield components and phosphorus use efficiency. Journal of Plant Nutrition, 33(14), 2167-2181.
Fernandes, C., & Muraoka, T. (2002). Phosphorus absorption by of corn hybrids grown in savana soils. Scientia Agricola, 59(1), 781-787.
George, T. S., Turner, B. L., Gregory, P. J., Cade-Menun, B. J., & Richardson, A. E. (2006). Depletion of organic phosphorus from Oxisols in relation to phosphatase activities in the rhizosphere. European Journal of Soil Science, 57(1), 47-57.
Hocking, P. J., Keerthisinghe, G., Smith, F. W., & Randall, P. J. (1991). Comparison of the ability of different crop species to access poorly-available soil phosphorus. In T. Ando, K. Fugita, T. Mae, H. Matsumoto, S. Mori, & J. Sekyta (Eds.), Plant nutrition for sustainable food production and environment (p. 55-60). Dordrecht, NL: Klumer Academic Publisher.
Hu, Y., Ye, X., Shi, L., Duan, H., & Xu, F. (2010). Genotypic differences in root morphology and phosphorus uptake kinetics in Brassica Napus under low phosphorus supply. Journal of Plant Nutrition, 33(6), 889-901.
Lambers, H., Clements, J. C., & Nelson, M. N. (2013). How a phosphorus acquisition strategy based on carboxylate exudation powers the success and agronomic potential of lupines (Lupinus, Fabaceae). American Journal of Botany, 100(2), 263-288.
Larsen, S. (1952). The use of 32P in studies of the uptake of phosphorus by plants. Plant and Soil, 4(1), 1-10. Larsen, S. (1967). Isotopic exchange of phosphate in paddy
soils. Plant and Soil, 27 (3), 401-407.
Liao, H., Yan, X., Rubio, G., Beebe, S. E., Blair, M. W., & Lynch, J. P. (2004). Genetic mapping of basal root
gravitropism and phosphorus acquisition efficiency in common bean. Functional Plant Biology, 31(10), 959-970. Lynch, J. P., & Ho, M. D. (2005). Rhizoeconomics:
carbon costs of phosphorus acquisition. Plant and Soil, 269(1), 45-56.
Ma, W., Ma, L., Li, J., Wang, F., Sisák, I., & Zhang, F. (2011). Phosphorous flows and use efficiencies in production and consumption of wheat, rice, and maize in China. Chemosphere, 84(6), 814-821.
Malavolta, E., Vitti, C. G., & Oliveira, S. A. (1996). Avaliação do estado nutricional das plantas: princípios e aplicações. Piracicaba, SP: Associação Brasileira para Pesquisa da Potassa e do Fosfato.
Manly, B. J. F. (2008). Métodos estatísticos multivariados: uma introdução. Porto Alegre, RS: Bookman.
Raghothama, K. G., & Karthikeyan, A. S. (2005). Phosphate acquisition. Plant and Soil, 274(1), 37-49. Richardson, A. E., Hocking, P. J., Simpson, R., & George, T.
S. (2009). Plant mechanisms to optimise access to soil phosphorus. Crop & Pasture Science, 60(2), 124-143. Shane, M. W., Lambers, H., Cawthray, G. R., Kuhn, A. J.,
& Schurr, U. (2008). Impact of phosphorus mineral source (Al-P or Fe-P) and pH on cluster-root formation and carboxylate exudation in Lupinus albus L. Plant and Soil, 304(1), 169-178.
Vance, C. P., Uhde-Stone, C., & Allan, D. L. (2003). Phosphorus acquisition and use: critical adaptations by plants for securing a nonrenewable resource. New Phytologist, 157(3), 423-447.
Vose, P. B. (1980). Introduction to nuclear techniques in agronomy plant biology. London, UK: Pergamon Press. Wang, X. J., Guppy, C., Watson, L., Sale, P. W. G., &
Tang, C. (2011). Availability of sparingly soluble phosphorus sources to cotton (Gossypium hirsutum L.), wheat (Triticum aestivum L.) and white lupin (Lupinus albus L.) with different forms of nitrogen as evaluated by a 32P isotopic dilution technique. Plant and Soil,
348(1), 85-98.
Wang, X., Tang, C., Guppy, C. N., & Sale, P. W. G. (2008). Phosphorus acquisition characteristics of cotton (Gossypium hirsutum L.), wheat (Triticum aestivum L.) and white lupin (Lupinus albus L.) under P deficient conditions. Plant and Soil, 312(1), 117-128. Zhang, F. S., Cui, Z. L., Chen, X. P., Ju, X. T., Shen, J. B.,
Chen, Q., … Fan, M. S. (2012). Integrated nutrient management for food security and environmental quality in China. In D. L. Sparks (Eds.), Advances in agronomy (p. 1-40). San Diego, CA: Academic Press.
Received on February 9, 2015. Accepted on July 1, 2015.
![Table 2. Mean values of DWS, [P] and PU of cotton cultivated in high P (120 mg kg -1 ) and low P (20 mg kg -1 ) conditions](https://thumb-eu.123doks.com/thumbv2/123dok_br/16003812.691717/4.892.83.412.568.877/table-mean-values-dws-cotton-cultivated-high-conditions.webp)