The tomato (Solanumlycopersicum) is the most important vegetable crop cultivated in Brazil. In 2010, a total of 4.2 million metric tonnes were harvested in a cultivated area of 64.7 thousands hectares. It is estimated that 2.0 million tonnes, about 60% of the total production, was marketed for fresh produce and the remaining 40% was designated for industrial use. According to the world statistics available from 2005 to 2010, Brazil was ranked as the 9th largest tomato producer (Faostat, 2012).
The use of F1 hybrids provides some advantages to growers and consumers,
particularly increased yield, earliness, greater fruit uniformity, improved standardization and fruit quality, enhanced pest and disease resistance or tolerance, extended keeping qualities, and reduced seed cost per area unit (Melo et al., 1988; Koch, 1995; Maluf, 2001, Souza et al., 2012). In general, simple hybrid schemes are used to obtain hybrid seeds of self pollinated species, such as tomato, since homozygous species do not lose their vigor, thus not affecting seed production.
Tomato breeding programs have traditionally focused on developing hybrids with improved agronomic
performance particularly traits related to yield and fruit quality. For that reason, expanding knowledge about the nature and magnitude of correlations between traits of interest is of utmost importance. Selection for a particular trait may either increase or reduce the expression of another trait, depending on the genetic correlation between them.
P h e n o t y p i c c o r r e l a t i o n s a r e estimated directly from values measured in the field and are the result of genetic and environmental causes. Only the genetic portion of phenotypic correlations is used to guide breeding programs, because it represents the Brasileira 30: 627-631.
Correlations between yield and fruit quality characteristics of fresh
market tomatoes
Lívia M de Souza1;Paulo César T Melo2; Reginaldo R Luders1; Arlete MT Melo1
1IAC, C. Postal 28, 13012-970 Campinas-SP; [email protected]; [email protected] (corresponding author); 2 USP-ESALQ, Depto. Prod. Vegetal, C. Postal 9, 13418-900 Piracicaba-SP; [email protected]
ABSTRACT
Genotypic, phenotypic and environmental correlations were estimated for all possible pairs among eleven characters of tomatoes.
Fifteen treatments including five parents and ten hybrids of Instituto
Agronômico (IAC) tomato breeding program were evaluated using a randomized complete block experimental design, with tree replications in Itatiba, São Paulo state, Brazil, during 2005/2006.
The following traits were evaluated: fruit yield per plant (FP), fruit number per plant (FN), average fruit weight (FW), cluster number per plant (CN), fruit number per cluster (FC), number of locules per fruit (NL), fruit length (FL), fruit width (WI), fruit wall thickness (FT), total soluble solids (SS), and total titratable acidity (TA). The genotypic (rG), phenotypic (rF) and environmental correlations (rA) for two pairs of plant traits were estimated using the Genes© program. High similarity was found among the estimates of genotypic and phenotypic correlations. Positive and high phenotypic and genotypic correlations were observed between FP and the traits FN, FW and FT, and these associations contributed for yield increasing.FW and FT contributed to yield increase and should be considered together as primary yield components in tomato. Positive values of the genotypic
and phenotypic correlations revealed that FP influenced FN with high direct effect and significant positive correlation. These traits may be
included as the main selection criteria for tomato yield improvement.
Keywords: Solanum lycopersicum L., hybrid combinations, vegetable breeding, diallel cross, tomato genotypes.
RESUMO
Correlações entre caracteres de produção e qualidade de frutos de tomate de mesa
Correlações fenotípica, genotípica e ambiental foram estima-das entre todos os possíveis pares de onze caracteres de tomate de mesa. Quinze tratamentos, incluindo cinco parentais e dez híbridos do programa de melhoramento de tomate do Instituto Agronômico (IAC) foram testados no delineamento em blocos casualizados completos, em Itatiba-SP, em 2005/2006. Os seguintes caracteres foram avaliados: produção (FP), número (FN) e peso médio do fruto (FW), número de pencas por planta (CN), número de frutos por penca (FC), número de lóculos por fruto (NL), comprimento do fruto (FL), largura do fruto (WI), espessura da parede do fruto (FT), sólidos
solúveis totais (SS) e acidez titulável total (TA). Os coeficientes de
correlação genotípica (rG), fenotípica (rF) e ambiental (rA) para cada par de caracteres foram estimados pelo programa Genes©. Houve grande similaridade entre as estimativas das correlações genotípicas e fenotípicas estudadas. As correlações genotípica e fenotípica entre FP e os caracteres FN, FW e FT foram positivas e altas, contribuindo para o aumento da produção. FW e FT devem ser considerados, em conjunto, como componentes primários na produção de tomate. Os valores positivos das correlações genotípicas e fenotípicas revelaram
que FP influenciou FN com efeito direto e alta correlação positiva e significativa. Esses caracteres podem ser incluídos como principais
critérios de seleção para aumento da produtividade em tomateiro.
Palavras-chave: Solanumlycopersicum L., combinações híbridas, melhoramento vegetal, cruzamentos dialélicos, genótipos de tomate.
only component of inheritable nature. Correlation studies provide important information for genetic breeding, since they enable to identify and determine the proportion of the phenotypic correlation that is associated with genetic causes, to verify whether the selection for a certain trait influences another one, to quantify indirect gains due toselection on correlated traits, and to evaluate the complexity of the traits (Cruz et al., 1988; Tiwari & Upadhyay, 2011).
If two characters exhibit high genetic correlation, it is possible to obtain a gain in one of them through indirect selection of the other trait. This is advantageous when a character of high economic value has low heritability, when compared to the associated trait. This implies that selection may be based on either the character having high heritability or the one that is more easily evaluated, with the objective of co-inheriting the associated trait.
Haydar et al. (2007) observed a correlation between fruit yield and the number of fruits per plant. On the other hand, Singh et al. (1977) found that the number of locules per fruit correlates negatively with the number of fruits per raceme. Tasisa et al. (2012) observed positive and significant genotypic and phenotypic correlation of average fruit yield per plant with fruit clusters and fruits per plant. Ghosh et al. (2010) and Anjum et al. (2009) also observed positive and significant phenotypic and genotypic correlation between tomato yield traits with emphasis on fruit yield and fruit number per plant.
Fruit yield is a complex trait with polygenic inheritance, and correlation studies provide information that selection for one character results in progress for all positively correlated characters. Correlation studies in tomato breeding programs are useful when highly heritable traits are associated with an important trait like yield.
This study was carried out with the objective to estimate the genotypic, p h e n o t y p i c , a n d e n v i r o n m e n t a l correlation coefficients between eleven traits related to tomato yield and fruit quality.
MATERIAL AND METHODS
Five homozygous tomato lines
with indeterminate growth habit of IAC tomato breeding program, and all possible F1 hybrids between them (leaving reciprocals out of consideration) were used to carry out this study. The experiments were set up under greenhouse conditions at the Syngenta Seeds Experiment Station located in Itatiba, São Paulo state (23°00’21”S, 46°50’20”W), from 2005 to 2006, including the parentals, ten hybrids and one check, which were replicated three times and arranged in a completely randomized block design. The experimental plot comprised six plants, and the data were obtained per plant. A spacing of 1 m between rows, and 0.5 m between plants within the row was used. Seed sowing was done in August 2005 using expanded polystyrene seedling trays, and the seedlings were planted when they had four to six true leaves. Fertilizer was applied as recommended by soil analysis and the plants were irrigated by drip irrigation. Pests and diseases were controlled as required by the crop.
The evaluated yield components were fruit yield per plant (FP), fruit number per plant (FN), average fruit weight (FW), cluster number per plant (CN), fruit number per cluster (FC), fruit wall thickness (FT) and number of locules per fruit (NL). These traits were evaluated when fruits of the plants of each plot were fully ripen, and a total of five harvests were made in a period of 58 days.
For fruit quality components evaluation five random samples per plot were harvested, each 10-15 days. It were evaluated total soluble solids (SS) measured with refractometer (Carvalho, 1990); total titratable acidity (TA) using the method of Chitarra & Chitarra (1990); fruit length (FL), and fruit width (WI). Although the data were from individual plants, analysis were performed based on plot means. The Genes© software (Windows version 2004.2.1), developed by Cruz (2004) was used to estimate the genotypic (rG), phenotypic (rF), and environmental (rA) correlation coefficients for each pair of traits.
RESULTS AND DISCUSSION
Phenotypic and genotypic correlation
coefficients are showed in Tables 1 and 2. The results revealed that for all trait pairs, the signals and magnitude of the values were either equal or very close to each other. In most cases, the values of genotypic correlations (Table 2) were slightly higher than phenotypic ones (Table 1). In general, both genotypic and phenotypic correlations were higher than the environmental ones (Table 3), indicating an inherent association between several traits regardless of
environmental factors influence. The findings clearly showed that genotypic correlations were of higher magnitude to the corresponding phenotypic ones, thereby establishing strong relationship among the traits studied, and these results agree with those obtained by
Tiwari & Upadhyay (2011).
In general, breeders consider 0.5 a high correlation coefficient (Miranda et al., 1988). In fact, out of a total of 55 possible combinations between the eleven traits studied, only four environmental correlation coefficients were greater than their corresponding genotypic correlation coefficient.
There was a positive and significant correlation between FP and FN, FW, CN, TA, FT. Fruit yield per plant exerted a significant and positive association with FN at genotypic (0.950) and phenotypic (0.944) levels. For the same genotypes, Souza et al. (2012) observed high general and specific combining ability, and high heterotic responses for total fruit weight and fruit number per plant.
Also, Anjun et al. (2009) observed high positive significant correlation between these two economically important traits at both phenotypic as well as genotypic levels. CN showed positive and significant genotypic and phenotypic correlation with FP by having positive direct effect at both levels, indicating the true relationship between them and the feasibility to exploit the potentiality of this trait for effective direct selection to improve FP (Tasisa et al., 2012) and corroborated with results obtained by Ghosh et al. (2010).
According to Haydar et al. (2007), the positive associations of these traits may lead to yield increasing. Yield is a complex trait associated with a number of plant and fruit. It is the prime concern of the plant breeder and is the final factor
on which selection programs are to be envisaged. All changes in yield must be accompanied by changes in one or more characters (Graffius, 1964).
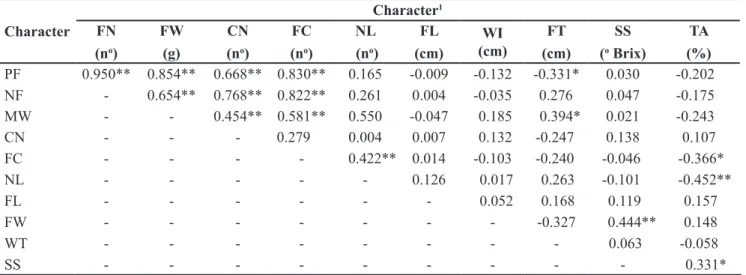
Environmental correlations greater than 0.5 were found between FP with
FN (0.950), FW (0.854), CN (0.668), and FC (0.830) indicating that these correlations were more influenced by the environment than by the genetic factors (Table 3). The positive genotypic correlation observed between FP and Table 1. Estimate of phenotypic correlation coefficients between eleven fruit characters in a diallelic cross between fresh market tomato
lines (estimativa dos coeficientes de correlação fenotípica entre onze caracteres de frutos em um cruzamento dialélico entre linhagens de
tomate). Itatiba, IAC, 2006.
Character
Character1 FN
(no)
FW
(g)
CN
(no)
FC
(no)
NL
(no)
FL
(cm)
WI
(cm)
FT
(cm)
SS (o Brix)
TA
(%)
FP 0.944** 0.532** 0.723** 0.822** 0.042 0.645 0.332 0.654** -0.183 -0.132
FN - 0.232 0.806** 0.825** -0.164 0.573* 0.127 0.460 -0.061 -0.251
FW - - 0.119 0.282 0.580* -0.107 0.732** 0.703** -0.371 0.198
CN - - - 0.340 -0.026 0.368 0.323 0.207 0.107 -0.317
FC - - - - -0.213 0.585 -0.098 0.577** -0.173 -0.138
NL - - - -0.477 0.685** 0.188 -0.054 0.117
FL - - - -0.311 0.255 0.316 -0.385
WI - - - 0.395 -0.270 0.203
FT - - - -0.299 -0.084
SS - - - 0.122
1FP= fruit yield per plant; FN= fruit number per plant; FW= average fruit weight; CN= cluster number per plant; FC= fruit number per cluster; NL= number of locules per fruit; FL= fruit length; WI= fruit width; FT= fruit wall thickness; SS= total soluble solids; TA= total titratable
acidity (FP= produção de frutos por planta; FN= número de frutos por planta; FW= peso médio do fruto; CN= número de inflorescências por planta; FC= número de frutos por inflorescência; NL= número de lóculos por fruto; FL= comprimento do fruto; WI= largura do fruto;
FT= espessura da parede do fruto; SS= sólidos solúveis totais; TA= acidez titulável total); * and ** indicate significance at the 1% and 5% levels by the t test, respectively (* e ** indicam significância a 1% e 5% pelo teste t, respectivamente).
Table 2. Estimate of genotypic correlation coefficients between eleven fruit characters in a diallelic cross between tomato lines (estimativa
dos coeficientes de correlação genotípica entre onze caracteres de frutos em um cruzamento dialélico entre linhagens de tomate). Itatiba,
IAC, 2006.
Character
Character1 FN
(no)
FW
(g)
CN
(no)
FC
(no) NL (n
o) FL
(cm)
WI
(cm)
FT
(cm)
SS
(o Brix)
TA
(%)
FP 0.950** 0.414 0.746** 0.826** 0.037 0.539* 0.401 0.862** -0.268 -0.107
FN - 0.115 0.815** 0.826** -0.200 0.638* 0.143 0.566* -0.094 -0.272
FW - - 0.024 0.196 0.682* -0.122 0.858** 0.908** -0.499 0.338
CN - - - 0.355 -0.029 0.412 0.355 0.273 0.098 -0.431
FC - - - - 0.268 0.658* -0.106 -0.701** -0.213 -0.076
NL - - - -0.486* 0.693** 0.187 -0.056 0.168
FL - - - -0.314 0.262 0.368 -0.450
WI - - - 0.419 -0.353 0.266
FT - - - -0.378 -0.091
SS - - - 0.050
1FP= fruit yield per plant; FN= fruit number per plant; FW= average fruit weight; CN= cluster number per plant; FC= fruit number per cluster; NL= number of locules per fruit; FL= fruit length; WI= fruit width; FT= fruit wall thickness; SS= total soluble solids; TA= total titratable
acidity (FP= produção de frutos por planta; FN= número de frutos por planta; FW= peso médio do fruto; CN= número de inflorescências por planta; FC= número de frutos por inflorescência; NL= número de lóculos por fruto; FL= comprimento do fruto; WI= largura do fruto;
FW is not in agreement with those results found by Rani et al. (2008) but it agrees with the results of Haydar et al. (2007) and similar results were also reported by Mehta & Asati (2008). This variancecould be due to differences in genotypes and environments in which the studies were carried out.
Number of locules per fruit exhibited a positive value of 0.580, and significant correlation with FW indicating that the increase in number of locules was accompanied by an increase in average fruit weight. Fruit width also correlates positively with NL and FW, indicating that bigger and heavier fruits also usually have a greater NL. According to Melo et al. (1988), NL is a basic component of FW, which, on its turn, is a primary component of FP. Tiwari & Upadhyay (2011) reported that plant height, fruit diameter and fruit length were directly responsible for the determination of fruit yield in tomato. Haydar et al. (2007) also observed that fruit weight exerted high positive and direct effect on fruit yield per plant.
There was a negative genotypic association between FC and FT (-0.701), which means that an increase in the number of fruits per cluster may reduce FT. Analysis of the other correlations
involving FC shows that this trait also is negatively correlated with WI, SS, and TA. Thus, among the genotypes studied, an increase in FC will decrease FT, SS and TA. For that reason, to improve these traits should not base efforts on FC. Tasisa et al. (2012) found similar results and indicated that these traits play an important role in tomato breeding program.
When associated with SS and TA, all the traits investigated in this study showed low or even negative genotypic correlations, indicating that an increase in SS and TA should not be attempted indirectly through selection of other traits. Similar results have also been reported by Carvalho et al. (2003) and Bernousi et al. (2011). Association of SS with fruit yield and weight was not significant according to Rani et al. (2008).
Genotypic correlations showed values very close to those of phenotypic correlations, both being elements of the same signal. This clearly shows that the genetic factors contributed more than the environmental factors to the correlations studied and that the phenotype adequately reflected the genotype. The results of this study are valid only for the homozygous lines
included in this work.
The present study suggests that positive values of the genotypic and phenotypic correlations between FP and FN, FW and FT contributed to yield increase and should be considered together as primary yield components in tomato breeding.
ACKNOWLEDGEMENTS
To CAPES, for the scholarship granted to the first author, and Syngenta Seeds Ltda. for providing the structure required for the experiment.
REFERENCES
ANJUM A; RAJ N; NAZEER A; KAHN SH. 2009. Genetic variability and selection parameters for yield and quality attributes in tomato. Indian Journal of Horticulture 66: 73-78.
BERNOUSI I; EMAMI A; TAJBAKHSH M; DARVISHZADEH R; HENAREH M. 2011. Studies on genetic variability and correlation among the different traits in Solanum Lycopersicum L. Notulae Botanicae Horti Agrobotanici Cluj-Napoca 39: 152-158. CARVALHO JOM; LUZ JMQ; JULIATTI FC;
MELO LC; TEODORO REF; LIMA LML. 2003. Desempenho de famílias e híbridos comerciais de tomateiro para processamento industrial com irrigação por gotejamento. Table 3. Estimate of environmental correlation coefficients between eleven fruit characters in a diallelic cross between tomato lines (es
-timativa dos coeficientes de correlação ambiental entre onze caracteres de frutos em um cruzamento dialélico entre linhagens de tomate).
Itatiba, IAC, 2006.
Character
Character1 FN
(no)
FW
(g)
CN
(no)
FC
(no)
NL
(no)
FL
(cm)
WI (cm)
FT
(cm)
SS
(o Brix)
TA
(%)
PF 0.950** 0.854** 0.668** 0.830** 0.165 -0.009 -0.132 -0.331* 0.030 -0.202
NF - 0.654** 0.768** 0.822** 0.261 0.004 -0.035 0.276 0.047 -0.175
MW - - 0.454** 0.581** 0.550 -0.047 0.185 0.394* 0.021 -0.243
CN - - - 0.279 0.004 0.007 0.132 -0.247 0.138 0.107
FC - - - - 0.422** 0.014 -0.103 -0.240 -0.046 -0.366*
NL - - - 0.126 0.017 0.263 -0.101 -0.452**
FL - - - 0.052 0.168 0.119 0.157
FW - - - -0.327 0.444** 0.148
WT - - - 0.063 -0.058
SS - - - 0.331*
1FP= fruit yield per plant; FN= fruit number per plant; FW= average fruit weight; CN= cluster number per plant; FC= fruit number per cluster; NL= number of locules per fruit; FL= fruit length; WI= fruit width; FT= fruit wall thickness; SS= total soluble solids; TA= total titratable
acidity. (FP= produção de frutos por planta; FN= número de frutos por planta; FW= peso médio do fruto; CN= número de inflorescências por planta; FC= número de frutos por inflorescência; NL= número de lóculos por fruto; FL= comprimento do fruto; WI= largura do fruto;
ambiente entre caracteres de fruto e planta de pimentão (Capsicum annuum L.). Revista Brasileira de Genética 11: 457-468. RANI CI; VEERARAGAVATHATHAM D;
SANJUTHA, S. 2008. Studies on correlation and path coefficient analysis on yield attributes in root knot nematode resistant F1 hybrids of tomato. Journal of Applied Sciences Research 4: 287-295.
SINGH HN; SINGH RR; MITAL RK. 1977. Genotypic and phenotypic variability in tomato. Indian Journal of Agricultural Sciences 44: 807-811.
SOUZA LM; PATERNIANI MEAGZ; MELO PCT; MELO AMT. 2012. Diallel cross among fresh market tomato inbreeding lines. Horticultura Brasileira 30: 246-251. TASISA J; BELEW D; BANTTE K. 2012.
Genetic associations analysis among some traits of tomato (Lycopersicon esculentum Mill.) genotypes in West Showa, Ethiopia. International Journal of Plant Breeding and Genetics 6: 129-139.
TIWARI JK; UPADHYAY D. 2011. Correlation and path-coefficient studies in tomato (Lycopersicon esculentum Mill.) Research Journal of Agricultural Sciences 2: 63-68. HANNAN MM; KARIM R; RAZVY MA;
ROY UK; SALAHIN M. 2007. Studies on genetic variability and unterrelationship among the different traits in tomato (Lycopersicon esculentum Mill.) Middle-East. Journal of Scientific Research 2: 139-142.
KOCH PS. 1995. Análise genética de um cruzamento dialélico em abobrinha (Cucurbita pepo L.). Piracicaba: USP-ESALQ, 79p (Dissertação mestrado).
MALUF WR. 2001. Heterose e emprego de híbridos F1 em hortaliças. In: NASS LL; VALOIS ACC; MELO IS; VALADARES MC. (eds). Recursos genéticos e melhoramento: plantas. Rondonópolis: Fundação MT, p.327-356.
MEHTA N; ASATI BS. 2008. Genetic relationship of growth and development traits with fruit yield in tomato (Lycopersicon esculentum Mill). Karnataka Journal of Agricultural Sciences 21: 92-96.
MELO PCT; MIRANDA JEC; COSTA CP. 1988. Possibilidades e limitações do uso de híbridos F1 de tomate. Horticultura Brasileira 6: 4-6. MIRANDA JEC; COSTA CP; CRUZ CD. 1988.
Correlações genotípica, fenotípica e de Horticultura Brasileira 21: 525-533.
CHITARRA MI; CHITARRA AB. 1990. Pós-colheita de frutos e hortaliças: fisiologia e manuseio. Lavras: ESAL/FAEPE, 320p. CRUZ CD. 2004, 15 de maio. Programa Genes
- Versão Windows. Aplicativo Computacional em Genética e Estatística. Viçosa: UFV. Disponível em http://www.ufv.br/dbg/genes/ genes.htm.
CRUZ CD; MIRANDA JEC; COSTA CP. 1988. Correlações, efeitos diretos e indiretos de caracteres agronômicos sobre a produção de pimentão (Capsicum annuum L.). Revista Brasileira de Genética 11: 921-928. FAOSTAT. 2012, 8 de agosto. Database results.
Disponível em: http://faostat.fao.org/. GHOSH KP; ISLAM AKMA; MIAN MAK;
HOSSAIN MM. 2010. Variability and character association in F2 segregating population of different commercial hybrids of tomato (Solanum lycopersicum L.). Journal of Applied Science and Environmental Management 14: 91-95.
GRAFFIUS R, 1964. A geometry for plant breeding. Crop Science 4: 241-246.