Food Science and Technology
DO:
D https://doi.org/10.1590/1678-457X.07017
OSSN 0101-2061 (Print) OSSN 1678-457X (Dnline)
1 Introduction
On the last years, dairy products and their byproducts have been studied and comprehensively valued in the food industry (Banaszewska et al., 2013; Yadav et al., 2015). Whey, a byproduct of the manufacture of cheese, keeps about 55% of milk nutrients. Ots proximal average composition comprises 93% water, 5-6% lactose, 0.85% protein, 0.53% minerals and 0.36% lipids (Pescuma et al., 2010). Whey has around 15% more protein than other food sources in relation to its biological value, due to high contents of essential amino acids, such as isoleucine, leucine, valine, methionine and cysteine, which makes whey protein a complete source of proteins (Childs et al., 2007). Compared with other high-quality proteins, whey has the higher branched-chain amino acid content (primarily leucine), which plays an important role to promote lean body mass (Ren et al., 2017; Childs et al., 2007).
Whey used to be considered a highly polluting effluent that was hard to treat, but it is now been employed in food technology in several ways, mainly in the recovery of protein, lactose fermentation and hydrolysis of its monosaccharide components (Pescuma et al., 2010; Rivas et al., 2011; Prazeres et al, 2012; Trigueros et al., 2016). Some studies have described
the production whey fermented with Lactobacillus rhamnosus, Bifidobacterium bifidum and Propionibacterium freudenreichii
subsp. shermani strains (Maity et al., 2008); energy beverages based on hydrolyzed milk (Singh & Singh, 2012); and functional beverages (Gad et al., 2013; Luiz et al., 2014; Amaral et al., 2018). Whey promotes a smooth mouth feel and a discreet dairy flavor to beverages, and combines with chocolate flavor (Mann et al., 2015). Chocolate was also the preferred flavor for 40% of the panelists that tasted a whey/soy based beverage (Nam et al., 2017). Whey has a low amount of antioxidants, but soy extracts contain various antioxidants, including isoflavones and other flavonoids that present in vitro and in vivo functionalities (Ren et al., 2017).
Soybean is a raw material that is rich in protein (45-50%), carbohydrates (23-35%) and unsaturated fat (22-32%). Besides that, it also contains some isoflavones and has widespread industrial applications (Kwon et al., 2011; He & Chen, 2013; Childs et al., 2007; Haiti et al., 2017). Nowadays, people are looking for products that have a healthy appeal, and soy protein can promote heart healthy by reducing the risk of cardiovascular disease and provide anticarcinogenic effects to hormone-related diseases (Childs et al., 2007). Ren et al. (2017) observed that
Development and optimization of a mixed beverage made of whey and water-soluble
soybean extract flavored with chocolate using a simplex-centroid design
Dóris Faria de DLOVEORA1, Daniel GRANATD1, Ana Cláudia BARANA1*
Received 02 Mar., 2017 Accepted 20 Sept., 2017
1 Programa de Pós-graduação em Ciência e Tecnologia de Alimentos, Universidade Estadual de Ponta Grossa – UEPG, Ponta Grossa, PR, Brazil
*Corresponding author: [email protected]
Abstract
This study aimed to combine the nutritional advantages of whey and soybean by developing a type of chocolate beverage with water-soluble soybean extract dissolved in whey. Different concentrations of thickeners (carrageenan, pectin and starch – maximum level of 500 mg.100 mL-1) were tested by a simplex-centroid design. Several physicochemical, rheological, and sensory properties of the beverages were measured and a multi-response optimization was conducted aiming to obtain a whey and soybean beverage with increased overall sensory impression and maximum purchase intention. Beverages presented mean protein levels higher than 3.1 g.100 mL-1, a low content of lipids (< 2 g.100 mL-1) and total soluble solids ≥20 g.100 mL-1. Response surface methodology was applied and the proposed for overall impression and purchase intention presented R2=0.891 and R2=0.966, respectively. The desirability index (d-value=0.92) showed that the best formulation should contain 46% carrageenan and 54% pectin in the formulation. The formulation manufactured with this combination of thickeners was tested and the overall impression was 7.11±1.09 (over a 9-point hedonic scale) and the purchase intention was 4.0±1.3 (over a 5-point hedonic scale), thus showing that the proposed models were predictive.
Keywords: carrageenan; cassava starch; pectin; design of experiments; desirability function; dairy foods.
the ingestion of a soy–whey blended protein increased the performance of rats subjected to physical exercises.
The unpleasant taste of raw beans that results from lipid autoxidation by lipoxygenase is a factor that limits the consumption of soybean-based products (Rodriguez-Roque et al., 2014). Bitter taste and rancid flavor is also a great limitation in utilizing soybean for beverage production (Ma et al., 2015; Nguyen et al., 2016). The use of flavoring, sweeteners, fruit pulps and other extracts, such as chocolate, is a technologically viable option for industries to mask that undesirable taste (Uliana et al., 2012).
Surveys have shown that the consumption of mixed beverages, such as fruit juice with soy milk (water-soluble extract), increased by 6.6% in Europe between 2009 and 2011, whereas the consumption of pure beverages, such as fruit juice or nectar, decreased during that period. This trend is the result of the fact that mixed beverages have a wider variety of nutrients and, consequently, more bioactive compounds than pure beverages (Andrés et al., 2014).
The use of stabilizers in the manufacture of dairy beverages has been recommended to ensure their rheological properties, such as texture, viscosity and firmness (Lee & Lucey, 2010). Stabilizers also prevent the sedimentation of particles in beverages (Dspina et al., 2012). Starches can be used not only as a thickening, stabilizing, gelling, and/or texture agents, but also as a water or fat ligand (Leite et al., 2012; Madruga et al., 2014). Starches are the most frequently used thickeners due to their low cost, and because they do not contribute to any remarkable taste if used at a low concentration of 2-5% (Li & Nie, 2016). Carrageenan is an agent that forms gel and prevents phase separation from happening during the storage of products due to its emulsion stabilizing properties (oil in water). Minimum concentrations are needed in the formulation to ensure good viscosity (Nikaedo et al., 2004). Pectin acts as an emulsion stabilizer in protein-based beverages due to its capacity to lower the interfacial tension between oil and water (Guo et al., 2014; Madruga et al., 2014). Pectin is widely used as a gelling, thickening and stabilizing agent in food products (Vaclavick & Christian, 2014).
On terms of nutritional, technological and environmental advances, the development of a mixed beverage based on whey and soybean is promising, not only because it aggregates commercial value to whey and raises its status from residue to raw material, but also because it carries the nutritional appeal of soybean. Following this technological trend, this study aimed to
develop a whey-based beverage added with water-soluble soybean extract stabilized with an optimal proportion of carrageenan, pectin and starch.
2 Materials and methods 2.1 Development of beverages
On order to produce the mixed beverage, a commercial water-soluble soybean extract (Provesol FB®, Dlvebra Ondustrial S/A, Brazil) was used in the experiments. The sweet whey was the by-product of the manufacture of a type of white cheese produced by a company located in Carambeí, PR, Brazil. The whey was collected immediately after the curds were drained; it was then pasteurized at 90 °C for 10 min and frozen at -18 °C until use. The stabilizers, carrageenan LRA-50 GENULACTA® and pectin LA-210 GRONDSTED® were supplied by CP Kelko and Danisco, respectively. The cassava starch was provided by Amidos Pasquin, Brazil. Sucrose, powdered chocolate and vanilla extract, were purchased in local shops in Ponta Grossa, Brazil.
The determination of the amounts of all the ingredients used for developing the formulations was based on previous tests. Different preliminary tests (data not shown) also showed these three stabilizers as the best for these formulations. The beverages were prepared with whey, 5.5% water-soluble soy extract, 4.5% sucrose, 6.0% chocolate, 0.1% vanilla extract and different proportions of stabilizers carrageenan, pectin and starch. The stabilizers quantities were varied according to the experimental design (Table 1) in a way that the total stabilizer was set at 500 mg.100 mL-1. Sucrose was used to complete this amount in the all formulations (except for formulation C).
To prepare the beverages, firstly the whey was pasteurized at 90 °C/10 min. Then, the solid ingredients were added and homogenized for 5 min using a blender. The beverages were pasteurized at 90 °C/15 min and maintained refrigerated at 6 °C until analysis.
2.2 Experimental design
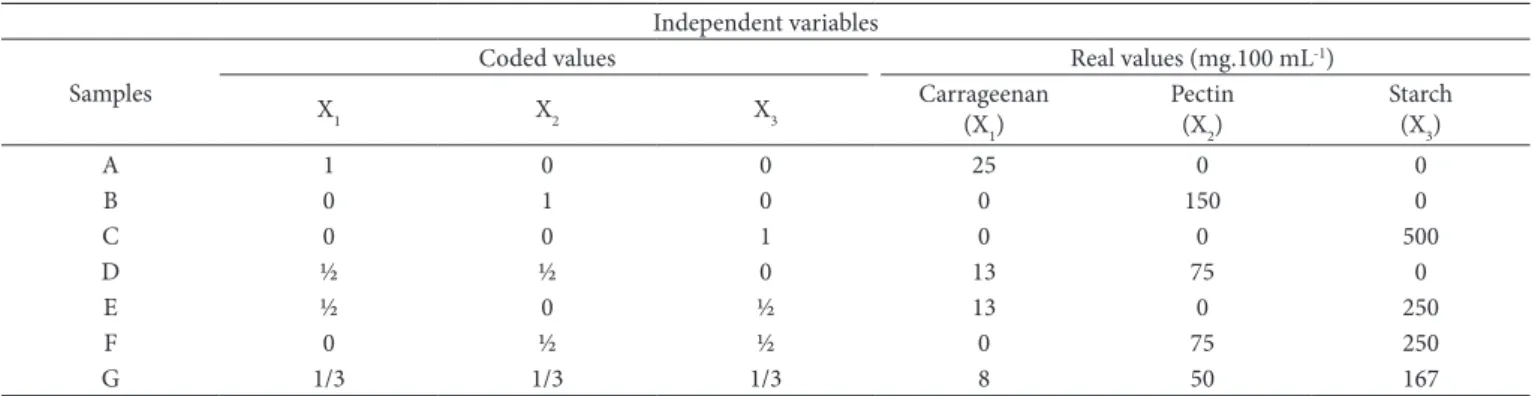
The preparation of the different formulations was based on a simplex-centroid design of mixtures, in which the independent variables were different ratios of the stabilizers, that is, carrageenan, pectin and cassava starch (Table 1). Seven different samples were tested regarding the isolated, binary and ternary combinations of the stabilizers. The determination of
Table 1. Experimental design used in the development of the soy and whey-based beverages. Ondependent variables
Samples
Coded values Real values (mg.100 mL-1)
X1 X2 X3
Carrageenan (X1)
Pectin (X2)
Starch (X3)
A 1 0 0 25 0 0
B 0 1 0 0 150 0
C 0 0 1 0 0 500
D ½ ½ 0 13 75 0
E ½ 0 ½ 13 0 250
F 0 ½ ½ 0 75 250
the maximum and minimum values of each stabilizer was based on previous tests (data not shown).
2.3 Physicochemical and rheological analyses
pH, titratable acidity (TA), soluble solids (SS), protein content, reducing sugar (RS), total reducing sugar (TRS), lipids, moisture and ash contents were measured in accordance with the guidelines issued by the ADAC (Association of Dfficial Analytical Chemists, 2002).
The rheological parameters (apparent viscosity, flow behavior and consistency coefficient) were determined using a Brookfield LDVOO+PRD viscometer, spindle 16, maximum torque 100%, and the analysis was conducted at 8 °C. The data regarding consistency coefficient and flow behavior were calculated using Wingther® for Windows® 2.2 software (Brookfield Engineering Laboratories) based on the Power Law (Drunkler et al., 2012). All the rheological analyses were carried out in triplicate.
2.4 Sensory analysis
Prior to the sensory analysis, the microbiological analyses were performed to assure food safety. For this purpose, the coliform count was conducted at a 45 °C by the most probable number method, while Bacillus cereus and Salmonella sp. were analyzed in compliance with the Technical Regulation on Microbiological Standards for Food (Brasil, 2001).
The sensory analyses of seven formulations were carried out. Four attributes (taste, sweetness, viscosity, and overall impression) were evaluated using a nine-point hedonic scale, in which 1 corresponded to “extremely dislike” and 9 corresponded to “extremely like” (Lawless & Heymann, 1999). Purchase intention was verified by the Attitude Scale, in which 1 corresponded to “certainly wouldn’t buy” and 5 corresponded to “certainly would buy” (Dsawa et al., 2008; Moura et al. 2016; Barbosa et al., 2017). Dne hundred untrained panelists (67 women and 33 men) took part in the analyses. Each panelist received 30 mL of every formulation, which was served at 7 °C in white and opaque plastic glasses codified with 3 digits. The samples were monadically introduced in three sessions, which were carried out using normal lighting conditions at 20 °C. The procedures applied to the sensory analysis had been previously approved by the Ethics in Research and Human Beings Committee at the University (Process nº 091.80913.1.0000.0105), and the test procedure was explained to each panelist before analysis.
2.5 Statistical analysis
The data were evaluated in terms of normality and homogeneity of variances by Shapiro-Wilk’s and Levene’s tests, respectively. The parametric data underwent unifactorial analysis of variances (ANDVA) followed by Fisher’s test for multiple comparisons. Kruskal-Wallis test was applied to the data that did not follow a normal distribution. P-values below 0.05 were used to reject the null hypothesis (Granato et al., 2014). Spearman’s correlation test was applied to check associations between the data.
Response surface methodology (RSM) was used to evaluate the effects of the independent variables on the responses, in
agreement with the quadratic model adapted from Equation 1 (Karnopp et al., 2017). The responses were represented by Ŷ, where b1, b2, b3, b11, b22, b33, b12, b13 and b23 were the regression coefficients and x1, x2 and x3 were the codified factors.
1 1 2 2 3 3 12 1 2 13 1 3 23 2 3
Y=bx +bx +bx +b x x +b x x +b x x (1)
The response variables were evaluated by analysis of variances (ANDVA). Non-significant coefficients (p > 0.10) were excluded from the initial model and the results were readjusted using Equation 1. The resulting regression models were evaluated regarding their statistical quality by the coefficient of determination, R2, and by the adjusted coefficient of determination, R2adj, and by the value of probability (“p-value”) of the multiple regression model.
The desirability function proposed by Derringer & Suich (1980) was used to optimize the beverage. The optimization procedure was conducted using a total of 60 interactions to assure the best combination of thickener agents. The following attributes were used to optimize the thickeners: overall impression and purchase intention. The main purpose of this procedure was to maximize these attributes as they are highly correlated with sensory acceptance of this type of beverage. The optimal formulation of thickeners indicated by the software was used to manufacture a new beverage that was tested for its sensory acceptance and purchase intention aiming to validate the regression model proposed by RSM. For this purpose, the experimental data were compared to those proposed by the regression model using the one sample t-test (Granato et al., 2014). All the data were analyzed using Statistica 7.0 (Statsoft Onc. South America, Tulsa, USA) and Action 2.6 (Estatcamp, São Paulo, Brazil) software.
3 Results and discussion
3.1 Physicochemical and rheological analyses
On the physicochemical characterization (Table 2), all the responses had significant differences in the formulations, except ash (p=0.35). Regarding the pH, there was little variation, although there was statistical difference (p<0.001).
The comparison of the results of this experiment and the data found in nutritional information tables of commercial beverages based on soybean or whey, showed that the protein content of the formulations prepared in this study was higher than those in commercial beverages. The lowest protein content in this study was 3.1 g.100mL-1, i.e., 1.2-fold the protein content found in commercial soybean based beverage, and 4.1-fold the protein content found in whey based beverages. This occurred because of the association of proteins from whey and from the soybean extract.
protein content is higher than the findings by Della Lucia et al. (2016), probably because of the combination of soy and whey.
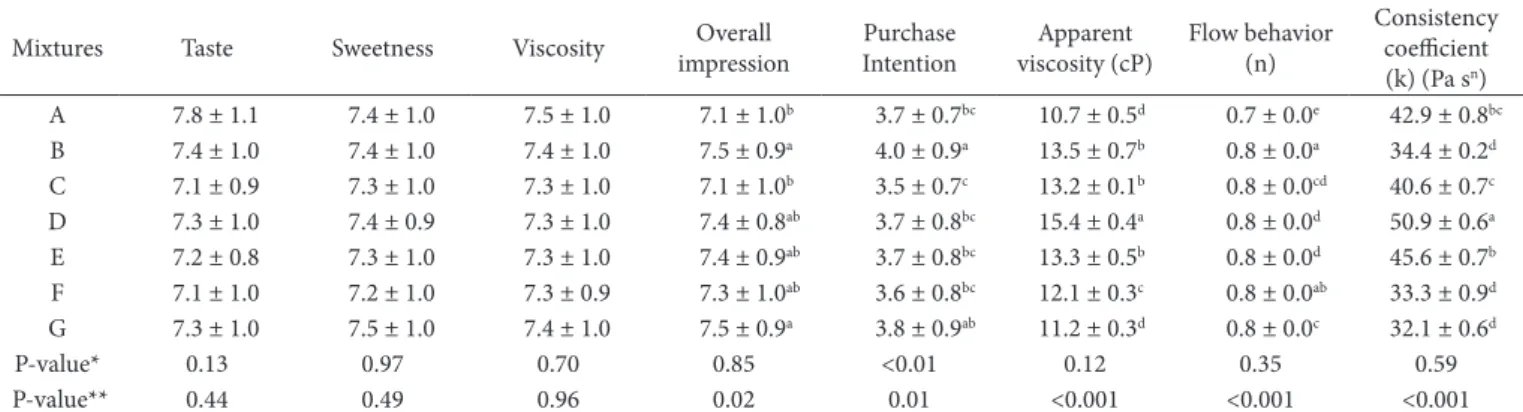
The analysis of the rheological behavior of the formulations (Table 3) showed that the use of both carrageenan and pectin (50%/50%), sample D, resulted in a beverage whose apparent viscosity was higher than the beverages in which both thickeners were found separately (samples A and B, respectively). According to Leite et al. (2012), when carrageenan is combined with other hydrocolloids, such as starch and pectin, it acts more efficiently on the rheological properties of food.
On the present study, pectin affected the consistency coefficient negatively, compared with the other stabilizers. The samples containing 100% pectin (sample B), 50% pectin (sample F), and 33% pectin (sample G), had the lowest consistency coefficient value, compared with the samples that contained starch or carrageenan. Flow behavior index and consistency coefficient did not correlate (p > 0.05) to any of the responses, while apparent viscosity correlated with total soluble solids (ρ=0.95, p=0.001).
According to Marafon et al. (2011), an increase in the soluble solids improves the consistency of a product; a fact that may be confirmed by the data relating to samples D and E, which
had higher consistency coefficient values as well as the highest content of soluble solids. The values for flow behavior “n” were calculated by the Power Law, the results of which (values of n < 1) enable formulations to be classified as slightly pseudoplastic non-Newtonian fluids (Drunkler et al., 2012).
3.2 Sensory analysis
The analysis of the microbiological results showed that all the formulations complied with the Technical Regulation on Microbiological Standards for Food (Brasil, 2001).
ANDVA was applied to the data of the sensory analysis (Table 3) and showed that there was no significant difference in taste (p=0.44), sweetness (p=0.49) and viscosity (p=0.96). Regarding the overall impression, the data showed significant differences (p=0.02) between formulations. However, there was no difference between samples B (100% pectin), D (50% carrageenan and 50% pectin), E (50% carrageenan and 50% starch), F (50% pectin and 50% starch) and G (33.3% carrageenan, 33.3% pectin and 33.3% starch). For overall impression, these samples were rated from 7.3 to 7.5. Samples A (100% carrageenan) and C (100% starch) were also similar to samples E and F, and were
Table 2. Physicochemical characterization of the beverages (mean and standard deviation).
Mixtures Car Pec Star (g.100 mLMoisture-1)
Ash (g.100 mL-1)
Proteins
(g.100 mL-1) pH
TA (°D)
Lipids (g.100 mL-1)
Soluble solids (°Brix)
Reducing sugars (g.100 mL-1)
Total reducing
sugars (g.100 mL-1) A 25 0 0 80.6 ± 0.2a 0.9 ± 0.0 3.4 ± 0.0b 6.6 ± 0.0a 13.2 ± 0.1c 1.7 ± 0.0bcd 20.0 ± 0.8e 3.7 ± 0.5a 12.1 ± 0.43bc B 0 150 0 79.4 ± 0.3bc 0.9 ± 0.0 3.7 ± 0.1a 6.5 ± 0.0c 14.6 ± 0.1b 1.8 ± 0.0ab 20.6 ± 0.1cd 3.5 ± 0.1a 11.8 ± 0.5bc C 0 0 500 80.0 ± 0.1ab 0.8 ± 0.1 3.1 ± 0.1c 6.5 ± 0.0ab 13.5 ± 0.2c 1.7 ± 0.0bc 20.9 ± 0.1c 3.6 ± 0.3a 12.7 ± 0.5b D 13 75 0 79.2 ± 0.8c 0.7 ± 0.0 3.6 ± 0.1a 6.5 ± 0.0c 15.4 ± 0.1a 1.8 ± 0.0a 21.9 ± 0.1a 3.4 ± 0.3a 13.8 ± 0.5a E 13 0 250 79.5 ± 0.5bc 1.0 ± 0.0 3.2 ± 0.2bc 6.5 ± 0.0b 14.3 ± 0.2b 1.6 ± 0.0e 21.6 ± 0.3a 3.3 ± 0.3a 11.6 ± 0.4c F 0 75 250 79.8 ± 0.4bc 0.9 ± 0.0 3.3 ± 0.1bc 6.5 ± 0.0b 12.0 ± 0.6d 1.7 ± 0.0cd 21.2 ± 0.2b 3.5 ± 03a 12.3 ± 0.3bc G 8 50 167 80.1 ± 0.2ab 0.9 ± 0.0 3.3 ± 0.0b 6.5 ± 0.0ab 12.0 ± 0.6d 1.7 ± 0.0de 20.4 ± 0.1d 2.7 ± 0.2b 13.8 ± 0.2a
P-value (homocedasticity)*
0.61 0.55 0.78 0.72 0.79 0.96 0.73 0.76 0.94
P-value (one-way ANDVA)**
0.02 0.35 <0.001 <0.001 <0.001 <0.001 <0.001 <0.001 <0.001
*Probability values obtained by Levene test; **Probability values obtained by one-way ANDVA. Different letters in the same column denote differences between samples (p < 0.05).
Table 3. Rheological characterization and sensory results of the formulations.
Mixtures Taste Sweetness Viscosity Dverall impression
Purchase Ontention
Apparent viscosity (cP)
Flow behavior (n)
Consistency coefficient (k) (Pa sn) A 7.8 ± 1.1 7.4 ± 1.0 7.5 ± 1.0 7.1 ± 1.0b 3.7 ± 0.7bc 10.7 ± 0.5d 0.7 ± 0.0e 42.9 ± 0.8bc B 7.4 ± 1.0 7.4 ± 1.0 7.4 ± 1.0 7.5 ± 0.9a 4.0 ± 0.9a 13.5 ± 0.7b 0.8 ± 0.0a 34.4 ± 0.2d C 7.1 ± 0.9 7.3 ± 1.0 7.3 ± 1.0 7.1 ± 1.0b 3.5 ± 0.7c 13.2 ± 0.1b 0.8 ± 0.0cd 40.6 ± 0.7c D 7.3 ± 1.0 7.4 ± 0.9 7.3 ± 1.0 7.4 ± 0.8ab 3.7 ± 0.8bc 15.4 ± 0.4a 0.8 ± 0.0d 50.9 ± 0.6a E 7.2 ± 0.8 7.3 ± 1.0 7.3 ± 1.0 7.4 ± 0.9ab 3.7 ± 0.8bc 13.3 ± 0.5b 0.8 ± 0.0d 45.6 ± 0.7b F 7.1 ± 1.0 7.2 ± 1.0 7.3 ± 0.9 7.3 ± 1.0ab 3.6 ± 0.8bc 12.1 ± 0.3c 0.8 ± 0.0ab 33.3 ± 0.9d G 7.3 ± 1.0 7.5 ± 1.0 7.4 ± 1.0 7.5 ± 0.9a 3.8 ± 0.9ab 11.2 ± 0.3d 0.8 ± 0.0c 32.1 ± 0.6d
P-value* 0.13 0.97 0.70 0.85 <0.01 0.12 0.35 0.59
P-value** 0.44 0.49 0.96 0.02 0.01 <0.001 <0.001 <0.001
rating from 7.1 to 7.4. Dverall impression and taste had a strong correlation (ρ=0.96, p=0.001), showing that the taste had a great impact on the evaluation of the overall impression. On general, all the formulations were well accepted, with a mean score equal to or above 7 (“moderately like”) in all the attributes.
Similarly, Tranjan et al. (2009) evaluated the color, odor, consistency and taste of a beverage made from goat whey. The authors obtained lower scores that those found in the present study, mainly regarding taste. The score for the peach beverage was 5.4 and that of the strawberry beverage was 6.2, based on a nine-point scale. Castro et al. (2013) developed a probiotic whey-based beverage and found that beverages with whey contents greater than 65% resulted in lower sensory acceptance. They explained that greater amounts of whey results in a more astringency beverage, which is a negative factor. Della Lucia et al. (2016) observed that viscosity contributes to product acceptance, but here there was no correlation between these two variables. Ma et al. (2015) correlated soybean seed chemical traits, soymilk character and soymilk sensory attributes among 70 genotypes, and they found that soymilk sensory attributes are positively correlated with glycinin/beta-conglycinin protein ratio, soluble solid and oil content, but negatively correlated with glycitein and protein content.
3.3 Response surface modeling
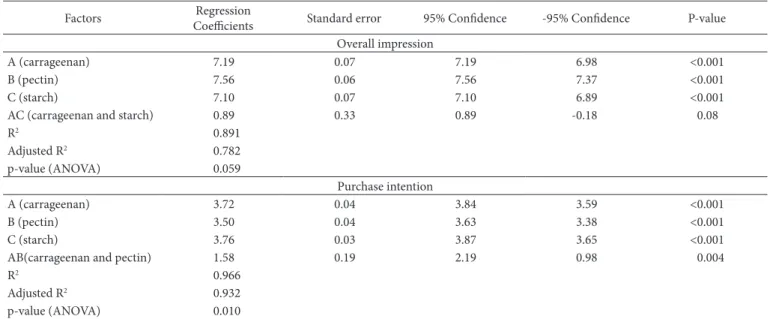
Regarding the criterion of significant differences of the concentration of thickener in the responses (p<0.05), the following variables underwent multiple regression analysis: instrumental viscosity (apparent viscosity); overall impression; and purchase intention. The regression coefficients, standard error, ±95% confidence interval and significance of the models (p-values) are shown in Table 4.
Regarding instrumental viscosity (apparent viscosity), the proposed mathematical model was not significant (p=0.876) and only a small part of the data variance was explained (R2 = 0.076),
thus, showing that this parameter could not be properly explained (modeled) by the experimental results.
For overall impression, the model was significant (p=0.059) and explained the experimental data well (R2=0.891, R2
adjus= 0.782), showing the RSM model was robust in explaining the factors on the sensory attribute. Regarding the effects of the stabilizers, pectin, carrageenan, and starch considerably (p < 0.0001) contributed to an increase in the mean value of the overall impression. The interaction between carrageenan and starch was not statistically significant in the overall impression of the beverages (p=0.08).
Regarding the purchase intention, the values generated by the adjusted mathematical model explained about 97% of the data variance, with R2=0.966, R2
adjus=0.932 and p=0.010. The analysis showed that all stabilizers influenced positively the purchase intention of beverages, while the interaction between carrageenan and pectin also contributed significantly to the increase in the average of the purchase intention (p=0.004).
The contradiction between liking a formulation and buying another occurs because liking a product does not necessarily mean intending to buy it. Consumption involves private habits, as well as non-sensory issues such as availability in retail shops, promotions and advertisements. Food selection and consumption is a complexed process influenced, mainly, by sensorial factors, but other factors related to marketing, convenience, brand, price, health and nutrition concern, curiosity and psychological stuffs are also important (Guerrero et al., 2010).
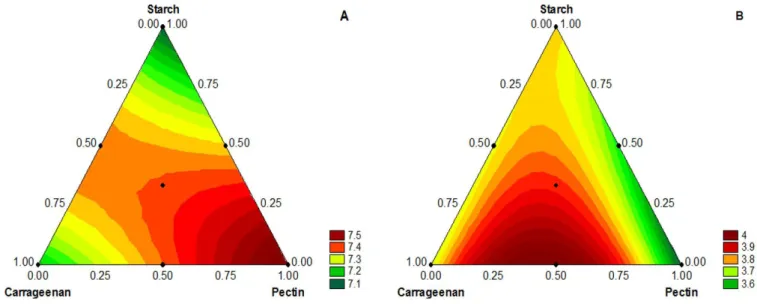
For the future development of mixed beverages with whey and water-soluble soybean extract, the results of this study make it possible to preview the mean values and confidence intervals of overall impression and purchase intention by using the multiple regression equations shown in Table 4. The data relating to the multiple regression analysis can be better observed in Figure 1, which shows the contour plots for overall impression (1A)
Table 4. Regression coefficients, standard error, ±95% confidence limits, and significance of the generated regression models.
Factors Regression
Coefficients Standard error 95% Confidence -95% Confidence P-value Dverall impression
A (carrageenan) 7.19 0.07 7.19 6.98 <0.001
B (pectin) 7.56 0.06 7.56 7.37 <0.001
C (starch) 7.10 0.07 7.10 6.89 <0.001
AC (carrageenan and starch) 0.89 0.33 0.89 -0.18 0.08
R2 0.891
Adjusted R2 0.782
p-value (ANDVA) 0.059
Purchase intention
A (carrageenan) 3.72 0.04 3.84 3.59 <0.001
B (pectin) 3.50 0.04 3.63 3.38 <0.001
C (starch) 3.76 0.03 3.87 3.65 <0.001
AB(carrageenan and pectin) 1.58 0.19 2.19 0.98 0.004
R2 0.966
Adjusted R2 0.932
and purchase intention (1B) of the developed beverages according to different mixtures of stabilizers.
3.4 Multi-response optimization
Dptimization made it possible to assess the optimal point of the concentrations of carrageenan, pectin and starch to be predicted in relation to the responses (i.e., overall impression and purchase intention). The mean values of the concentrations
proposed by the model were calculated by the desirability function. Figure 2 shows the profile of the predicted and desirable values of the stabilizers obtained by the desirability function.
The simultaneous optimization of the response variables showed that the ideal formulation should contain 46% carrageenan, 54% pectin (red dashed lines), with a desirability index (d-value) of 0.92. From the analysis shown in Figure 2, which was based on 95% confidence interval, this formulation,
Figure 1. Response surface plots obtained by experimental model for overall impression (A) and purchase intention (B).
when tested, should obtain a minimum score of 7.13, a mean score of 7.48 and a maximum score of 7.84 for overall impression. Regarding purchase intention, the formulation should obtain a minimum score of 3.87, a mean score of 3.99 and a maximum score of 4.11. The right column shows the minimum, mean and maximum values in the desirability function.
To examine the quality of the model, the optimized formulation was subjected to sensory analysis by 92 untrained panelists. The experimental data were compared to the minimum values proposed by the model through the one-sample t-test. The mean value was 7.11 ± 1.09, t-value=-0.19 and p=0.85 for overall impression and the values for purchase intention were 3.99 ±.28, t-value=0.88 and p=0.37, thus showing that the proposed model was predictive. This result is of interest for food companies because the optimization of a mixture of thickeners was based on a sensory analysis that used untrained consumers as panelists.
4 Conclusions
All the formulations were accepted by the panelists with averages above seven in the hedonic scale, and above 3.5 in the attitude scale, which demonstrates that the combination of whey and water-soluble soybean extract, with the addition of chocolate flavor, is an excellent potential new product. The presence of carrageenan contributed to the increase in apparent viscosity; however, the most accepted formulations were those that had lower apparent viscosity and pectin in their formulation. Starch did not impacted significantly in the rheological and sensory characteristics of the product. Dverall, the panelists preferred chocolate milk that was less viscous. RSM was successfully used to optimize the combination of different thickeners added in the beverage and the best formulation should contain 46% carrageenan and 54% pectin.
Acknowledgements
We gratefully acknowledge the financial support of CAPES/Brazilian Ministry of Education. D. Granato acknowledges CNPq for a productivity grant (process 303188/2016-2).
References
Amaral, G. V., Silva, E. K., Cavalcanti, R. N., Martins, C. P. C., Andrade, L. G. Z. S., Moraes, J., Alvarenga, V. D., Guimarâes, J. T., Esmerino, E. A., Freitas, M. Q., Silva, M. C., Raices, R. S. L., Sant’Ana, A. S., Meireles, M. A. A., & Cruz, A. G. (2018). Whey-grape juice drink processed by supercritical carbon dioxide technology: Physicochemical characteristics, bioactive compounds and volatile profile. Food Chemistry, 239, 697-703. PMid:28873624. http://dx.doi.org/10.1016/j. foodchem.2017.07.003.
Andrés, V., Villanueva, M. J., & Tenorio, M. D. (2014). Simultaneous determination of tocopherols, retinol, ester derivatives and β-carotene in milk-and soy-juice based beverages by HPLC with diode-array detection. Lebensmittel-Wissenschaft + Technologie, 58(2), 557-562. http://dx.doi.org/10.1016/j.lwt.2014.03.025.
Association of Dfficial Analytical Chemists – ADAC. (2002). Official methods of analysis of AOAC International (17th ed.). Gaithersburg: ADAC.
Banaszewska, A., Cruijssen, B., Van Der Vorst, J. G. A. J., Claassen, G. D. H., & Kampman, J. L. (2013). A comprehensive dairy valorization model. Journal of Dairy Science, 96(2), 761-779. PMid:23200469. http://dx.doi.org/10.3168/jds.2012-5641.
Barbosa, B. T., Rodrigues, J. F., & Bastos, S. B. (2017). Sensory optimization of nutritionally enriched strawberry yogurt. British Food Journal, 119(2), 301-310. http://dx.doi.org/10.1108/BFJ-08-2016-0370. Brasil. (2001). Technical Regulation on Microbiological Standards for
Food (Resolution RDC, n.12, 02 January 2001). Diário Oficial [da] República Federativa do Brasil.
Castro, W. F., Cruz, A. G., Bisinotto, M. S., Guerreiro, L. M. R., Faria, J. A. F., Bolini, H. M. A., Cunha, L. R., & Deliza, R. (2013). Development of probiotic dairy beverages: rheological properties and application of mathematical models in sensory evaluation. Journal of Dairy Science, 96(1), 16-25. PMid:23102956. http://dx.doi.org/10.3168/ jds.2012-5590.
Childs, J. L., Yates, M. D., & Drake, M. A. (2007). Sensory properties of meal replacement bars and beverages made from whey and soy proteins. Journal of Food Science, 72(6), 5425-5434. PMid:17995701. http://dx.doi.org/10.1111/j.1750-3841.2007.00429.x.
Della Lucia, F., Carmo, J. B., Morais, C. S. N., Nunes, C. A., Pinheiro, A. C. M., Ferreira, E. B., Pinto, S. M., Abreu, L. R., & Vilas Boas, E. V. B. (2016). Physicochemical and sensory quality of several comercial Brazilian chocolate milk beverages. International Journal of Dairy Technology, 69(3), 364-371. http://dx.doi.org/10.1111/1471-0307.12267. Derringer, G., & Suich, R. (1980). Simultaneous optimization of several
response variables. Journal of Quality Technology, 12, 214-219. Drunkler, N. L., Leite, R. S., Mandarino, J. M., Oda, E. O., & Demiate, O.
M. (2012). Cassava starch as a stabilizer of soy-based beverages. Food Science & Technology International, 18(5), 489-499. PMid:23144242. http://dx.doi.org/10.1177/1082013211433072.
Gad, S. A., Ermam, H. W., Mohamed, F. G., & Sayd, F. A. (2013). Utilization whey in production of functional healthy beverage “whey-mango beverages”. American Journal of Food Technology, 8, 133-148. http://dx.doi.org/10.3923/ajft.2013.133.148.
Granato, D., Calado, V. M. A., & Jarvis, B. (2014). Dbservations on the use of statistical methods in food science and technology. Food Research International, 55, 137-149. http://dx.doi.org/10.1016/j. foodres.2013.10.024.
Guerrero, L., Colomer, Y., Guàrdia, M. D., Xicola, J., & Clotet, R. (2010). Consumer attitude towards store brands. Food Quality and Preference, 11(5), 387-395. http://dx.doi.org/10.1016/S0950-3293(00)00012-4. Guo, X., Zhao, W., Pang, X., Liao, X., Hu, X., & Wu, J. (2014). Emulsion stabilizing properties of pectins extracted by high hydrostatic pressure, high-speed shearing homogenization and traditional thermal methods: a comparative study. Food Hydrocolloids, 35, 217-225. http://dx.doi.org/10.1016/j.foodhyd.2013.05.010. Haiti, S., Patel, N., Patel, K., & Prajapati, J. B. (2017). Ompact of whey
protein concentrate on proteolytic lactic cultures for the production of isoflavones during fermentation of soy milk. Journal of Food Processing and Preservation, 1-9. http://dx.doi.org/10.1111/jfpp.13287. He, F., & Chen, Q. J. (2013). Consumption of soybean, soy foods, soy isoflavones and breast cancer incidence: differences between Chinese women and women in Western countries and possible mechanisms. Food Science and Human Wellness, 2(3-4), 146-161. http://dx.doi. org/10.1016/j.fshw.2013.08.002.
233, 401-411. PMid:28530591. http://dx.doi.org/10.1016/j. foodchem.2017.04.112.
Kwon, D. Y., Hong, S. M., Ahn, S., Kim, M. J., Yang, H. J., & Park, S. (2011). Osoflavonoids and peptides from meju, long-term fermented soybeans, increase insulin sensitivity and exert insulinotropic effects in vitro. Nutrition (Burbank, Los Angeles County, Calif.), 27(2), 244-252. PMid:20541368. http://dx.doi.org/10.1016/j.nut.2010.02.004. Lawless, H. T., & Heymann, H. (1999). Sensory evaluation of food:
principles and practices. Gaithersburg: Aspen Publishers, Onc. Lee, W. J., & Lucey, J. A. (2010). Formation and physical properties of
yogurt. Asian-Australasian Journal of Animal Sciences, 23(9), 1127-1136. http://dx.doi.org/10.5713/ajas.2010.r.05.
Leite, T. D., Nicoleti, J. F., Penna, A. L. B., & Franco, C. M. L. (2012). Effect of addition of different hydrocolloids on pasting, thermal, and rheological properties of cassava starch. Ciência e Tecnologia de Alimentos, 32, 579-587.
Li, J. M., & Nie, S. P. (2016). The functional and nutritional aspects of hydrocolloids in foods (2016). Food Hydrocolloids, 53, 46-61. http:// dx.doi.org/10.1016/j.foodhyd.2015.01.035.
Luiz, L. M. P., Rocha, J. C. G., Sá, J. P. N., Brandão, S. C. C., Araújo, E. A., & Carvalho, A. F. (2014). Room-temperature preservation of a hot-filled cheese whey beverage. Ciência Rural, 44, 2090-2094. http://dx.doi.org/10.1590/0103-8478cr20130647.
Ma, L., Li, B., Han, F., Yan, S., Wang, L., & Sun, J. (2015). Evaluation of the chemical quality traits of soybean seeds, as related to sensory attributes of soymilk. Food Chemistry, 173, 694-701. PMid:25466078. http://dx.doi.org/10.1016/j.foodchem.2014.10.096.
Madruga, M. S., Albuquerque, F. S. M., Silva, O. R. A., Amaral, D. S., Magnani, M., & Queiroga, V. No. (2014). Chemical, morphological and functional properties of Brazilian jackfruit (Artocarpus heterophyllus L.) seeds starch. Food Chemistry, 143, 440-445. PMid:24054264. http://dx.doi.org/10.1016/j.foodchem.2013.08.003.
Maity, T. K., Kumar, R., & Misra, A. K. (2008). Development of healthy whey drink with Lactobacillus rhanmosus, Bifidubacterium bifidum and Propionibacterium freudenreichii. Advance Journal of Food Science & Technology, 58, 315-325.
Mann, B., Kumari, A., Kumar, R., Sharma, R., Prajapati, K., Mahboob, S., & Athira, S. (2015). Antioxidant activity of whey protein hydrolysates in milk beverage system. Journal of Food Science and Technology, 52(6), 3235-3241. PMid:26028704.
Marafon, A. P., Sumi, A., Alcântara, M. R., Tamime, A. Y., & Dliveira, M. N. (2011). Dptimization of the rheological properties of probiotic yoghurts supplemented with milk proteins. Food Science and Technology, 44, 511-519.
Moura, J. S., Sá, N. C., Menezes, E., & Melo, L. (2016). Effect of institutional sensory test location and consumer attitudes on acceptance of foods and beverages having different levels of processing. Food Quality and Preference, 48, 262-267. http://dx.doi.org/10.1016/j. foodqual.2015.10.002.
Nam, S. H., Wagh, A., Martini, S., & Walsh, M. K. (2017). Sensory characterization of a high-protein beverage. International Journal of Dairy Technology, 70(3), 432-438. http://dx.doi.org/10.1111/1471-0307.12362.
Nguyen, Q., Hettiarachchy, N., Rayaprolu, S., Seo, H., Horax, R., Chen, P., & Kumar, T. K. S. (2016). Protein-rich beverage developed using non-GM soybean (R08-4004) and evaluated for sensory acceptance and shelf life. Journal of Food Science and Technology, 53(8), 3271-3281. PMid:27784921. http://dx.doi.org/10.1007/s13197-016-2302-0.
Nikaedo, P. H. L., Amaral, F. F., & Penna, A. L. B. (2004). Technological characterization of creamy chocolate-dairy desserts prepared with whey protein concentrate and mixtures of carrageenan and guar gums. Brazilian Journal of Pharmaceutical Sciences, 40, 397-404. Dsawa, C. C., Ferrari, C. C., Siqueira, P. B., Brito, C. A. K., Sanvido,
G. B., Botelho, A. P., Alves, L. R., Cadoso, C. F., Moais, V. H. F., Melo, L. L. M. M., Ribeiro, A. P. B., & Bolini, H. M. A. (2008). Avaliação do perfil sensorial de chá light sabor pêssego. Ciência e Tecnologia de Alimentos, 28, 102-108. http://dx.doi.org/10.1590/ S0101-20612008000500017.
Dspina, M. M., Sepulveda, J. U., Restrepo, D. A., Cabrera, K. R., & Suarez, H. (2012). Onfluence of gum xanthan and guar on the rheological properties of cocoa-flavored milk beverage. Biotecnologia en el Sector Agropecuario y Agroindustrial, 10, 51-59.
Pescuma, M., Hébert, E. M., Mozzi, F., & Valdez, G. F. (2010). Functional fermented whey-based beverage using lactic acid bacteria. International Journal of Food Microbiology, 141(1-2), 73-81. PMid:20483186. http://dx.doi.org/10.1016/j.ijfoodmicro.2010.04.011.
Prazeres, A. R., Carvalho, F., & Rivas, J. (2012). Cheese whey management: a review. Journal of Environmental Management, 110, 48-68. PMid:22721610. http://dx.doi.org/10.1016/j.jenvman.2012.05.018. Ren, G., Yi, S., Zhang, H., & Wang, J. (2017). Ongestion of soy–whey blended protein augments sports performance and ameliorates exercise-induced fatigue in a rat exercise model. Food & Function, 8(2), 670-679. PMid:28121323. http://dx.doi.org/10.1039/C6FD01692H. Rivas, J., Prazeres, A. R., & Carvalho, F. (2011). Aerobic biodegradation of precoagulated cheese whey wastewater. Journal of Agricultural and Food Chemistry, 59(6), 2511-2517. PMid:21348495. http://dx.doi. org/10.1021/jf104252w.
Rodriguez-Roque, M. J., Rojas-Graü, M. A., Elez-Martínez, P., & Martín-Bellozo, D. (2014). In vitro bioaccessibility of health-relates compounds from a blended fruit juice-soymilk beverage: Onfluence of the food matrix. Journal of Functional Foods, 7, 161-169. http:// dx.doi.org/10.1016/j.jff.2014.01.023.
Singh, A. K., & Singh, K. (2012). Utilization of whey for the production of instant energy beverage by using response surface methodology. Advance Journal of Food Science & Technology, 4, 103-111. Tranjan, B. C., Cruz, A. G., Walter, E. H. M., Faria, J. A. F., Bolini, H.
M. A., Moura, M. R., & Carvalho, L. M. J. (2009). Development of goat cheese whey-flavoured beverages. International Journal of Dairy Technology, 62(3), 438-443. http://dx.doi.org/10.1111/j.1471-0307.2009.00491.x.
Trigueros, D. E. G., Fiorese, M. L., Kroumov, A. D., Hinterholz, C. L., Nadai, B. L., & Assunção, G. M. (2016). Medium optimization and kinetics modeling for the fermentation of hydrolyzed cheese whey permeate as a substrate for Saccharoyces cerevisae var. boulardii. Biochemical Engineering Journal, 110, 71-83. http://dx.doi.org/10.1016/j. bej.2016.02.014.
Uliana, R. T. M., & Venturini, W. G. Fo., & Uliana, L. T. (2012). Acceptance testing mixed drink soy and blackberry. Brazilian Journal of Food Technology, 15, 174-181. http://dx.doi.org/10.1590/ S1981-67232012005000002.
Vaclavick, V. A., & Christian, E. W. (2014). Essentials of food science (4th ed.). New York: Springer.