Original article
RBAFS
Atividade Física & Saúde SOCIEDADE BRASILEIRA DE ATIVIDADE FÍSICA E SAÚDE Brazilian Journal of Physical Activity and Health
RBAFS
Revista Brasileira de Atividade Física & Saúde SOCIEDADE BRASILEIRA DE ATIVIDADE FÍSICA E SAÚDE Brazilian Journal of Physical Activity and Health
RBAFS
Revista Brasileira de Atividade Física & Saúde SOCIEDADE BRASILEIRA DE ATIVIDADE FÍSICA E SAÚDE
Brazilian Journal of Physical Activity and Health
Rev Bras Ativ Fis Saúde p. 554-565
DOI:
http://dx.doi.org/10.12820/rbafs.v.18n5p554
1 Postgraduate Program in Epidemiology, Federal University of Pelotas, Brazil. 2 Postgraduate Program in Physical Education, Federal University of Pelotas, Pelotas, Brazil. GEEAF - Physical Activity Epidemiology Research Group.
School and individual-level correlates of
physical activity in children: a multilevel
approach
Determinantes individuais e do contexto
escolar na atividade física de crianças:
um estudo multinível
Marcos Britto Correa1
Kelly Cordeira1
Margarete Oleiro Marques2
Marlos Rodrigues Domingues2
Flávio Fernando Demarco1
Pedro Curi Hallal1, 2
Abstract
This study aimed to assess the association between individual and school environment vari-ables and physical activity levels in Brazilian schoolchildren with 8-12 years of age. A sample of children from 20 private and public schools (n=1,210) was selected. Total and leisure-time physical activities and active transportation to school (AT) were measured using a self-report instrument. Total and leisure-time physical inactivity (PI) were defined as <300min/week of Physical activity. Physical and social school environment features were assessed through a questionnaire. The prevalence of PI, leisure-time PI, and AT to school were 69.2%, 75.8% and 70.5%, respectively. Multilevel models showed that PI was more frequent among girls, and was negatively associated with older age and higher maternal schooling. Girls were more inactive during leisure-time. For contextual variables, greater Physical Education teacher/student ratio was associated with lower levels of both total and leisure-time PI. AT was negatively associated with higher income and positively associated with older age. Students from public schools use more AT. Based on the prevalence of PI found, strategies focused at increasing physical activity levels should be implemented immediately. Also, our findings suggest that both individual and school contextual variables were associated with levels of PI, varying between domains.
Keywords
Social Environments, Epidemiology, Physical Education, Physical Activity. Resumo
Este estudo objetivou avaliar a associação entre variáveis individuais e do contexto escolar com os níveis de atividade física em escolares de 8 a 12 anos de idade. Uma amostra de crianças de 20 escolas públicas e privadas (n=1210) foi selecionada. Os níveis de atividade física total e no lazer e o trans-porte ativo para a escola foram mensurados por meio de um instrumento validado. Crianças foram con-sideradas inativas quando realizavam <300min/semana de atividade física. O ambiente social e físico escolar foi avaliado através de questionário. As prevalências de Inatividade Física (IF), IF no lazer e transporte ativo foram de 69,2%, 75,8% e 70,5%, respectivamente. Modelos de análise multinível mostraram que a IF total esteve associada ao sexo feminino e negativamente associada com o aumento da idade e a maior escolaridade materna. As meninas também foram mais inativas no lazer. Das variáveis contextuais, o aumento da razão Professor de Educação Física/aluno foi associado a menores níveis de IF total e de lazer. O transporte ativo à escola esteve negativamente associado com a maior renda e aumentou com o aumento da idade e em alunos de escolas públicas. Com base nos resultados, estratégias focadas no aumento dos níveis de atividade física entre as crianças devem ser implementadas imediatamente. Ainda, nossos achados sugerem que tanto variáveis individuais como contextuais estão associadas com os níveis de inatividade física, variando entre seus domínios.
Palavras-chave
IntRoductIon
Physical activity practice in childhood and adolescence provides both short- and long-term benefits for physical and mental health 1,2. Global recommendations to promote regular physical activity (PA), including aerobic, strength, and flexibility exercises have been established 3. However, around 4/5 of the adolescents aged 13-15 years of age are not meeting these recommendations 4. Further, there is evi-dence that some indicators of PA, such as participation in physical education (PE) classes, are decreasing over time 5. Therefore, increasing PA levels of adolescents worldwide has become an important public health priority.
The understanding of factors that affect PA behaviours is important in devel-oping interventions. Previous research has primarily focused on identifying indi-vidual level correlates of PA6,7, and there is evidence that correlates vary according to the domains of PA investigated8-10. However, studies focusing solely on individ-ual correlates fail to account for the multiple levels of influence on behaviour, such as those presented in the ecological model 8.
For youth, most of physical activities occur at home, school, and neighbour-hoods. Therefore, it is likely that factors of these levels may interact with individ-ual characteristics influencing PA patterns. Because most children attend school and spend a considerable amount of the day at school, contextual factors, such as school structure and environment, might play a role. School structures, such as large school campuses, school buildings, and play areas (per enrolled student) have been associated with higher levels of PA among youth and the availability of school play equipment, facilities, and after-school programs, fields, and courts are important correlates of PA11.
This study examines individual and school-related contextual correlates of PA in a representative sample of schoolchildren from the city of Pelotas, Brazil.
Methods
This cross-sectional study was performed in Pelotas, a southern Brazilian city. The city has approximately 320,000 inhabitants of which 26,000 are children aged 8-12 years. A two-stage cluster sample design was adopted. There are 25 private and 91 public schools in Pelotas that serve children within this age range. To ensure proportionality, five private and 15 public schools were randomly selected, using a probability proportional to school size. In each school, five classrooms, from 2nd to 6th grade were randomly selected and all children enrolled in these classes were initially eligible for the study. Physically and/or mentally disabled children were not included. More details about the methodology of this study are available elsewhere12.
The research team visited the schools in 2010 to carry out data collection. Schools were visited as many times as needed so that the children absenteeism was restricted to no more than 10%. Data collection included a questionnaire sent to parents via children, an interview with children, anthropometric measurements and an assessment of the schools’ social and physical environment.
Information on lifestyle was collected using a previously validated PA ques-tionnaire 13. The questionnaire addressed commuting to-and-from school and lei-sure-time physical activities. It comprised questions on transport-related PA and a box with a list of leisure-time activities. Active transportation to school was
considered when child reported going to school walking or by cycling. Level of total and leisure-time PA was classified as insufficient if students participated in less than 300 min/week of PA.
Socioeconomic data were obtained from parents. Maternal education level was evaluated in years of formal education and categorized in four groups (up to 4 years; 5 to 8; 9 to 11; and 12 or more years). Family income was collected in Bra-zilian Reals (BRL). Information on number of people living in the house was also collected. Per capita family income was obtained dividing the income of the family by the number of people living in their house and then, was divided into quartiles. Height was measured to the nearest 0.1 cm with a portable stadiometer, and weight was measured in light clothing and no shoes on to the nearest 0.1 kg on a digital scale. Body Mass Index (BMI) was calculated as weight (kg) divided by squared height (m2). Participants were classified as normal, overweight or obese according to sex- and age-specific BMI cut-off points14.
Structure of PE class and availability of physical structures to practice sports in schools was evaluated using a questionnaire completed by PE teachers. The questionnaire included closed questions about the number of PE teachers in the school, indoor facilities (courts and gyms), and other equipment that could be used during activities. The questionnaire was pre-tested with professionals that were not included in the sample. No alterations were performed in the final ver-sion. PE teacher/student ratio was obtained dividing the number of PE teach-er of the school by the total numbteach-er of students in the school and categorized into tertiles. The variable Physical Structure was obtained by Principal Component Analysis (PCA) performed with the following data obtained by questionnaire:: 1) number of courts; 2) number of sports markings in the courts; 3) presence of indoor courts; 4) condition of the courts reported by the PE teacher; 5) number of different equipments for sports practice (balls for different sports, volleyball nets, basketball table, equipment for gymnastics and athletics); 6) availability of the school structure for sports practice after school. The scores obtained from PCA were categorized into tertiles.
The social environment was assessed by a questionnaire based on the
Nation-al Survey of Students’ HeNation-alth (PeNSE)15 administered to school coordinators. It contains questions addressing topics about violence, alcohol, drugs, and tobacco. To summarize information collected, PCA analysis was performed to create two variables: 1) Violence; and 2) Alcohol/Drugs and Tobacco. The variable Violence considered data about school security, presence and type of fencing around the school, need for police security, occurrence of acts of violence – physical, verbal, bullying - and vandalism between students or against the school population or structure, existence of gangs and episodes involving fire arms. The variable alcohol/
drugs/tobacco took in account the existence of episodes of use of these substances
in the ambient of school by students, teachers and staff, the presence of these themes in the school curriculum and the existence of policies against tobacco use in the school. For both variables, schools were divided into tertiles with the scores obtained in PCA, sorted from less to more prone conditions for sports practice.
Data were entered twice in an EpiData (The EpiData Association, Odense, Denmark) database with automatic checks for consistency and range. Data anal-yses were carried out in Stata 11.0 (StataCorp, College Station, TX, USA). De-scriptive statistics were used to characterize the sample by outcomes and inde-pendent variables. Multilevel Logistic Regression analysis using scheme of mixed
effects was used in order to assess the association of independent variables with the outcomes considering two levels of organization: Level 1 – Individual-level vari-ables and; Level 2 – School-Level Varivari-ables. The odds ratio and 95% confidence intervals were estimated. Model selection was carried out using deviance-based significance testing. The final models were adjusted from both individual and con-textual level variables. To be included in the final model, variables should present a p value ≤0.250 after adjustments.
The project was approved by the Human Ethics Research Committee of Fed-eral University of Pelotas and by the Education Departments. All children re-ceived a letter, explaining parents the aims of the study, ensuring confidentiality and requesting their authorization.
Results
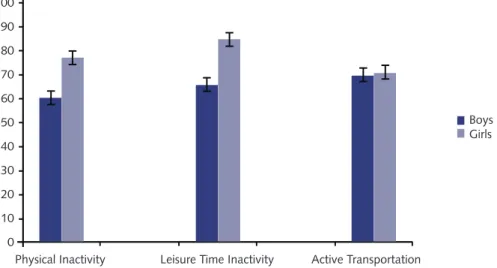
Table 1 shows the descriptive analysis of the sample. The prevalence of physical in-activity (69.2%), leisure-time physical inin-activity (75.8%), and active transportation to school (70.5%) are displayed. Girls presented a greater prevalence of physical inactivity and leisure-time physical inactivity, but no differences were found in active transportation (Figure 1).
Figure 1 – Percentage of physical inactivity according to sex in Brazilian schoolchildren (8-12 years). Pelotas, Brazil.
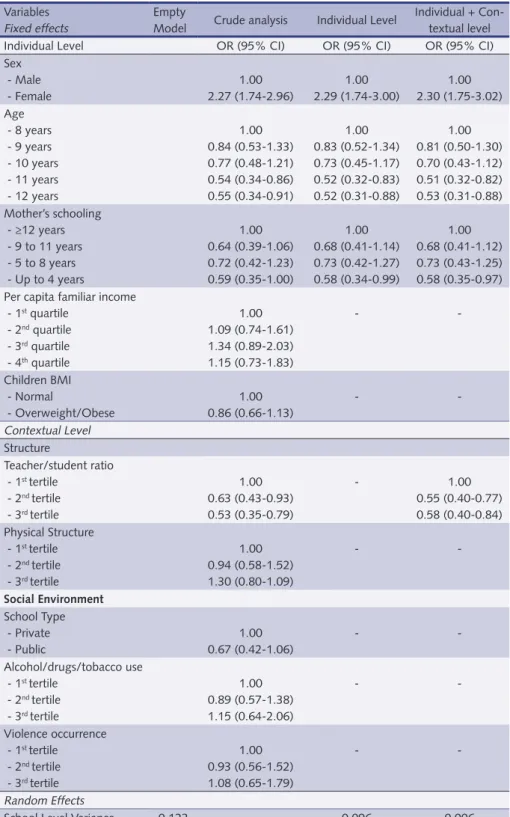
The results of factors associated with physical inactivity are shown in Table 2. The model including individual and contextual level variables revealed that girls are less active [OR 2.30 (1.75-3.02)]. It was also found that older children [OR 0.53 (0.31-0.88)] and children from mothers with lower education [OR 0.58 (0.35-0.97)] presented a protective effect to this outcome. For school-level vari-ables, PE teacher/student ratio was associated with physical inactivity. Students from schools with more PE teachers per student were negatively associated with physical inactivity [OR 0.58 (0.40-0.84)].
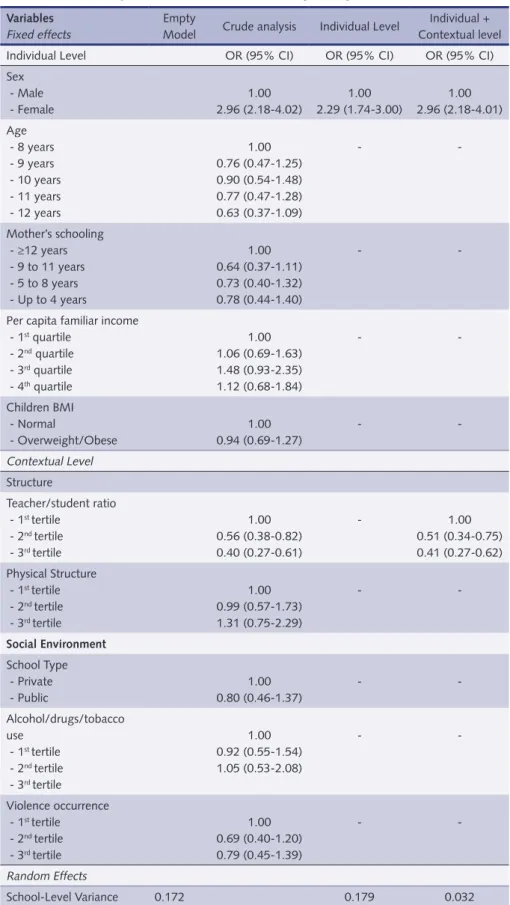
Gender was also associated with physical inactivity in leisure time (Table 3). Girls were more prone to physical inactivity in leisure-time [OR 2.96 (2.18-4.01] than boys. In addition, greater PE teacher/student ratio had a protective effect for this outcome [OR 0.41 (0.27-0.62)].
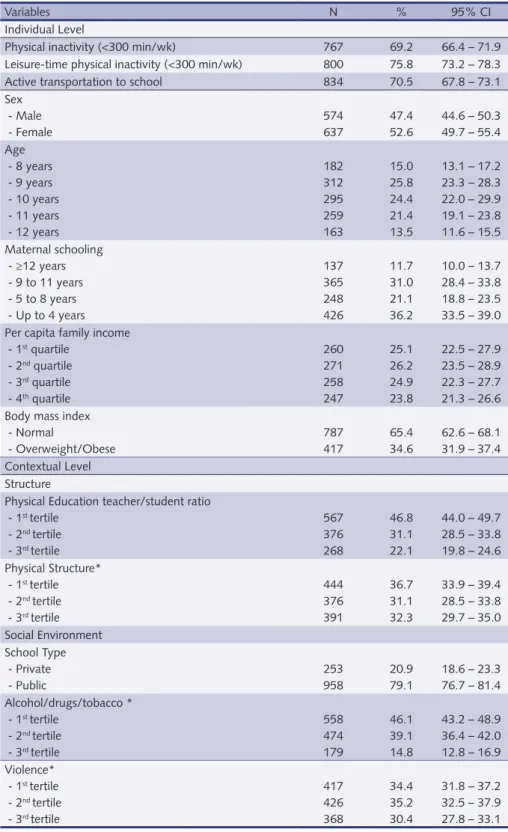
table 1 – Description of the sample by individual and contextual variables. Pelotas, Brazil.
Variables N % 95% CI
Individual Level
Physical inactivity (<300 min/wk) 767 69.2 66.4 – 71.9 Leisure-time physical inactivity (<300 min/wk) 800 75.8 73.2 – 78.3 Active transportation to school 834 70.5 67.8 – 73.1 Sex - Male - Female 574 637 47.4 52.6 44.6 – 50.3 49.7 – 55.4 Age - 8 years - 9 years - 10 years - 11 years - 12 years 182 312 295 259 163 15.0 25.8 24.4 21.4 13.5 13.1 – 17.2 23.3 – 28.3 22.0 – 29.9 19.1 – 23.8 11.6 – 15.5 Maternal schooling - ≥12 years - 9 to 11 years - 5 to 8 years - Up to 4 years 137 365 248 426 11.7 31.0 21.1 36.2 10.0 – 13.7 28.4 – 33.8 18.8 – 23.5 33.5 – 39.0 Per capita family income
- 1st quartile - 2nd quartile - 3rd quartile - 4th quartile 260 271 258 247 25.1 26.2 24.9 23.8 22.5 – 27.9 23.5 – 28.9 22.3 – 27.7 21.3 – 26.6 Body mass index
- Normal - Overweight/Obese 787 417 65.4 34.6 62.6 – 68.1 31.9 – 37.4 Contextual Level Structure
Physical Education teacher/student ratio - 1st tertile - 2nd tertile - 3rd tertile 567 376 268 46.8 31.1 22.1 44.0 – 49.7 28.5 – 33.8 19.8 – 24.6 Physical Structure* - 1st tertile - 2nd tertile - 3rd tertile 444 376 391 36.7 31.1 32.3 33.9 – 39.4 28.5 – 33.8 29.7 – 35.0 Social Environment School Type - Private - Public 253 958 20.9 79.1 18.6 – 23.3 76.7 – 81.4 Alcohol/drugs/tobacco * - 1st tertile - 2nd tertile - 3rd tertile 558 474 179 46.1 39.1 14.8 43.2 – 48.9 36.4 – 42.0 12.8 – 16.9 Violence* - 1st tertile - 2nd tertile - 3rd tertile 417 426 368 34.4 35.2 30.4 31.8 – 37.2 32.5 – 37.9 27.8 – 33.1 * Variables obtained by PCA analysis.
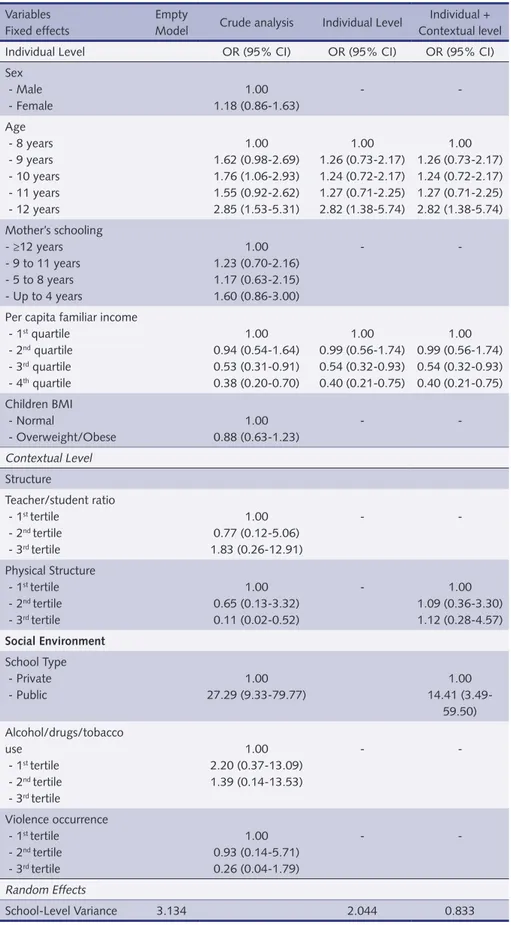
Table 4 illustrates the results of multilevel analysis for active transportation. Older children were more likely to use active means of transport to school [OR 2.82 (1.38-5.74)] than younger children and children from families with greater per capita income were negatively associated with active transportation [OR 0.40 (0.21-0.75)]. Schools with better condition for sports practice showed a
protec-tive effect for acprotec-tive transportation in crude analysis but this association was not observed after controlling for confounders (individual level variables and type of school). Children from public schools were more active during transportation compared to children from private schools [OR 14.41 (3.49-59.50)]. None of the variables generated by PCA analysis (violence, alcohol/drugs/tobacco, physical structure) were associated with the three outcomes used in this study.
table 2 – Association of individual and contextual characteristics with physical inactivity in school-children (8-12 years). Pelotas, Brazil. Multilevel Logistic Regression.
Variables Fixed effects
Empty
Model Crude analysis Individual Level
Individual + Con-textual level Individual Level OR (95% CI) OR (95% CI) OR (95% CI) Sex - Male - Female 1.00 2.27 (1.74-2.96) 1.00 2.29 (1.74-3.00) 1.00 2.30 (1.75-3.02) Age - 8 years - 9 years - 10 years - 11 years - 12 years 1.00 0.84 (0.53-1.33) 0.77 (0.48-1.21) 0.54 (0.34-0.86) 0.55 (0.34-0.91) 1.00 0.83 (0.52-1.34) 0.73 (0.45-1.17) 0.52 (0.32-0.83) 0.52 (0.31-0.88) 1.00 0.81 (0.50-1.30) 0.70 (0.43-1.12) 0.51 (0.32-0.82) 0.53 (0.31-0.88) Mother’s schooling - ≥12 years - 9 to 11 years - 5 to 8 years - Up to 4 years 1.00 0.64 (0.39-1.06) 0.72 (0.42-1.23) 0.59 (0.35-1.00) 1.00 0.68 (0.41-1.14) 0.73 (0.42-1.27) 0.58 (0.34-0.99) 1.00 0.68 (0.41-1.12) 0.73 (0.43-1.25) 0.58 (0.35-0.97) Per capita familiar income
- 1st quartile - 2nd quartile - 3rd quartile - 4th quartile 1.00 1.09 (0.74-1.61) 1.34 (0.89-2.03) 1.15 (0.73-1.83) - -Children BMI - Normal - Overweight/Obese 1.00 0.86 (0.66-1.13) - -Contextual Level Structure Teacher/student ratio - 1st tertile - 2nd tertile - 3rd tertile 1.00 0.63 (0.43-0.93) 0.53 (0.35-0.79) - 1.00 0.55 (0.40-0.77) 0.58 (0.40-0.84) Physical Structure - 1st tertile - 2nd tertile - 3rd tertile 1.00 0.94 (0.58-1.52) 1.30 (0.80-1.09) - -Social Environment School Type - Private - Public 1.00 0.67 (0.42-1.06) - -Alcohol/drugs/tobacco use - 1st tertile - 2nd tertile - 3rd tertile 1.00 0.89 (0.57-1.38) 1.15 (0.64-2.06) - -Violence occurrence - 1st tertile - 2nd tertile - 3rd tertile 1.00 0.93 (0.56-1.52) 1.08 (0.65-1.79) - -Random Effects
table 3 – Association of individual and contextual characteristics with leisure-time physical inactivity in schoolchildren (8-12 years). Pelotas, Brazil. Multilevel Logistic Regression.
Variables
Fixed effects
Empty
Model Crude analysis Individual Level
Individual + Contextual level Individual Level OR (95% CI) OR (95% CI) OR (95% CI) Sex - Male - Female 1.00 2.96 (2.18-4.02) 1.00 2.29 (1.74-3.00) 1.00 2.96 (2.18-4.01) Age - 8 years - 9 years - 10 years - 11 years - 12 years 1.00 0.76 (0.47-1.25) 0.90 (0.54-1.48) 0.77 (0.47-1.28) 0.63 (0.37-1.09) - -Mother’s schooling - ≥12 years - 9 to 11 years - 5 to 8 years - Up to 4 years 1.00 0.64 (0.37-1.11) 0.73 (0.40-1.32) 0.78 (0.44-1.40) -
-Per capita familiar income - 1st quartile - 2nd quartile - 3rd quartile - 4th quartile 1.00 1.06 (0.69-1.63) 1.48 (0.93-2.35) 1.12 (0.68-1.84) - -Children BMI - Normal - Overweight/Obese 1.00 0.94 (0.69-1.27) - -Contextual Level Structure Teacher/student ratio - 1st tertile - 2nd tertile - 3rd tertile 1.00 0.56 (0.38-0.82) 0.40 (0.27-0.61) - 1.00 0.51 (0.34-0.75) 0.41 (0.27-0.62) Physical Structure - 1st tertile - 2nd tertile - 3rd tertile 1.00 0.99 (0.57-1.73) 1.31 (0.75-2.29) - -Social Environment School Type - Private - Public 1.00 0.80 (0.46-1.37) - -Alcohol/drugs/tobacco use - 1st tertile - 2nd tertile - 3rd tertile 1.00 0.92 (0.55-1.54) 1.05 (0.53-2.08) - -Violence occurrence - 1st tertile - 2nd tertile - 3rd tertile 1.00 0.69 (0.40-1.20) 0.79 (0.45-1.39) - -Random Effects School-Level Variance 0.172 0.179 0.032
table 4 – Association of individual and contextual characteristics with active transportation to school in children (8-12 years). Pelotas, Brazil. Multilevel Logistic Regression.
Variables Fixed effects
Empty
Model Crude analysis Individual Level
Individual + Contextual level Individual Level OR (95% CI) OR (95% CI) OR (95% CI) Sex - Male - Female 1.00 1.18 (0.86-1.63) - -Age - 8 years - 9 years - 10 years - 11 years - 12 years 1.00 1.62 (0.98-2.69) 1.76 (1.06-2.93) 1.55 (0.92-2.62) 2.85 (1.53-5.31) 1.00 1.26 (0.73-2.17) 1.24 (0.72-2.17) 1.27 (0.71-2.25) 2.82 (1.38-5.74) 1.00 1.26 (0.73-2.17) 1.24 (0.72-2.17) 1.27 (0.71-2.25) 2.82 (1.38-5.74) Mother’s schooling - ≥12 years - 9 to 11 years - 5 to 8 years - Up to 4 years 1.00 1.23 (0.70-2.16) 1.17 (0.63-2.15) 1.60 (0.86-3.00) -
-Per capita familiar income - 1st quartile - 2nd quartile - 3rd quartile - 4th quartile 1.00 0.94 (0.54-1.64) 0.53 (0.31-0.91) 0.38 (0.20-0.70) 1.00 0.99 (0.56-1.74) 0.54 (0.32-0.93) 0.40 (0.21-0.75) 1.00 0.99 (0.56-1.74) 0.54 (0.32-0.93) 0.40 (0.21-0.75) Children BMI - Normal - Overweight/Obese 1.00 0.88 (0.63-1.23) - -Contextual Level Structure Teacher/student ratio - 1st tertile - 2nd tertile - 3rd tertile 1.00 0.77 (0.12-5.06) 1.83 (0.26-12.91) - -Physical Structure - 1st tertile - 2nd tertile - 3rd tertile 1.00 0.65 (0.13-3.32) 0.11 (0.02-0.52) - 1.00 1.09 (0.36-3.30) 1.12 (0.28-4.57) Social Environment School Type - Private - Public 1.00 27.29 (9.33-79.77) 1.00 14.41 (3.49-59.50) Alcohol/drugs/tobacco use - 1st tertile - 2nd tertile - 3rd tertile 1.00 2.20 (0.37-13.09) 1.39 (0.14-13.53) - -Violence occurrence - 1st tertile - 2nd tertile - 3rd tertile 1.00 0.93 (0.14-5.71) 0.26 (0.04-1.79) - -Random Effects School-Level Variance 3.134 2.044 0.833
dIscussIon
In this study, individual and contextual correlates were identified for PA in Bra-zilian youth. Individual correlates, including sex (male), age (older), and moth-er’s income (higher), and contextual correlates, including PE teacher/student ratio (higher), were associated with overall physical activity. PA in the context of leisure-time and active transportation, however, varied. Leisure-time PA was predicted by sex and PE teacher/student ratio, while active transportation was predicted by age, income, and school type. These variations suggest that there are fundamental differences by context of PA among youth in Brazil. Further, once youth PA is a function of different variables, the current study provides evidence that some contextual factors are associated with PA beyond individual-level de-mographic variables.
The PE teacher/student ratio was the only school-related variable found to be associated with overall and leisure-time PA. An increased PE teacher/student ratio was associated with a decrease in the odds of total and leisure-time inactivity. This is in accordance with findings from previous studies, which have suggested that the presence of supervisors can stimulate the practice of PA during the school day and it could have a positive effect in the learning process of children16-18. In opposite to previous reports, our study suggests an effect of PE teacher/student ratio on non-school related PA. However, since this study included all leisure-time activities inside and outside of school, the evidence is inconclusive. Although re-search is limited in this area, one recent study found that activity during PE classes could have an effect on PA inside and outside of school separately19. Collectively, these findings imply that a variable that specifically measures PA outside of school and another that measures PA during school need to be tested for an association with PE teacher/student ratio. Findings from these future studies may provide more evidence for the importance of PE class in Brazilian schools.
Physical structure of the schools has been found to impact PA; however, in this study, there was only an association with active transportation. Specific aspects of physical structures, including access to amenities20, size of play area21, access to school fields in extra times19, and other physical characteristics such as the pres-ence of gymnasium22 have been found to increase levels of PA during school hours. Nevertheless, in our study, the variable built to represent school physical structure was not associated with leisure-time or overall PA. Even though in agreement with another study’s findings23, it may imply that either the variable used in this study did not accurately capture the physical structure of the school, which influ-ences leisure-time physical activity or overall physical activity, or in reality, there is no influence from the school environment on PA in Brazilian schoolchildren. Additional studies looking at other specific physical characteristics of schools may be benefited if developing a more accurate measurement tool.
The discrepancy in leisure-time PA across gender may be related to activities offered during PE and the overall physical structure of the school. Gender was a significant determinant of behaviour for overall and leisure-time PA. Girls were half as likely to participate in PA and three times less likely to engage in lei-sure-time PA than boys. This may be related to the fact that boys are generally more likely to be motivated to engage in sporting activities while girls often need to be prompted to participate in structured, less competitive physical activities. Currently in Brazil, PE classes are not considered a priority course subject, causing
substantial declines in class time devoted to PA, availability of equipment, and teacher motivation to teach health and PA-related concepts. This has resulted in PE becoming a time for students to practice sport or to participate in free-play, which is more compatible with boys PA preferences than girls. In terms of phys-ical structure, schools that have higher availability of facilities, equipment, and space to be active may increase the opportunities for girls to participate. Space to be active may be an important factor since it allows for more than one type of activity to be occurring at the same time; thus, possibly increasing participation in activity for both girls and boys 24.
It is likely that gender differences in overall physical activity decline with in-creasing age. In this study, findings that older age (11-12) protects against overall physical inactivity were analogous to findings from another study that suggests that the gender association for physical inactivity disappears at the age of 106. This is likely due to increased independence from parents and increased physical activity outside of school, including active transportation. In this study, older schoolchildren (age 12) were almost three times more likely to participate in ac-tive transportation than younger schoolchildren (8 years) and there was no gender association. In previous studies, boys have been found to be more likely to actively commute than girls9. This discrepancy suggests that, in this study, age was more influential than gender for active transportation.
In addition to this data, attending public schools was strongly associated with active transportation to school in comparison with attending private school. Part of this association can be explained by SES, which is directly influenced by access to assets such as car and private school buses25. However, the association between attending public school and active transportation remained significant even after adjusting by SES and age. Generally, parents who enrol their children in private school are able to strategically choose the school according to quality and philos-ophy of education and the physical structure offered to the students. On the other hand, children attending public schools are enrolled according to the proximity of the school to the children’s homes. Thus, children from public schools have a greater chance to study closer to their homes and it is reasonable to conclude that they use more active commuting to school than those from private schools because of this proximity.
Some strengths of this study should be highlighted such as the multilevel approach used in the statistical analysis. This approach has been largely used to analyse the simultaneous effects of group- and individual-level variables on indi-vidual-level outcomes26, avoiding the possibility to find incorrect and potentially misleading results that could be found using a single-level analysis. In addition, the sampling method and the use of a validated instrument to measure the level of PA provide internal validity to the study. On the other hand, the instrument used in the analysis of physical and social environments of the schools was developed to be used in a recent Brazilian National School Survey (PeNSE)15, but it is not yet validated. Although it is preferable that information collected by questionnaires are collected from children than from parents, some non-differential measurement error can be expected through the use of these instruments. Another limitation is that other environments that could act more strongly in the habit of doing physi-cal activity such as home and neighbourhood were not evaluated.
In conclusion, these findings showed that both individual and school context variables were associated with levels of physical activity, varying between domains.
In addition, in terms of contextual variables, the presence of physical education teachers appears to play a more important role in physical activity promotion in comparison with physical and social environment of the schools. To understand the influence of contextual variables in levels of PA in children, future studies should be also focused on home and neighbourhood characteristics. For research purposes, it would be important for these studies to incorporate objective infor-mation about the built environment and to use check-lists and satellite images to audit environments.
Acknowledgments
The authors are grateful to the State Secretary of Education, the Municipal Secre-tary of Education, and the Direction of Private Schools, which allowed this study to be performed. Also, the authors would like to thank the Brazilian National Council for Scientific and Technological Development (CNPq) for the research grant (process #402350/2008-1 and 79996/2008-5 - FFD) that funded the study.
ReFeRences
1. Hallal PC, Victora CG, Azevedo MR, Wells JC. Adolescent physical activity and health: a systematic review. Sports Med. 2006;36(12):1019-1030.
2. Janssen I, Leblanc AG. Systematic review of the health benefits of physical activity and fitness in school-aged children and youth. Int J Behav Nutr Phys Act. 2010;7:40.
3. Organization WH. Global recommendations on physical activity for health. Geneva, Switzer-land: World Health Organization; 2010.
4. Hallal PC, Andersen LB, Bull FC, et al. Global physical activity levels: surveillance progress, pitfalls, and prospects. Lancet. 2012;380(9838):247-257.
5. Knuth AG, Hallal PC. Temporal trends in physical activity: a systematic review. J Phys Act Health. 2009;6(5):548-559.
6. Craggs C, Corder K, van Sluijs EM, Griffin SJ. Determinants of change in physical activity in children and adolescents: a systematic review. Am J Prev Med. 2011;40(6):645-658.
7. Van Der Horst K, Paw MJ, Twisk JW, Van Mechelen W. A brief review on correlates of physi-cal activity and sedentariness in youth. Med Sci Sports Exerc. 2007;39(8):1241-1250.
8. Bauman AE, Reis RS, Sallis JF, et al. Correlates of physical activity: why are some people phys-ically active and others not? Lancet. 2012;380(9838):258-271.
9. Davison KK, Werder JL, Lawson CT. Children’s active commuting to school: current knowl-edge and future directions. Prev Chronic Dis. 2008;5(3):A100.
10. Stanley RM, Ridley K, Dollman J. Correlates of children’s time-specific physical activity: a review of the literature. Int J Behav Nutr Phys Act. 2012;9:50.
11. Millstein RA, Strobel J, Kerr J, et al. Home, school, and neighborhood environment factors and youth physical activity. Pediatr Exerc Sci. 2011;23(4):487-503.
12. Goettems ML, Correa MB, Marques MO, et al. Methods and logistics of a multidisciplinary survey in Brazilian schoolchildren. Cadernos de Saúde Pública. 2013;Ahead of print.
13. Bastos JP, Araujo CL, Hallal PC. Prevalence of insufficient physical activity and associated factors in Brazilian adolescents. J Phys Act Health. 2008;5(6):777-794.
14. Cole TJ, Bellizzi MC, Flegal KM, Dietz WH. Establishing a standard definition for child overweight and obesity worldwide: international survey. BMJ. 2000;320(7244):1240-1243.
15. Estatística IIBdGe. Pesquisa Nacional de Saúde do Escolar. Rio de Janeiro, Brasil: Instituto Brasileiro de Geografia e Estatística. Coordenação de população e indicadores sociais;2009.
16. Haerens L, Craeynest M, Deforche B, Maes L, Cardon G, De Bourdeaudhuij I. The contribu-tion of home, neighbourhood and school environmental factors in explaining physical activity among adolescents. J Environ Public Health. 2009;2009:320372.
17. Sallis JF, Prochaska JJ, Taylor WC. A review of correlates of physical activity of children and adolescents. Med Sci Sports Exerc. 2000;32(5):963-975.
Corresponding author
Marcos Britto Corrêa Universidade Federal de Pelotas Faculdade de Odontologia Rua Gonçalves Chaves, 457, sala 506 – Centro CEP: 96015568 Pelotas – RS Tel/fax: (053) 3222 66 90 Ramal 135 e-mail: [email protected] Received 15/10/2013 Revised 24/10/2013 Approved 25/10/2013 18. Willenberg LJ, Ashbolt R, Holland D, et al. Increasing school playground physical activity:
a mixed methods study combining environmental measures and children’s perspectives. J Sci Med Sport. 2010;13(2):210-216.
19. Durant N, Harris SK, Doyle S, et al. Relation of school environment and policy to adolescent physical activity. J Sch Health. 2009;79(4):153-159; quiz 205-156.
20. Cohen DA, McKenzie TL, Sehgal A, Williamson S, Golinelli D, Lurie N. Contribution of public parks to physical activity. Am J Public Health. 2007;97(3):509-514.
21. Cradock AL, Melly SJ, Allen JG, Morris JS, Gortmaker SL. Characteristics of school campus-es and physical activity among youth. Am J Prev Med. 2007;33(2):106-113.
22. Fernandes M, Sturm R. Facility provision in elementary schools: correlates with physical edu-cation, recess, and obesity. Prev Med. 2010;50 Suppl 1:S30-35.
23. Nichol ME, Pickett W, Janssen I. Associations between school recreational environments and physical activity. J Sch Health. 2009;79(6):247-254.
24. Florindo AA, Hallal PC, Moura EC, Malta DC. Practice of physical activities and associated factors in adults, Brazil, 2006. Rev Saude Publica. 2009;43 Suppl 2:65-73.
25. Galobardes B, Shaw M, Lawlor DA, Lynch JW, Davey Smith G. Indicators of socioeconomic position (part 1). J Epidemiol Community Health. 2006;60(1):7-12.
26. Diez-Roux AV, Link BG, Northridge ME. A multilevel analysis of income inequality and cardiovascular disease risk factors. Soc Sci Med. 2000;50(5):673-687.