Samuel C DumithI Marlos R DominguesI Denise P GiganteI Pedro C HallalI Ana M B MenezesI Harold W KohlII
I Programa de Pós-Graduação em Epidemiologia. Universidade Federal de Pelotas. Pelotas, RS, Brasil
II School of Public Health. University of Texas. Austin, TX, United States Correspondence:
Samuel C Dumith R. Marechal Deodoro, 1160 3º piso – Centro
96020-220 Pelotas, RS, Brasil E-mail: [email protected] Received: 9/13/2009
Approved: 12/7/2010
Article available in Portuguese and English at: www.scielo.br/rsp
Prevalence and correlates
of physical activity
among adolescents from
Southern Brazil
Prevalência de atividade física em
adolescentes e fatores associados
ABSTRACT
OBJECTIVE: To estimate the prevalence and identify correlates of physical activity among adolescents.
METHODS: Cross-sectional study nested within a cohort of 4,325 subjects from the city of Pelotas, Southern Brazil, aged 14-15 years in 2008. Physical activity was analyzed using three different approaches: (1) prevalence of any leisure-time physical activity; (2) prevalence of any active commuting to school; and (3) prevalence of engaging in at least 300 minutes per week of both (1) and (2) combined. Independent variables included sociodemographic, behavioral, social, and biological characteristics, and number of different leisure-time physical activites practiced. Statistical analyses were carried out using Poisson regression.
RESULTS: The proportion of adolescents involved in any type of leisure-time physical activity was 75.6%, while 73.4% displayed some form of active commuting to school. Prevalence of total physical activity score (≥ 300 min/ week) was 48.2%, being greater among boys (62.6%) than among girls (34.5%). Furthermore, prevalence increased along with the number of physical activity modalities practiced (p<0.001). Factors associated with greater physical activity (leisure + commuting) at the recommended levels were: nonwhite skin color, having failed at school, and playing videogames. Lower socioeconomic status, more time spent on the computer, and parental physical activity were associated with the outcome only among girls.
CONCLUSIONS: Less than half the adolescents reached recommended levels of physical activity, and this proportion tended to decrease among subjects with higher socioeconomic level. Associated factors were different for leisure-time and commuting. Engaging in a wide variety of physical activities should be encouraged already during childhood.
The 2002 World Health Report ranked physical inactivity among the ten major causes of mortality and disability in the developed world.24 The World
Health Organization (WHO) estimates that nearly 2 million deaths worldwide can be attributed to physical inactivity.a Benefits of physical activity on health
are widely recognized in the recent literature, which also suggests that promotion of physical activity should begin already in early life.12 Among children
and adolescents, there is strong evidence that regular physical activity improves body composition, cardio-respiratory and muscular fi tness, bone health, and levels of metabolic health biomarkers.21
The Physical Activity Guidelines for Americans states that children and adolescents should perform at least 60 minutes per day of moderate-to-vigorous physical
RESUMO
OBJETIVO: Estimar a prevalência de atividade física entre adolescentes e identifi car fatores associados.
MÉTODOS:Estudo transversal aninhado em uma coorte com 4.325 indivíduos de 14-15 anos em Pelotas, RS, em 2008. A atividade física foi analisada por meio de três diferentes abordagens: 1) prevalência de alguma atividade física de lazer; 2) prevalência de algum deslocamento ativo para a escola; 3) prevalência de engajamento em pelo menos 300 minutos por semana da combinação de ambos (1 e 2). Variáveis independentes incluíram características demográfi cas, socioeconômicas, comportamentais, sociais e biológicas e número de atividades físicas praticadas no tempo de lazer. As análises estatísticas foram feitas pela regressão de Poisson.
RESULTADOS: A proporção de adolescentes envolvidos em alguma atividade física de lazer foi 75,6%, enquanto 73,4% apresentou alguma forma de deslocamento ativo para a escola. A prevalência de atividade física total (escore ≥ 300 min/sem) foi 48,2%, sendo maior para os meninos (62,6%) do que para as meninas (34,5%). Além disso, a prevalência aumentou de acordo com o número de atividades físicas praticadas (p < 0,001). Os fatores associados à maior prática de atividade física (lazer + deslocamento) nos níveis recomendados foram: cor de pele não-branca, ter repetido de ano na escola e jogar videogame. As variáveis menor nível socioeconômico, maior tempo de uso de computador e atividade física dos pais estiveram associadas ao desfecho apenas entre as meninas.
CONCLUSÕES: Menos da metade dos adolescentes atingiu as recomendações para a prática de atividade física, e essa proporção tende a diminuir entre os sujeitos de maior nível socioeconômico. Os fatores associados diferiram entre lazer e deslocamento. Engajamento em uma ampla variedade de atividades físicas deve ser encorajado desde a infância.
DESCRITORES: Adolescente. Exercício. Atividades Cotidianas. Atividades de Lazer. Fatores Socioeconômicos. Estudos Transversais.
INTRODUCTION
activity to obtain health benefi ts.21 A recent survey of
9th to 12th graders carried out by the US Youth Risk
Behavioral Surveillance System showed that only 35% of subjects reached the recommended levels of physical activity, this proportion being higher among boys (44%) than among girls (26%).8 In spite of the large number
of sources of data on physical activity prevalence of children and adolescents worldwide, correlates of physical activity have not been fully established. A review including studies published between 1999 and 2005 showed that only a few (male sex, motivation and social support), of the many variables studied showed consistent association with physical activity.22 However,
correlates may change with time (e.g. maturation and/ or period effects)16 and may also differ according to the
level of development of the study settings.
Physical activity is multidimensional, and can be influenced by physiological, developmental, envi-ronmental, psychological, social, and demographic factors.
Thus, the objective of the present study was to estimate the prevalence of physical activity and identify its correlates among adolescents from Southern Brazil.
METHODS
The subjects included in the present study were members of a birth cohort carried out in the municipa-lity of Pelotas, Southern Brazil, a city of approximately 340,000 inhabitants. Briefl y, this cohort included all newborns delivered in 1993 in Pelotas hospitals (over 99% of all births). Several visits were subsequently conducted on subsets of the 5,249 children enrolled in the cohort.23 During the last visit, in 2008, when subjects
were aged 14-15 years old, an attempt was made to trace all cohort members. A total of 4,384 subjects were traced. Of these, 55 refused to be interviewed and four were unable to participate in the study. By adding the 147 subjects known to be deceased to the total number of subjects interviewed (N=4,325), the follow-up rate of the present study was 85.2%.
Fieldwork lasted for eight months, from January to August 2008. Data were collected by trained inter-viewers during face-to-face home interviews. All instruments were previously tested and standardized. One questionnaire was administered to mothers (or guardians) and another to the adolescent. Interviews typically lasted for about one hour and were carried out only after consent was obtained from both mother and adolescent. For data quality control purposes, 30% of participants were re-interviewed (10% in person and 20% by phone), using a short questionnaire. Additionally, all questionnaires were checked by study supervisors upon completion.
The outcome of interest was adolescent physical acti-vity. This variable was measured using a questionnaire that included the two main domains of physical activity at this age: leisure-time activities and commuting to school. A very similar version of this instrument (with nine of the 13 physical activities investigated in the present study) was shown to be both reliable (rho=0.62) and valid (kappa=0.58) when compared to pedometer measurements.3
To measure leisure-time physical activity, each adoles-cent was asked whether he or she had engaged in any physical activity (from a list with 13 types read by the interviewer) in the week preceding the interview. The instrument included the following activities: outdoor soccer, indoor soccer, athletics, basketball, dance, gymnastics, martial arts, swimming, volleyball, tennis, walking, weight lifting, and fi tness training.
Other activities (not listed) could also be reported by the adolescent and were further coded (the most commonly cited activities were cycling and running). Physical education classes and labor activities were not considered. In case the adolescent had engaged in some type of leisure-time physical activity, information on frequency (days per week) and duration (hours and/or minutes per day) of this activity were collected. A score of leisure-time physical activity was then calculated by multiplying frequency (d/wk) by duration (min/d). The adolescent was considered as actively commuting to school when reporting going to and/or returning from school on foot or by bicycle. A commuting-to-school physical activity score was calculated by multiplying time (in minutes) spent walking/cycling to and/or from school by fi ve (number of schooldays in a week). A total score (min/wk) of physical activity was then generated by adding leisure-time and commuting scores. This score was dichotomized using a cut-off point of 300 min/wk, as recommended by the Physical Activity Guidelines for Children and Adolescents.21
Independent variables investigated included self-referred skin color (white, black, or mixed); socioeco-nomic level, measured in quintiles of an assets index obtained by principal component analysis,2 which
considered 19 household assets and other features of economic level; schooling of head of household (0-4, 5-8, 9-11, 12 or more years); schooling of the adolescent (up to 5th grade, 6-7th, 8-9th grade); weekly time spent
watching television (in tertiles); weekly time on the computer (in tertiles); use of videogame (yes or no); body mass index (BMI), objectively measured and cate-gorized into normal, overweight, or obese according to the WHO growth reference for school-aged children and adolescents;7 and self-reported duration of parental
(maternal or paternal) leisure-time physical activity, classifi ed as active or inactive according to a cut-off of 150 min/wk.21 The number of different physical
activities performed was also investigated, but was not considered in the multivariable model due to being one of the components of the outcome.
Multivariable analysis followed a conceptual hierarchical model that determined the order of entry of variables into the model to control for potential confounding factors. The fi rst level included demographic and socioeconomic variables (skin color, assets index and schooling of head of household); the second level included the adolescent’s schooling and the three variables related to sedentary behavior (watching television, using a computer and playing videogames); BMI status and parental physical activity were included in the third level. Variables were adjusted for those in the same or higher levels; those presenting a p-value ≤ 0.20 were kept in the fi nal model. All analyses were stratifi ed by sex and the signifi cance level was set at 5% for two-tailed tests.
The study protocol was approved by the Research Ethics Committee of the Universidade Federal de
Pelotas.
RESULTS
Of the 4,325 adolescents interviewed, 82% were 14 years old, 51% were female, 64% were white, 64% had failed at school at least once, 99% watched televi-sion, 71% used a computer, 38% played videogames, 28% were overweight and 15% had mother or father who were physically active. Only one subject failed to provide complete information on physical activity. The proportion of adolescents engaging in any leisure-time physical activity was 75.6% (87.2% of boys and 64.5% of girls). The most common activity was outdoor soccer, reported by 62% of boys, and walking, reported by 36% of girls. As for commuting to school, 73.4% of subjects reported actively commuting (77.2% of boys and 69.8% of girls). Overall, 92.4% (95%CI: 91.6;93.2) performed some type of physical activity (96.7% of boys and 88.2% of girls). Average duration of total physical activity (comprising the two physical activity domains) was 445 min/wk (SD=508) with a median of 280 min/wk. There was a weak relationship between scores (min/wk) for leisure-time and commuting acti-vity (Spearman’s correlation = 0.06). Prevalence of reaching the recommended level of activity of at least 300 min/wk was 48.2% (95%CI: 46.7;49.7), being higher for boys (62.6%; 95%CI: 60.5;64.6) than girls (34.5%; 95%CI: 32.5;36.5).
The Figure illustrates the prevalence of total physical activity at the recommended levels according to the number of leisure-time physical activities performed. The proportion of active individuals increased linearly (p<0.001) with number of physical activities, reaching more than 90% among adolescents engaging in three or more types of leisure-time physical activity.
Factors associated with engagement in any leisure-time physical activity are presented in Table 1.
Prevalence was higher in the following groups: lower and intermediate tertiles of time watching television, intermediate tertile of computer use, adolescents who played videogames, and those whose parents were active (p<0.001). Non-obese boys were more likely to perform leisure-time physical activity in crude analysis (p=0.01). After adjustment, prevalence was higher among girls with mixed skin color than among those with white skin (p=0.04), and the assets index showed a direct association with leisure-time physical activity (p-value for linear trend=0.04).
Variables associated with active commuting to school are shown in Table 2. Prevalence of commuting to school on foot or by bicycle was higher among subjects who were non-white, had lower socioeconomic status, had failed at school, were in the lower tertile of computer use, and whose parents were active. Normal-weight boys were more likely to actively commute to school than their peers. After adjustment for potential confoun-ders, computer use and parental physical activity (for both sexes) and skin color (only among boys) lost their association with active commuting to school.
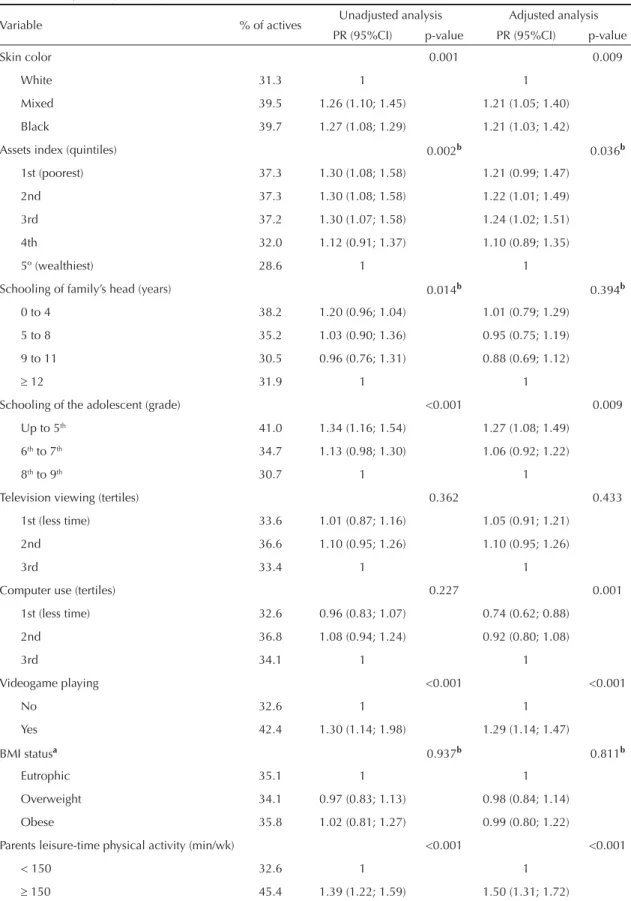
Tables 3 and 4 show the associations between each independent variable and prevalence of total physical activity (at least 300 min/wk) among boys and girls, respectively. After adjusted analysis, correlates of physical activity (for both sexes) were: black or mixed skin color (when compared to white skin color), having failed at school, and playing videogames. Among girls, physical activity correlates included the assets index (negative association), computer use (positive associa-tion), and parental physical activity. After adjustment, assets index, computer use and BMI status (for boys) and schooling of the head of household (for girls) lost association with the outcome. Moreover, a negative confounding effect was observed for computer use among girls; this variable was associated to the outcome only after multivariable analysis.
If only leisure-time physical activity was considered, overall prevalence of reaching the recommended
40 72 91 49 76 93 32 66 85 0 20 40 60 80 100
1 2 3 or more
Number of leisure-time physical activies
P h ysi cal act ivi ty p reval en
ce Overall Boys Girls
%
Table 1. Prevalence of engagement in any leisure-time physical activity among adolescents, stratifi ed by sex.aMunicipality of Pelotas, Southern Brazil, 2008.
Variable n Unadjusted Adjusted
Boys Girls Boys Girls
Skin Color 0.371 0.084 0.329 0.044
White 2769 86.6 63.2 86.7 62.8
Mixed 784 88.5 69.1 88.4 69.6
Black 611 89.1 64.2 89.5 65.1
Assets index (quintiles) 0.940 0.394 0.962 0.221
1st (poorest) 866 87.0 60.7 87.3 60.0
2nd 856 87.7 65.1 87.8 64.7
3rd 860 86.7 65.8 86.8 65.7
4th 865 88.1 65.0 88.1 65.5
5th (wealthiest) 857 86.3 66.6 86.5 67.5
Schooling of family’s head (years) 0.058 0.538 0.058 0.484
0 to 4 1124 84.6 65.2 84.6 66.2
5 to 8 1820 89.3 64.9 89.3 65.1
9 to 11 941 86.1 62.3 86.1 61.8
≥ 12 419 87.9 67.7 87.9 66.3
Schooling of the adolescent (grade) 0.098 0.317 0.121 0.409
Up to 5th 1345 85.5 63.0 86.3 64.2
6th to 7th 1410 89.3 63.4 89.8 63.3
8th to 9th 1569 87.1 66.3 87.5 66.5
Television viewing (tertiles) 0.043 0.073 0.027 0.050
1st (less time) 1537 87.1 65.6 88.1 66.3
2nd 1351 89.6 66.8 89.9 66.9
3rd 1437 85.1 61.4 85.1 61.3
Computer use (tertiles) 0.003 <0.001 0.010 0.001
1st (less time) 1506 84.8 59.4 85.7 59.7
2nd 1381 90.9 69.1 90.9 69.0
3rd 1438 86.5 65.2 86.9 65.6
Videogame playing <0.001 <0.001 0.001 <0.001
No 2668 84.0 62.6 84.7 62.8
Yes 1656 89.5 72.7 89.7 72.9
BMI statusb 0.036 0.368 0.039 0.464
Eutrophic 2969 87.9 65.8 88.7 66.0
Overweight 776 88.7 62.8 88.9 63.8
Obese 355 81.9 61.6 82.2 61.7
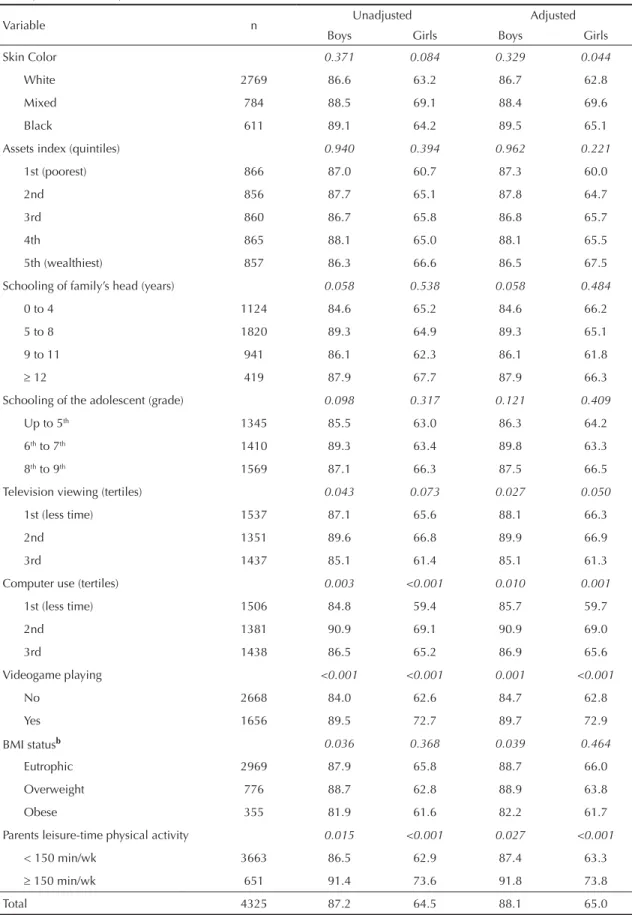
Parents leisure-time physical activity 0.015 <0.001 0.027 <0.001
< 150 min/wk 3663 86.5 62.9 87.4 63.3
≥ 150 min/wk 651 91.4 73.6 91.8 73.8
Total 4325 87.2 64.5 88.1 65.0
aItalic numbers correspond to p-values comparing the variables categories within each sex. bVariable with 5% of missing data (remaining variables presented less than 1%).
levels (at least 300 min/wk) would be 38.2% (95%CI: 36.7;39.6). Correlates of this outcome were very similar (data not shown) to those observed for total physical activity (commuting and leisure time). A
few exceptions were the lack of association with the outcome of schooling among boys and skin color and assets index among girls. All other correlates were kept in the fi nal model.
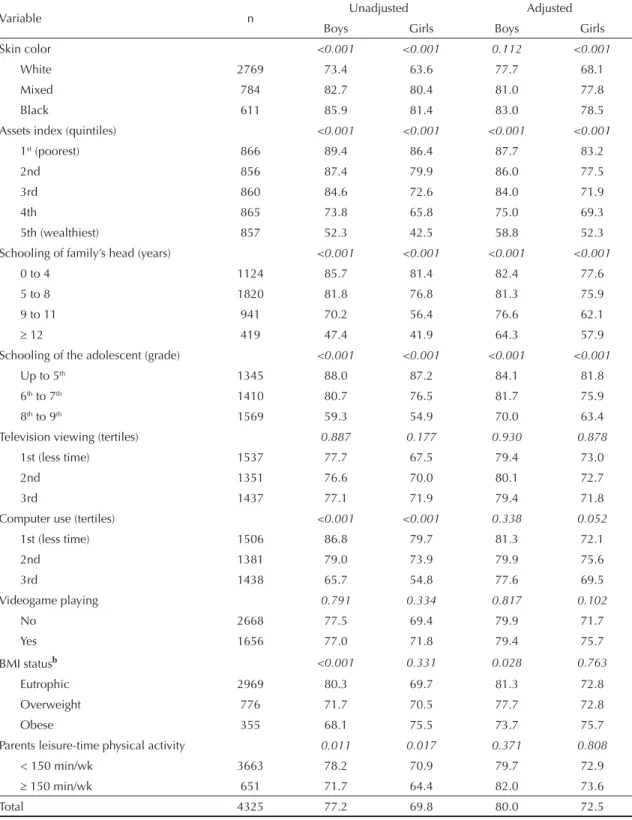
Table 2. Prevalence of active commuting to school (walking or bicycle) among adolescents, stratifi ed by sex.aMunicipality of Pelotas, Southern Brazil, 2008.
Variable n Unadjusted Adjusted
Boys Girls Boys Girls
Skin color <0.001 <0.001 0.112 <0.001
White 2769 73.4 63.6 77.7 68.1
Mixed 784 82.7 80.4 81.0 77.8
Black 611 85.9 81.4 83.0 78.5
Assets index (quintiles) <0.001 <0.001 <0.001 <0.001
1st (poorest) 866 89.4 86.4 87.7 83.2
2nd 856 87.4 79.9 86.0 77.5
3rd 860 84.6 72.6 84.0 71.9
4th 865 73.8 65.8 75.0 69.3
5th (wealthiest) 857 52.3 42.5 58.8 52.3
Schooling of family’s head (years) <0.001 <0.001 <0.001 <0.001
0 to 4 1124 85.7 81.4 82.4 77.6
5 to 8 1820 81.8 76.8 81.3 75.9
9 to 11 941 70.2 56.4 76.6 62.1
≥ 12 419 47.4 41.9 64.3 57.9
Schooling of the adolescent (grade) <0.001 <0.001 <0.001 <0.001
Up to 5th 1345 88.0 87.2 84.1 81.8
6th to 7th 1410 80.7 76.5 81.7 75.9
8th to 9th 1569 59.3 54.9 70.0 63.4
Television viewing (tertiles) 0.887 0.177 0.930 0.878
1st (less time) 1537 77.7 67.5 79.4 73.0
2nd 1351 76.6 70.0 80.1 72.7
3rd 1437 77.1 71.9 79.4 71.8
Computer use (tertiles) <0.001 <0.001 0.338 0.052
1st (less time) 1506 86.8 79.7 81.3 72.1
2nd 1381 79.0 73.9 79.9 75.6
3rd 1438 65.7 54.8 77.6 69.5
Videogame playing 0.791 0.334 0.817 0.102
No 2668 77.5 69.4 79.9 71.7
Yes 1656 77.0 71.8 79.4 75.7
BMI statusb <0.001 0.331 0.028 0.763
Eutrophic 2969 80.3 69.7 81.3 72.8
Overweight 776 71.7 70.5 77.7 72.8
Obese 355 68.1 75.5 73.7 75.7
Parents leisure-time physical activity 0.011 0.017 0.371 0.808
< 150 min/wk 3663 78.2 70.9 79.7 72.9
≥ 150 min/wk 651 71.7 64.4 82.0 73.6
Total 4325 77.2 69.8 80.0 72.5
In a simulated analysis involving the most active groups, adolescents who were male, black, enrolled in the 6th or
7th grades and who played videogames had 85% chance
of being active (66% if only leisure-time activity is considered). In the same way, if female adolescents of low or middle socioeconomic level and with physically active parents had a 52% chance of being active (33% considering only leisure-time activity).
DISCUSSION
Certain methodological aspects of this study should be considered. As this study was cross-sectional, some of the associations detected may be subject to reverse causality, particularly BMI status and variables related to sedentary behavior (television, computer and videogame use). Physical education classes were not considered in the physical activity score due to their low intensity.10
Furthermore, simulations including physical education classes in the fi nal score have been published in a previous study, which found that this would lead to an increase in prevalence of physical activity of only 3.3 percentage points.3 Physical activity at work or while
commuting to work was not considered given the small number of working adolescents were working. Moreover, the vast majority of respondents (98%) was studying or had studied in the year prior to the interview. Another limitation is related to the lack of an intensity-related physical activity variable, although the majority of physical activity modalities included in the questionnaire can be regarded as of vigorous intensity. Prevalence of any physical activity in leisure time or commuting to school in our cohort (92.4%) was very similar to that of another study conducted in schools of Rio de Janeiro, Southeastern Brazil. This study reported 90.3% prevalence (95% among boys and 88% among girls) of physical activity among students aged 15 years old on average.5 When examining only
leisure-time physical activity (which had a prevalence of 76% in the current study), our results are consistent with those of another study carried out in a repre-sentative sample of adolescents (12-18 years) from Taiwan, which reported a prevalence of 78%.6 However,
prevalence in our cohort was higher that reported by a Brazilian study with adolescents aged ten to 19 years (52% prevalence).3 This same study found that 69% of
adolescents were active commuters,3 versus 73% in the
present study. A nationally representative study with North-American subjects aged 9-15 years estimated that, among those living within a mile from school, prevalence of active commuters was 48%.13
The proportion of adolescents meeting the activity criterion (at least 300 min/wk) was slightly higher than that found in another Brazilian study investigating the same age group (48% versus 40%), but which included only public school students.5 Compared to international
data, a study conducted in 35 countries from Europe and North America found a mean prevalence of physical activity of 35.3% (ranging from 22.6% in Italy to 57.1% in the United States) among boys and 22.3% (ranging from 11.2% in France to 41.8% in the United States) among girls.25 A study carried out in the 100 largest
cities in the United States, in 2005, with adolescents aged 14 to 17 years, found 48% adolescents to be active (57% of boys and 40% of girls),4 a prevalence similar
to that found in the present study.
Regarding correlates of physical activity (considering the threshold of 300 min/wk), non-white boys and girls were, respectively, 16% (95%CI: 8;24) and 21% (95%CI: 7;37) more likely to be active than white adolescents, even after adjustment for socioeconomic level. When considering only leisure time, skin color was not associated with physical activity among girls, but remained associated with the outcome among boys. Other studies have evaluated the effect of this variable on physical activity levels, but results are contradic-tory.22 There is a tendency for Euro-Americans to be
more active when compared to other races.16 However,
the manner in which this variable is measured and clas-sifi ed also varies across studies. In addition, not all of these studies were controlled for the confounding effect of socioeconomic status.11
Socioeconomic status, as measured by the assets index, showed an inverse association with physical activity among girls (p=0.04), but not among boys (p=0.2). This variable affected primarily commuting to school, poorer subjects being more more active in this domain, as observed in a prior study.13 A Brazilian investigation
of students aged 15-18 years also detected a negative association between socioeconomic level and total physical activity (estimated by daily energy demand) among girls.9 Unlike other studies,4,15,17 socioeconomic
status was not associated with leisure-time physical activity. Although a literature review showed a positive association between physical activity with parental schooling,22 such an association was not detected in the
present study. Two other studies carried out in China and Brazil also failed to detect an association between parental schooling and adolescent physical activity.3,18
Adolescents in the 8th or 9th grades (the expected grade
for this age group), were less likely to be active in comparison to those in earlier grades. There is cross-sectional evidence that physical activity levels tend to decrease throughout adolescence.16,17 While adolescents
in the 8th or 9th grades have colleagues of the same age
combining qualitative and quantitative methodologies will be necessary to explain this association.
Watching television, using the computer, and playing videogames were explored as indicators of sedentary
behavior. These variables were analyzed separately due to their different associations with prevalence of physical activity. Whereas watching television was not associated with physical activity, adolescents who played videogames (boys and girls, respectively) were
Table 3. Unadjusted and adjusted analysis among boys of total physical activity prevalence (leisure-time plus commuting to school), according to the criterion of 300 min/wk for each category of the investigated variables. Municipality of Pelotas, Southern Brazil, 2008. (N=2,111)
Variable % of actives Unadjusted analysis Adjusted analysis PR (95%CI) p-value PR (95%CI) p-value
Skin color <0.001 <0.001
White 59.2 1 1
Mixed 68.4 1.15 (1.06;1.26) 1.14 (1.05;1.24)
Black 70.4 1.19 (1.09;1.30) 1.18 (1.08;1.28)
Assets index (quintiles) 0.018b 0.186b
1st (poorest) 64.2 1.14 (1.02;1.27) 1.09 (0.97;1.21)
2nd 64.3 1.14 (1.02;1.28) 1.10 (0.99;1.23)
3rd 65.4 1.17 (1.05;1.30) 1.14 (1.02;1.27)
4th 62.6 1.11 (1.00;1.24) 1.09 (0.98;1.22)
5º (wealthiest) 56.3 1 1
Schooling of family’s head (years) 0.138b 0.959b
0 to 4 63.1 1.10 (0.96;1.26) 1.01 (0.87;1.18) 5 to 8 64.3 1.12 (0.98;1.28) 1.04 (0.90;1.20) 9 to 11 60.1 1.06 (0.92;1.22) 1.02 (0.88;1.18)
≥ 12 57.4 1 1
Schooling of the adolescent (grade) 0.001 0.008
Up to 5th 62.7 1.10 (1.01;1.19) 1.01 (0.91;1.12) 6th to 7th 67.4 1.18 (1.08;1.28) 1.12 (1.03;1.23)
8th to 9th 57.2 1 1
Television viewing (tertiles) 0.629 0.297
1st (less time) 63.1 1.03 (0.95;1.12) 1.06 (0.98;1.15)
2nd 63.5 1.04 (0.96;1.13) 1.06 (0.97;1.15)
3rd 61.1 1 1
Computer use (tertiles) 0.015 0.070
1st (less time) 61.4 1.03 (0.95;1.11) 0.95 (0.87;1.04)
2nd 67.0 1.11 (1.03;1.21) 1.05 (0.96;1.14)
3rd 59.9 1 1
Videogame playing <0.001 <0.001
No 57.0 1 1
Yes 66.6 1.17 (1.09;1.25) 1.16 (1.08;1.24)
BMI statusa 0.044b 0.069b
Eutrophic 63.7 1 1
Overweight 61.7 0.97 (0.89;1.06) 0.98 (0.89;1.07)
Obese 55.9 0.88 (0.77;1) 0.89 (0.78;1.01)
Parents leisure-time physical activity (min/wk) 0.163 0.075
< 150 61.9 1 1
≥ 150 65.9 1.06 (0.98;1.16) 1.09 (0.99;1.19)
aVariable with 5% of missing data (remaining variables presented less than 1%). bWald’s test for linear trend.
Table 4. Unadjusted and adjusted analysis among girls of total physical activity prevalence (leisure-time plus commuting to school), according to the criterion of 300 min/wk for each category of the investigated variables. Municipality of Pelotas, Southern Brazil, 2008. (N=2214)
Variable % of actives Unadjusted analysis Adjusted analysis PR (95%CI) p-value PR (95%CI) p-value
Skin color 0.001 0.009
White 31.3 1 1
Mixed 39.5 1.26 (1.10; 1.45) 1.21 (1.05; 1.40)
Black 39.7 1.27 (1.08; 1.29) 1.21 (1.03; 1.42)
Assets index (quintiles) 0.002b 0.036b
1st (poorest) 37.3 1.30 (1.08; 1.58) 1.21 (0.99; 1.47)
2nd 37.3 1.30 (1.08; 1.58) 1.22 (1.01; 1.49)
3rd 37.2 1.30 (1.07; 1.58) 1.24 (1.02; 1.51)
4th 32.0 1.12 (0.91; 1.37) 1.10 (0.89; 1.35)
5º (wealthiest) 28.6 1 1
Schooling of family’s head (years) 0.014b 0.394b
0 to 4 38.2 1.20 (0.96; 1.04) 1.01 (0.79; 1.29)
5 to 8 35.2 1.03 (0.90; 1.36) 0.95 (0.75; 1.19)
9 to 11 30.5 0.96 (0.76; 1.31) 0.88 (0.69; 1.12)
≥ 12 31.9 1 1
Schooling of the adolescent (grade) <0.001 0.009
Up to 5th 41.0 1.34 (1.16; 1.54) 1.27 (1.08; 1.49)
6th to 7th 34.7 1.13 (0.98; 1.30) 1.06 (0.92; 1.22)
8th to 9th 30.7 1 1
Television viewing (tertiles) 0.362 0.433
1st (less time) 33.6 1.01 (0.87; 1.16) 1.05 (0.91; 1.21)
2nd 36.6 1.10 (0.95; 1.26) 1.10 (0.95; 1.26)
3rd 33.4 1 1
Computer use (tertiles) 0.227 0.001
1st (less time) 32.6 0.96 (0.83; 1.07) 0.74 (0.62; 0.88)
2nd 36.8 1.08 (0.94; 1.24) 0.92 (0.80; 1.08)
3rd 34.1 1 1
Videogame playing <0.001 <0.001
No 32.6 1 1
Yes 42.4 1.30 (1.14; 1.98) 1.29 (1.14; 1.47)
BMI statusa 0.937b 0.811b
Eutrophic 35.1 1 1
Overweight 34.1 0.97 (0.83; 1.13) 0.98 (0.84; 1.14)
Obese 35.8 1.02 (0.81; 1.27) 0.99 (0.80; 1.22)
Parents leisure-time physical activity (min/wk) <0.001 <0.001
< 150 32.6 1 1
≥ 150 45.4 1.39 (1.22; 1.59) 1.50 (1.31; 1.72)
aVariable with 5% of missing data (remaining variables presented less than 1%). bWald’s test for linear trend.
1. Aaron DJ, Storti KL, Robertson RJ, Kriska AM, LaPorte RE. Longitudinal study of the number and choice of leisure time physical activities from mid to late adolescence: implications for school curricula and community recreation programs. Arch Pediatr Adolesc Med. 2002;156(11):1075-80.
2. Araújo CL, Menezes AM, Vieira MFA, Neutzling MB, Gonçalves H, Anselmi L, et al. Acompanhamento 2004-5 da coorte de nascimentos de 1993 de Pelotas:
métodos. Cad Saude Publica. 2009; no prelo.
3. Bastos JP, Araújo CLP, Hallal PC. Prevalence of insuffi cient physical activity and associated factors in Brazilian adolescents. J Phys Act Health. 2008;5(6):777-94.
4. Butcher K, Sallis JF, Mayer JA, Woodruff S. Correlates of physical activity guideline compliance for adolescents in 100 U.S. Cities. J Adolesc Health. 2008;42(4):360-8. DOI:10.1016/j.jadohealth.2007.09.025
REFERENCES
16% (95%CI: 8;24) and 29% (95%CI: 14;47) more active than their counterparts. Computer use was signifi cantly associated with physical activity only among girls, whose physical activity prevalence was lower among the lower tertile (less time per week) than the upper tertile of this variable. Though computer use was directly related to socioeconomic status across all quintiles of the assets index, the most active girls were those who spent more time using computers. This seeming paradox can perhaps be explained by this group’s greater awareness of the benefi ts of physical activity and larger social support from peers.
A study of adolescents from the United States did not fi nd an association between time spent watching television or playing video or computer games and active commuting to school.13 A study conducted with students aged 9-13
years from Canada found a positive relationship between time spent playing videogames and physical activity, both for boys and girls.14 Another study with adolescents from
Taiwan evaluated the daily time spent seated, fi nding that those spending less than eight hours seated were less engaged in physical activity than those spending over 12 hours.6 Therefore, one can argue that physical activity
and sedentary behavior are independent constructs, and not opposite factors at this age group.19
Prevalence of physical activity did not differ according to BMI status, though obese boys tended to be less active (adjusted PR=0.89; 95%CI: 0.78;1.01) than normal weight boys, as reported by another study using the same cut-off points.14 However, lack of an association in this
case should be viewed with caution due to the cross-sectional design and the possibility of reversed causality. In other words, overweight adolescents may engage in more physical activity as a consequence of their BMI condition. It is worth mentioning that, although physical activity and BMI show an inverse relationship in most studies, this association is not well established.16,22
Parental physical activity showed the strongest asso-ciation with physical activity among girls, even after controlling for confounding factors. Girls with active parents (mother and/or father) were 50% (95%CI: 31;72) more likely to be active compared to those with inactive parents. Among boys, this association
approached the signifi cance level (p=0.075). A recent review of the literature supports the notion that parental physical activity has a positive role on physical activity among adolescents.17 However, this finding is not
consistently reported in the literature.11,22 Also, parental
activity may have a stronger effect on girls than on boys, especially if only maternal physical activity is considered.14 Nevertheless, even when paternal and
maternal physical activity is analyzed separately (data not shown), the results are still consistent to those presented in the Results section.
Finally, as expected, prevalence of physical activity increased as a function of the number of physical activities performed during leisure-time. A longitudinal study verifi ed that the decline in prevalence of physical activity throughout adolescence was primarily due to a decrease in the number of reported physical activities rather than in the time spent in such activities.1 Thus,
engagement in a variety of leisure-time physical activities needs to be encouraged among children and adolescents. In addition, it is important to highlight that physical activity during youth may be a predictor of activity in adult age.20
Dumith SC was supported by Conselho Nacional de Pesquisa e Desenvolvimento Científi co e Tecnológico (CNPq – Process nº 142187/2007-0; doctoral scholarship) and Coordenação de Aperfeiçoamento de Pessoal de Nível Superior (CAPES – Process nº 4273/08-7; doctoral scholarship).
Article based on the doctoral thesis of SC Dumith, presented to the Programa de Pós-Graduação em Epidemiologia, Universidade Federal de Pelotas, in 2010.
The authors declare that there are no confl icts of interest. 5. Castro IR, Cardoso LO, Engstrom EM, Levy RB,
Monteiro CA. Vigilância de fatores de risco para doenças não transmissíveis entre adolescentes: a experiência da cidade do Rio de Janeiro, Brasil. Cad Saude Publica. 2008;24(10):2279-88. DOI:10.1590/ S0102-311X2008001000009
6. Chen LJ, Haase AM, Fox KR. Physical activity among adolescents in Taiwan. Asia Pac J Clin Nutr. 2007;16(2):354-61.
7. de Onis M, Onyango AW, Borghi E, Siyam A, Nishida C, Siekmann J. Development of a WHO growth reference for school-aged children and adolescents. Bull World Health Organ. 2007;85(9):660-7. DOI:10.2471/BLT.07.043497
8. Eaton DK, Kann L, Kinchen S, Shanklin S, Ross J, Hawkins J, et al. Youth risk behavior surveillance--United States, 2007. MMWR Surveill Summ. 2008;57(4):1-131.
9. Farias Jr JC. Associação entre prevalência de inatividade física e indicadores de condição socioeconômica em adolescentes. Rev Bras Med Esporte. 2008;14(2):109-14. DOI:10.1590/S1517-86922008000200005
10. Guedes DP, Guedes JERP. Esforços físicos nos programas de educação física escolar. Rev Paul Educ Fis. 2001;15(1):33-44.
11. Gustafson SL, Rhodes RE. Parental correlates of physical activity in children and early adolescents. Sports Med. 2006;36(1):79-97. DOI:10.2165/00007256-200636010-00006
12. Hallal PC, Victora CG, Azevedo MR, Wells JC. Adolescent physical activity and health: a systematic review. Sports Med. 2006;36(12):1019-30.
DOI:10.2165/00007256-200636120-00003
13. Martin SL, Lee SM, Lowry R. National prevalence and correlates of walking and bicycling to school. Am J Prev Med. 2007;33(2):98-105. DOI:10.1016/j. amepre.2007.04.024
14. O’Loughlin J, Paradis G, Kishchuk N, Barnett T, Renaud L. Prevalence and correlates of physical activity behaviors among elementary schoolchildren in multiethnic, low income, inner-city neighborhoods in Montreal, Canada. Ann Epidemiol. 1999;9(7):397-407. DOI:10.1016/S1047-2797(99)00030-7
15. Oehlschlaeger MH, Pinheiro RT, Horta B, Gelatti C, San’Tana P. Prevalência e fatores associados ao sedentarismo em adolescentes de área urbana. Rev Saude Publica. 2004;38(2):157-63. DOI:10.1590/ S0034-89102004000200002
16. Sallis JF, Prochaska JJ, Taylor WC. A review of correlates of physical activity of children and
adolescents. Med Sci Sports Exerc. 2000;32(5): 963-75. DOI:10.1097/00005768-200005000-00014
17. Seabra AF, Mendonca DM, Thomis MA, Anjos LA, Maia JA. Determinantes biológicos e sócio-culturais associados à prática de atividade física de adolescentes. Cad Saude Publica. 2008;24(4):721-36. DOI:10.1590/S0102-311X2008000400002
18. Shi Z, Lien N, Kumar BN, Holmboe-Ottesen G. Physical activity and associated socio-demographic factors among school adolescents in Jiangsu Province, China. Prev Med. 2006;43(3):218-21. DOI:10.1016/j. ypmed.2006.04.017
19. Taveras EM, Field AE, Berkey CS, Rifas-Shiman SL, Frazier AL, Colditz GA, et al. Longitudinal relationship between television viewing and leisure-time physical activity during adolescence. Pediatrics. 2007;119(2): e314-9. DOI:10.1542/peds.2005-2974
20. Telama R, Yang X, Viikari J, Valimaki I, Wanne O, Raitakari O. Physical activity from childhood to adulthood: a 21-year tracking study. Am J Prev Med. 2005;28(3):267-73. DOI:10.1016/j. amepre.2004.12.003
21. United States Department of Health and Human Services. Physical Activity Guidelines Advisory Committee Report 2008. Washington; 2008.
22. Van Der Horst K, Paw MJ, Twisk JW, Van Mechelen W. A brief review on correlates of physical activity and sedentariness in youth. Med Sci Sports Exerc. 2007; 39(8):1241-50. DOI:10.1249/mss.0b013e318059bf35
23. Victora CG, Hallal PC, Araujo CL, Menezes AM, Wells JC, Barros FC. Cohort profi le: the 1993 Pelotas (Brazil) birth cohort study. Int J Epidemiol. 2008;37(4):704-9.
24. World Health Organization. The World Health Report 2002: Reducing risks, promoting healthy life. Geneva; 2002.