Prevalence and correlates of insufficient
physical activity in school adolescents in
Peru
Bimala SharmaI,II, Rosemary Cosme ChavezI,II, Eun Woo NamI,II
I Yonsei Global Health Center. Yonsei University. Wonju City, Republic of Korea
II Department of Health Administration. Graduate School. Yonsei University. Wonju City, Republic of Korea
ABSTRACT
OBJECTIVE: To assess the prevalence and correlates of insufficient physical activity in adolescents in Peru.
METHODS: We used a self-administered questionnaire developed from Global school-based Student Health Survey to collect information from secondary school students in North Lima and Callao in 2015. We carried out Poisson regression with robust variance using generalized linear models to estimate the crude and adjusted prevalence ratios (APR) with 95% confidence intervals (95%CI) of insufficient physical activity for its correlates.
RESULTS: We have found that 78% of the adolescents did not meet the global recommendation of the World Health Organization on physical activity in the last week before the survey. Female respondents (APR = 1.13, 95%CI 1.04–1.21), respondents who perceived themselves as overweight (APR = 1.10, 95%CI 1.03–1.18), and respondents who consumed insufficient vegetables and fruits [no vegetables (APR = 1.30, 95%CI 1.06–1.59), no fruits (APR = 1.15, 95%CI 1.00–1.31) as compared to those who consumed ≥ 2 servings every day in the last seven days] were more likely to report insufficient physical activity. Adolescents who worked after school (APR = 0.92, 95%CI 0.84–0.99), had physical education classes five times per week (APR = 0.94, 95%CI 0.88–0.99), and had parental supervision (APR = 0.92, 95%CI 0.87–0.98) were less likely to report insufficient physical activity. CONCLUSIONS: Sex, work after school, perceived body weight, physical education class, parental support, and healthy dietary behaviors were associated with insufficient physical activity. Attempts to improve physical activity should look for ways to enhance leisure-time physical activity, parental support, physical education classes, healthy dietary behaviors, and normal body weight maintenance in adolescents with integrated efforts from the family and school. DESCRIPTORS: Adolescent Behavior. Physical Activity. Sedentary Lifestyle. Life Style. Risk Factors. Socioeconomic Factors. Health Surveys.
Correspondence: Eun Woo Nam
1 Yonseidae-gil, Wonju City, Gangwon-Do
26493, Republic of Korea E-mail: [email protected]
Received: Apr 24, 2017 Approved: Sep 27, 2017
How to cite: Sharma B, Chavez RC, Nam EW. Prevalence and correlates of insufficient physical activity in school adolescents in Peru. Rev Saude Publica. 2018;52:51.
Copyright: This is an open-access article distributed under the terms of the Creative Commons Attribution License, which permits unrestricted use, distribution, and reproduction in any medium, provided that the original author and source are credited.
INTRODUCTION
Physical activity (PA) is any body movement produced by skeletal muscles that requires energy expenditure, including working, playing, doing household chores, traveling, and engaging in recreational pursuits. The World Health Organization (WHO) recommends that children and adolescents should have at least 60 minutes of moderate to vigorous intensity PA daily, which can be developmentally appropriate, enjoyable, and from a
variety of activities1,2. However, approximately 80% of the adolescents worldwide do not
meet the recommended daily level of PA, which means they are insufficiently physically
active2,3. A study comparing 34 countries across five WHO regions has revealed that 23.8%
of the boys and 15.4% of the girls met the recommendations of PA4. In Brazil, less than
half of the adolescents reached the recommendation of PA, and this proportion tended
to decrease among subjects with a higher socioeconomic level5. In the same vein, 24.5%
of the students were physically active for a total of at least 60 minutes per day on five or more days during the past seven days in Peru, according to the Global school-based
Student Health Survey (GSHS) conducted in 20106.
Insufficient PA is a major risk factor for several non-communicable diseases2,7,8. A high level
of PA during adolescence has been significantly associated with a high level of adult PA9,10. In
addition, being overweight or obese as a child increases the risk of adult obesity11. Previous
studies conducted in different countries show that insufficient PA is associated with several
behavioral and socioenvironmental factors12–18.
Peru is an upper middle-income country experiencing steady economic growth since the last decade, with a life expectancy of 74.8 years and a human development index
of 0.74019,20. Studies have shown a higher prevalence of overweight and obesity among
children and adolescents in Lima compared to the rest of the country21,22. One of these
studies has also shown that high socioeconomic status and living in Lima were associated
with being overweight and obese22. Furthermore, it was also known that the lack of PA can
have a greater impact on overweight and obesity than the amount of food consumed in school-age children in Lima23. This study tried to find out if the prevalence and correlates
of insufficient physical activity in North Lima and Callao were similar with that in the rest of the world. We believe that the understanding of the correlates of insufficient PA may contribute with an effective planning for the promotion of PA. Therefore, this study aimed to assess the prevalence and correlates of insufficient physical activity among adolescents in North Lima and Callao, Peru.
METHODS
Study Design and Sampling
We conducted a cross-sectional survey among secondary school students in the Lima Metropolitan Area (Province of Lima and Callao), Peru. We used the information generated as part of the school health survey conducted by the Yonsei Global Health Center in collaboration with the Korea International Cooperation Agency, Peru Office. The survey was conducted in November 2015. The study participants were selected from four districts: Comas (Province of Lima), Bellavista, Ventanilla, and Mi Peru (Province of Callao) (Figure).
The life expectancy of the study area was higher than the national average of 74.8 years, being
it 78.9 years in Comas, 79.8 years in Bellavista, and 78.5 years in Ventanilla and Mi Perú20,24.
The Mi Peru district has the largest population density, with over 24,000 inhabitants per
square kilometer, followed by Bellavista district with almost 16,000 inhabitants. Comas has close to 11,000 inhabitants per square kilometer and Ventanilla has 5,017.93 inhabitants25,26.
the Callao Province, one from each district. The study participants were secondary level
school students from public schools. In Peru, a Ministerial Resolution has organized its basic education into three levels: initial, primary, and secondary. Secondary level education ranges
from the first to the fifth grade and usually covers adolescents aged from 12 to 16 years27.
All secondary classes were taken from each school and considered as strata. Students were
chosen from each class using systematic random sampling with a random start. The sample
size was calculated using the following formula as recommended by Naing et al. (2006), for the prevalence study28. A design effect (deff) of three was used to correct the sampling
variance. Thus, we used the sample size = Z2 × P × (1 - P) / d2 × deff, where Z = Z statistic for
a level of confidence (Z = 1.96), P = expected prevalence (p = 0.5), d = precision (d = 0.05), and deff = design effect (deff = 3). Therefore, the sample size calculated by the formula was 1,153. To minimize the effect of non-response and missing information, an additional 18% of the
calculated sample was added as per the recommendation of 10% to 20% for the non-response rate28. Thus, we determined the total sample size of 1,360. From the data collected, 1,354
samples were selected for the analyses excluding the data with incomplete information.
Measurement of Variables
Dependent variable
The following information was given to the participants before asking the particular question
on PA: “You do PA by taking part in sports, playing with friends, or walking to school, riding a bike, dancing, playing soccer, playing volleyball, etc.”, and “During the last seven days, on
how many days did you do any type of PA for a total of at least 60 minutes a day?”29. Physical
activity was measured using this single self-reported question, as it has been used in some previous studies13,15,30. The options given to answer were from zero to seven days. Based on
the WHO recommendation of at least 60 minutes of PA each day, adolescents were classified
into two groups: those who met the recommendation for all days in the last week preceding
the survey, grouped as sufficiently physically active, and those who did not comply with this standard, grouped as inactive or insufficiently physically active group.
Independent variables
For smoking and alcohol consumption, current users were those who had smoked or drank alcohol within the last 30 days before the survey, and former smokers or former drinkers were those who had smoked or drank alcohol at least once in their lives. The option “do not remember” was treated as a missing value. “In the last seven days, how many times did you eat vegetables?” was asked to find out the vegetable consumption of the participants. The options were: none in the last seven days, once or twice a week, three to four times a week, five to six times a week, once a day, and at least twice a day. To assess fruit consumption, participants were asked the following question: “In the last seven days, how many times did you eat fruit?” The options were the same as those for vegetable consumption. We asked “Are you participating in any activity after school that helps you to earn money for your family, personal expenses, or any other end?” to measure whether the participants worked after school. To determine the degree of parental supervision of the adolescents, we asked them how often their parents or guardians checked their homework during the past 30 days. Participants could choose from always, most of the time, sometimes, rarely, and never. The question “How often did you spend time with your parents or guardians during the past 30 days?” was asked to assess the time spent with parents, and the options were similar to that of parental supervision. We also asked “How many days a week do you attend a physical education class at school?”, and the responses were categorized as either less than five or five or more regular physical education classes. Moreover, we asked them “What is your family’s economic status?”, and adolescents could choose between the high, above average, average, below average, and low options. For the question of how they would rate their health in general, responses were dichotomized into excellent, very good, or good, and fair or poor. For perceived body weight, we asked “How do you perceive your body weight?” The options of very underweight or underweight were grouped into the underweight group, slightly overweight, overweight, or very overweight were grouped into the overweight group, and normal weight was used as the reference category.
Information Collection
A self-administered standard questionnaire was provided to the selected students in their respective classrooms. Ten trained enumerators gave a brief orientation on the objectives
of the study and ways to fill the questionnaire before collecting the information. As a tool to collect information, the GSHS Questionnaire was slightly modified and translated into Spanish. The frequencies of fruit and vegetable intake were also modified in terms of the
recall period of seven days instead of the 30 days in the original questionnaire16. The GSHS
Questionnaire is a self-administered questionnaire to assess behavioral risk factors and
protective factors in adolescents29. This survey was voluntary and anonymous. Teachers
and school staff were not allowed to attend the students while filling the questionnaire. We
did not provide any incentive for subjects to participate in the survey.
Statistical Analysis
We analyzed the data collected using the Statistical Package for the Social Sciences (SPSS) version 21 for Windows (IBM Corp.: Armonk, NY, USA). We carried out Pearson chi-square
analyses. Poisson regression with robust variance was performed using generalized linear
models to estimate prevalence ratios (PR) of insufficient PA as per the recommendation
provided by Barros and Hirakata31. School was adjusted as a categorical variable in the
multivariable analysis. We performed crude and adjusted prevalence ratios (APR) with 95%
confidence intervals (CI). In addition, we found no effect of multicollinearity between the independent variables (variance inflation factor < 3).
Ethical Approval
We obtained ethical approval for the study from the Institutional Review Board of the Wonju
Campus of Yonsei University (IRB 1041849-201510-BM-092-03) and from the Dirección
Regional de Salud (DIRESA Callao, Peru). Consent was also given in advance by each school
administration, as well as the parents or guardians of the participants. There were no refusals
to participate in the study. Informed consent was provided by the individual students before
they filled out the questionnaire.
RESULTS
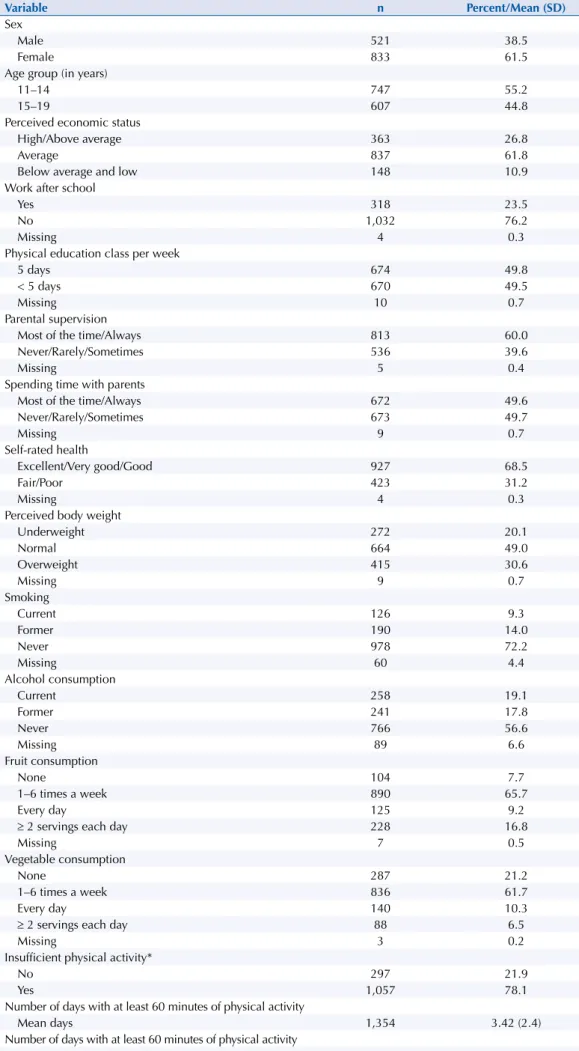
Most participants were female (61.5%) and were in the age group of 11 to 14 years (55.2%). Of the total respondents, 61.8% reported their economic status as average, and 23.5% reported they worked after school. Approximately half of the students (49.8%) reported physical education classes every day in the last week. Among them, 60% mentioned that their parents always or most of the time checked their homework, and 49.6% reported that their parents always or most of the time spent time with them during the past 30 days. Of the total, 31.2% reported fair or poor self-rated health and 30.6% perceived themselves as overweight, while 9.3% and 19.1% reported they smoked and drank alcohol, respectively, in the last 30 days preceding the survey. Only 16.8% and 6.5% of the respondents consumed two or more than two servings of fruits and vegetables per day in the last 30 days, respectively. Of the total, 78.1% of the adolescents did not meet the recommended level of PA each day for all days in the last week before the survey, and 11.2% did not meet the standard even for
a single day within the studied week. The average number of days that adolescents followed
the recommendation of PA in the week was 3.4 days (Table 1).
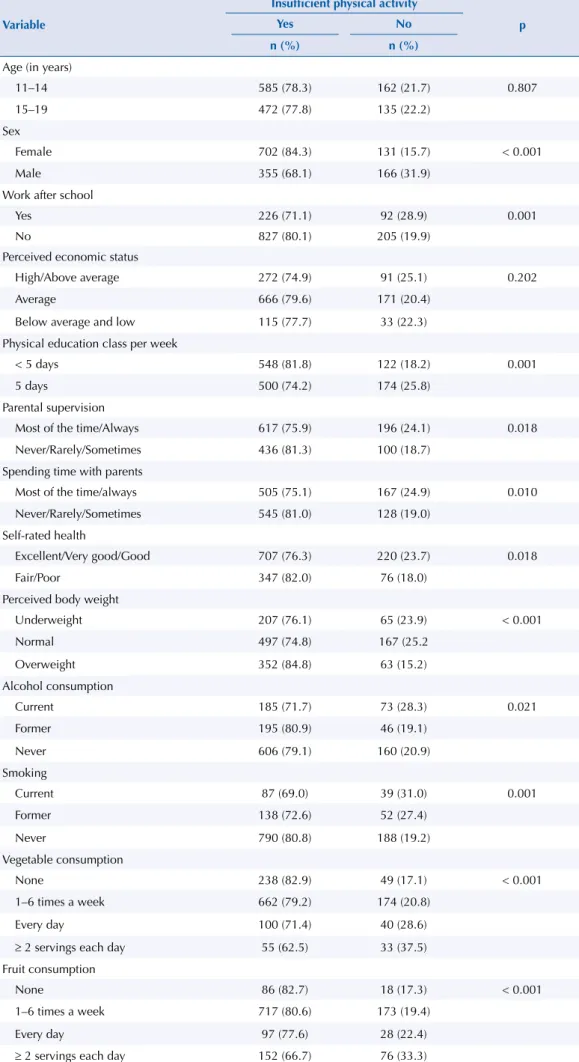
Table 2 shows the results of the chi-square test between the independent variables and
insufficient PA. Work after school, physical education class, parental supervision, and
spending time with their parents, as well as self-rated health, perceived body weight, alcohol
consumption, smoking, and vegetable and fruit consumption had significant associations with insufficient PA.
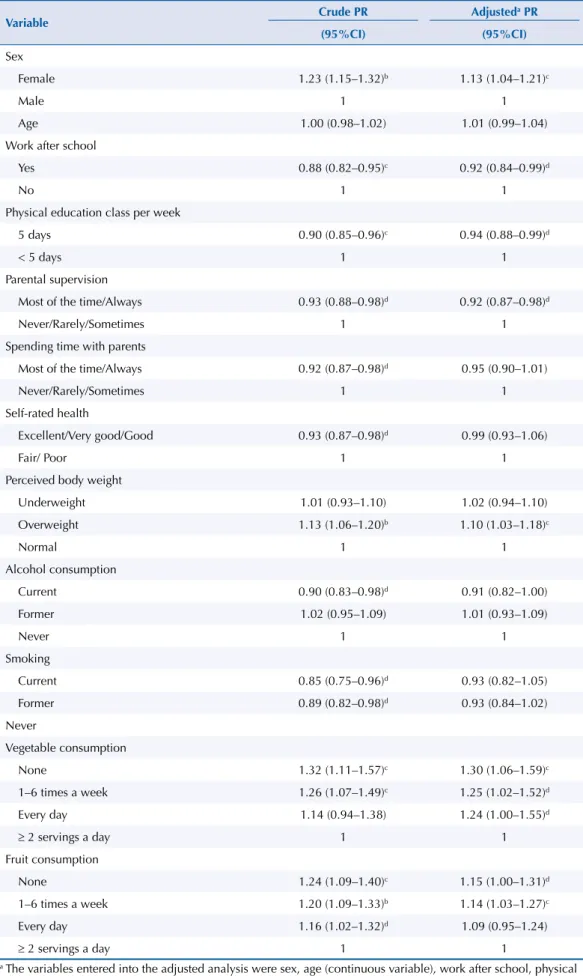
We computed the crude and adjusted prevalence ratios of insufficient PA for the explanatory
variables in Table 3. According to this multivariable analysis, female adolescents were 13%
more likely to report insufficient PA. Adjusted prevalence ratio (APR) of insufficient PA was
0.92 among adolescents who were involved with work after school, which indicates lower
probability of insufficient PA among them. Adolescents who attended five physical education classes each week were also less likely to report insufficient PA than those who mentioned less than five physical education classes. In the same way, APR was less than one among
adolescents whose parents checked their homework. Adolescents who perceived themselves
as being overweight were more likely to report insufficient PA as compared to those who perceived themselves as having a normal weight. We found no significant association between alcohol consumption or smoking and insufficient PA in the adjusted model. Adolescents
who did not consume vegetables and those who consumed them 1–6 times were 30% and
25%, respectively, more likely to report insufficient PA compared to those who consumed
two or more servings in a day. In addition, adolescents who did not eat fruits and those who
ate fruits only 1–6 times a week were more likely to do insufficient PA, compared to those
who ate two or more servings of fruit each day [no fruits (APR = 1.15, 95%CI 1.00–1.31) and
Table 1. General characteristics of the study population and prevalence of insufficient physical activity. (n = 1,354)
Variable n Percent/Mean (SD)
Sex
Male 521 38.5
Female 833 61.5
Age group (in years)
11–14 747 55.2
15–19 607 44.8
Perceived economic status
High/Above average 363 26.8
Average 837 61.8
Below average and low 148 10.9
Work after school
Yes 318 23.5
No 1,032 76.2
Missing 4 0.3
Physical education class per week
5 days 674 49.8
< 5 days 670 49.5
Missing 10 0.7
Parental supervision
Most of the time/Always 813 60.0
Never/Rarely/Sometimes 536 39.6
Missing 5 0.4
Spending time with parents
Most of the time/Always 672 49.6
Never/Rarely/Sometimes 673 49.7
Missing 9 0.7
Self-rated health
Excellent/Very good/Good 927 68.5
Fair/Poor 423 31.2
Missing 4 0.3
Perceived body weight
Underweight 272 20.1
Normal 664 49.0
Overweight 415 30.6
Missing 9 0.7
Smoking
Current 126 9.3
Former 190 14.0
Never 978 72.2
Missing 60 4.4
Alcohol consumption
Current 258 19.1
Former 241 17.8
Never 766 56.6
Missing 89 6.6
Fruit consumption
None 104 7.7
1–6 times a week 890 65.7
Every day 125 9.2
≥ 2 servings each day 228 16.8
Missing 7 0.5
Vegetable consumption
None 287 21.2
1–6 times a week 836 61.7
Every day 140 10.3
≥ 2 servings each day 88 6.5
Missing 3 0.2
Insufficient physical activity*
No 297 21.9
Yes 1,057 78.1
Number of days with at least 60 minutes of physical activity
Mean days 1,354 3.42 (2.4)
Number of days with at least 60 minutes of physical activity
None 125 11.2
Table 2. Association of the independent variables with insufficient physical activity in adolescents.
Variable
Insufficient physical activity
p
Yes No
n (%) n (%)
Age (in years)
11–14 585 (78.3) 162 (21.7) 0.807
15–19 472 (77.8) 135 (22.2)
Sex
Female 702 (84.3) 131 (15.7) < 0.001
Male 355 (68.1) 166 (31.9)
Work after school
Yes 226 (71.1) 92 (28.9) 0.001
No 827 (80.1) 205 (19.9)
Perceived economic status
High/Above average 272 (74.9) 91 (25.1) 0.202
Average 666 (79.6) 171 (20.4)
Below average and low 115 (77.7) 33 (22.3)
Physical education class per week
< 5 days 548 (81.8) 122 (18.2) 0.001
5 days 500 (74.2) 174 (25.8)
Parental supervision
Most of the time/Always 617 (75.9) 196 (24.1) 0.018
Never/Rarely/Sometimes 436 (81.3) 100 (18.7)
Spending time with parents
Most of the time/always 505 (75.1) 167 (24.9) 0.010
Never/Rarely/Sometimes 545 (81.0) 128 (19.0)
Self-rated health
Excellent/Very good/Good 707 (76.3) 220 (23.7) 0.018
Fair/Poor 347 (82.0) 76 (18.0)
Perceived body weight
Underweight 207 (76.1) 65 (23.9) < 0.001
Normal 497 (74.8) 167 (25.2
Overweight 352 (84.8) 63 (15.2)
Alcohol consumption
Current 185 (71.7) 73 (28.3) 0.021
Former 195 (80.9) 46 (19.1)
Never 606 (79.1) 160 (20.9)
Smoking
Current 87 (69.0) 39 (31.0) 0.001
Former 138 (72.6) 52 (27.4)
Never 790 (80.8) 188 (19.2)
Vegetable consumption
None 238 (82.9) 49 (17.1) < 0.001
1–6 times a week 662 (79.2) 174 (20.8)
Every day 100 (71.4) 40 (28.6)
≥ 2 servings each day 55 (62.5) 33 (37.5)
Fruit consumption
None 86 (82.7) 18 (17.3) < 0.001
1–6 times a week 717 (80.6) 173 (19.4)
Every day 97 (77.6) 28 (22.4)
Table 3. Crude and adjusted prevalence ratios (PR) of insufficient physical activity for explanatory variables in adolescents.
Variable Crude PR Adjusted
a PR
(95%CI) (95%CI)
Sex
Female 1.23 (1.15–1.32)b 1.13 (1.04–1.21)c
Male 1 1
Age 1.00 (0.98–1.02) 1.01 (0.99–1.04)
Work after school
Yes 0.88 (0.82–0.95)c 0.92 (0.84–0.99)d
No 1 1
Physical education class per week
5 days 0.90 (0.85–0.96)c 0.94 (0.88–0.99)d
< 5 days 1 1
Parental supervision
Most of the time/Always 0.93 (0.88–0.98)d 0.92 (0.87–0.98)d
Never/Rarely/Sometimes 1 1
Spending time with parents
Most of the time/Always 0.92 (0.87–0.98)d 0.95 (0.90–1.01)
Never/Rarely/Sometimes 1 1
Self-rated health
Excellent/Very good/Good 0.93 (0.87–0.98)d 0.99 (0.93–1.06)
Fair/ Poor 1 1
Perceived body weight
Underweight 1.01 (0.93–1.10) 1.02 (0.94–1.10)
Overweight 1.13 (1.06–1.20)b 1.10 (1.03–1.18)c
Normal 1 1
Alcohol consumption
Current 0.90 (0.83–0.98)d 0.91 (0.82–1.00)
Former 1.02 (0.95–1.09) 1.01 (0.93–1.09)
Never 1 1
Smoking
Current 0.85 (0.75–0.96)d 0.93 (0.82–1.05)
Former 0.89 (0.82–0.98)d 0.93 (0.84–1.02)
Never
Vegetable consumption
None 1.32 (1.11–1.57)c 1.30 (1.06–1.59)c
1–6 times a week 1.26 (1.07–1.49)c 1.25 (1.02–1.52)d
Every day 1.14 (0.94–1.38) 1.24 (1.00–1.55)d
≥ 2 servings a day 1 1
Fruit consumption
None 1.24 (1.09–1.40)c 1.15 (1.00–1.31)d
1–6 times a week 1.20 (1.09–1.33)b 1.14 (1.03–1.27)c
Every day 1.16 (1.02–1.32)d 1.09 (0.95–1.24)
≥ 2 servings a day 1 1
a The variables entered into the adjusted analysis were sex, age (continuous variable), work after school, physical education class per week, parental supervision, spending time with parents, self-rated health, perceived body weight, alcohol consumption, smoking, vegetable consumption, fruit consumption, and school.
DISCUSSION
Nearly four-fifths (78%) of the surveyed adolescents did not meet the global recommendations
for PA for the last week before the survey, which is similar to the global prevalence2,3. Female
adolescents were more likely to report insufficient PA in the study, and this finding is consistent with most other studies conducted in different countries16,17,32–34. Most of the
studies on PA have considered at least 60 minutes of PA for all days in the last seven days;
however, some studies have classified at least 60 minutes of PA on five or more days each
week as an active level of exercise5. Although many studies indicate that PA decreases with
an increase in age, we observed no association between the age of the participants and
insufficient PA in the study, which may reflect that they are inactive from an early adolescent
age11,32,35. The behavior of PA may go from adolescence to adulthood. Participants who engage
in regular PA during adolescence are more likely to be adequately active in adulthood.
Therefore, the promotion of PA while persons are still of school age may be a successful
intervention against the epidemic of adult inactivity9.
A review study has stated that adolescents with higher socioeconomic status are more
physically active than those with a lower socioeconomic status36. Our study found that
adolescents who worked after school to make money for their family, personal expenses, or any other end were less likely to report being physically inactive. However, this does not
mean asking parents to involve their children in paid work after school. Instead, efforts to improve PA should search ways to increase leisure-time PA. There was no association
between self-reported socioeconomic status and PA in this study.
Adolescents who took part in regular physical education classes had lower odds of not
following the recommendation of PA. This finding is consistent with other studies in different
countries14,17. Interventions in schools have the potential to change the PA levels of young
persons, and other school-based strategies that encompass physical education and
after-school sports are some of the evidence-based interventions to tackle insufficient PA11,37.
Hoehner et al. (2008) have also recommended that the implementation of school physical education programs should be strongly encouraged to promote the health of Latin American
children38. In Peru, a Ministerial Resolution establishes Physical Education as a required
class for the Primary and Secondary level, with two pedagogical sessions of 45 minutes per
week27. As in our study, adolescents whose parents almost always checked their homework
were less likely to be physically inactive than those who had less involved parents among
South East Asian adolescents30. Systematic review studies have therefore concluded that
parental support has an influence on the PA level of adolescents11,17.
In our study, we found a significant relation between PA and self-rated health in the chi-square analysis; however, insufficient PA was not significantly associated with self-rated health in
the multivariable analysis. A previous study found that physical activity of at least 1 hour each day for three or more days per week was associated with a reduced likelihood of poor
or fair self-rated health. The difference might be due to the cut-off value of sufficient PA; at least one hour of PA for ≥ 3 days was measured as an active lifestyle in the aforementioned
study39. A significant association of low self-rated health has also been found by a follow-up
study with boys active for < 4 hours per week compared with those active for > 4 hours per
week among Swedish adolescents40. Thus, the measurement of PA and other covariates
might influence the association between PA and self-rated health.
In this study, participants who perceived themselves as overweight had higher odds of being
physically inactive compared to those who perceived themselves as normal. This finding is
consistent with a study that has stated that German adolescents who judged themselves as
“too fat” were affected by a higher risk of less frequent PA41. Similarly, persons who perceive
themselves as underweight were also slightly more likely to be inactive as compared to a
person of normal weight42.Body image rather than body mass index is an important factor
The General Law for the Prevention and Control of the Risks from Tobacco Consumption
and the Law that regulates the commercialization, consumption, and advertising of alcoholic beverages established, in 2006, 18 as the legal age for smoking and consumption
of alcoholic beverages in Peru44,45. Nevertheless, a large proportion of adolescents smokes
and drinks. However, we observed no association between PA and alcohol consumption and smoking in the study. Smoking has been found to be associated with PA level among
Taiwanese adolescents30. A review study has suggested that adolescents who participate in
sports reported higher levels of alcohol consumption but lower levels of cigarette smoking46.
Insufficient PA and an unhealthy diet are the leading risk factors for non-communicable diseases7.
In a study, adolescents consuming inadequate fruits and vegetables were more likely to report being physically inactive; in other words, the study has found that the most active adolescents consumed fruit and vegetables more frequently than their less-active peers34. A study with Brazilian
adolescents has also revealed that those who consumed fewer servings of fruit and vegetable a day had a greater chance of being inactive15. Another study with Southeast Asian adolescents has
found that those who ate less than three servings of vegetables each week were more likely to not
follow the recommendations of PA30. However, we cannot conclude that an improved healthy
diet will improve PA. Instead, overall healthy habits are associated with each other.
Based on the multivariable Poisson regression analysis, sex, physical education class, parental support, perceived body weight, and fruit and vegetable consumption as correlates were consistent with other studies, whereas age, work after school, self-reported socioeconomic
status, smoking, and alcohol consumption were different findings in our study.
This study has some limitations. First, as the study is based on a cross-sectional assessment,
we cannot draw causal inferences for explanatory variables based on our results. Second,
there could be other correlates of PA that we did not assess in the study. This study did not include variables on enabling environments for PA at home and in the community. Third, as
all the measurements were self-reported, there is room for possible reporting bias, in which the participants may underreport or over report their behaviors. Fourth, the question about
PA used did not specifically include items about household chores, and it did not provide any instructions specifically about the treatment of physical activity during the physical education class. Thus, there might be some room for underreporting of the status of PA.
CONCLUSIONS
Approximately 80% of the adolescents did not meet the recommendation of PA in the last week before the survey. Female respondents, respondents who perceived themselves as overweight, and respondents who consumed an inadequate amount of vegetables and fruits
were more likely to report insufficient PA, whereas respondents who worked after school,
had more physical education classes, and had parental supervision were less likely to do
insufficient PA. Efforts to improve PA in adolescents should try to enhance leisure-time PA,
parental support, physical education classes, healthy dietary behaviors, and normal body
weight maintenance. Healthy dietary habits are significantly correlated with PA, which may
be because overall healthy habits are associated with each other; thus, this supports the need
for an integrated approach for health promotion in adolescents. A joint effort of the family
and school may contribute to promote PA among children and adolescents.
REFERENCE
1. World Health Organization. Physical activity. Geneva: WHO; 2015 [cited 2016 Apr 1]. (Fact Sheet, 385). Available from: http://www.who.int/mediacentre/factsheets/fs385/en/
3. Hallal PC, Andersen LB, Bull FC, Guthold R, Haskell W, Ekelund U, et al. Global physical activity levels: surveillance progress, pitfalls, and prospects. Lancet. 2012;380(9838):247-57. https://doi.org/10.1016/S0140-6736(12)60646-1
4. Guthold R, Cowan MJ, Autenrieth CS, Kann L, Riley LM. Physical activity and sedentary behavior among schoolchildren: a 34-country comparison. J Pediatr. 2010;157(1):43-49.e1. https://doi.org/10.1016/j.jpeds.2010.01.019
5. Dumith SC, Domingues MR, Gigante DP, Menezes AM, Kohl HW. Prevalence and correlates of physical activity among adolescents from Southern Brazil. Rev Saude Publica. 2010;44(3):457-67. https://doi.org/10.1590/S0034-89102010000300009
6. Pan American Health Organization. Global School-based Student Health Survey, Peru. Washington (DC): PAHO; 2010 [cited 2016 Apr 7]. (Fact Sheet 2010). Available from: http:// www.who.int/chp/gshs/2010_GSHS_FS_Peru.pdf?ua=1
7. World Health Organization. Global health risks: mortality and burden of disease attributable to selected major risks. Geneva: WHO; 2009 [cited 2017 Nov 30]. Available from: http://www. who.int/healthinfo/global_burden_disease/GlobalHealthRisks_report_full.pdf
8. Lee IM, Shiroma EJ, Lobelo F, Puska P, Blair SN, Katzmarzyk PT. Effect of physical inactivity on major non-communicable diseases worldwide: an analysis of burden of disease and life expectancy. Lancet. 2012;380(9838):219-29. https://doi.org/10.1016/S0140-6736(12)61031-9
9. Telama R, Yang X, Viikari J, Välimäki I, Wanne O, Raitakari O. Physical activity from childhood to adulthood: a 21-year tracking study. Am J Prev Med. 2005;28(3):267-73. https://doi.org/10.1016/j.amepre.2004.12.003
10. Azevedo MR, Araújo CL, Silva MC, Hallal PC. Tracking of physical activity from
adolescence to adulthood: a population-based study. Rev Saude Publica. 2007;41(1):69-75. https://doi.org/10.1590/S0034-89102007000100010
11. Singh AS, Mulder C, Twisk JW Mechelen W, Chinapaw MJ. Tracking of childhood overweight into adulthood: a systematic review of the literature. Obes Rev. 2008;9(5):474-88.
https://doi.org/10.1111/j.1467-789X.2008.00475.x
12. Biddle SJ, Gorely T, Stensel DJ. Health-enhancing physical activity and sedentary behaviour in children and adolescents. J Sports Sci. 2004;22(8):679-701. https://doi.org/10.1080/02640410410001712412
13. Bauman AE, Reis RS, Sallis JF, Wells JC, Loos RJ, Martin BW. Correlates of physical activity: why are some people physically active and others not? Lancet. 2012;380(9838):258-71. https://doi.org/10.1016/S0140-6736(12)60735-1
14. Scully M, Dixon H, White V, Beckmann K. Dietary, physical activity and sedentary behaviour among Australian secondary students in 2005. Health Promot Int. 2007;22(3):236-45. https://doi.org/10.1093/heapro/dam021
15. de Rezende LFM, Azeredo CM, Canella DS, Claro RM, Castro IRR, Levy RB, et al. Sociodemographic and behavioral factors associated with physical activity in Brazilian adolescents. BMC Public Health. 2014;14:485. https://doi.org/10.1186/1471-2458-14-485
16. Silva DAS, Silva RJS. Association between physical activity level and consumption of fruit and vegetables among adolescents in northeast Brazil. Rev Paul Pediatr. 2015;33(2):167-73. https://doi.org/10.1016/j.rpped.2014.09.003
17. Van der Horst K, Paw MJ, Twisk JW, Van Mechelen W. A brief review on correlates of physical activity and sedentariness in youth. Med Sci Sports Exerc. 2007;39(8):1241-50. https://doi.org/10.1249/mss.0b013e318059bf35
18. Leech RM, McNaughton SA, Timperio A. The clustering of diet, physical activity and sedentary behavior in children and adolescents: a review. Int J Behav Nutr Phys Act. 2014;11:4.
https://doi.org/10.1186/1479-5868-11-4
19. The World Bank. World Bank Country and Lending Groups: country classifications. Washington (DC); 2017 [cited 2017 Jun 27] Available from: https://datahelpdesk.worldbank.org/
knowledgebase/articles/906519#Upper_middle_income
20. United Nations Development Programme. Human Development Report 2016: human
development for everyone. New York: USA; 2017 [cited 2017 Jun 26]. Available from: http://hdr. undp.org/sites/default/files/2016_human_development_report.pdf
population (2009-2010)]. Rev Peru Med Exp Salud Publica. 2012;29(3):303-13. Spanish. https://doi.org/10.1590/S1726-46342012000300003
22. Preston EC, Ariana P, Penny ME, Frost M4, Plugge E. Prevalence of childhood overweight and obesity and associated factors in Peru. Rev Panam Salud Publica. 2015 [cited 2017 Jun 26];38(5):472-8. Available from: https://scielosp.org/pdf/rpsp/2015.v38n6/472-478/en
23. Mispireta ML. [Determining factors of overweight and obesity in children at school age in Peru]. Rev Peru Med Exp Salud Publica. 2012;29(3):361-5. Spanish. https://doi.org/10.17843/rpmesp.2012.293.370
24. Programa de las Naciones Unidas para el Desarrollo. Informe sobre Desarrollo Humano Perú 2013: cambio climático y territorio: desafíos y respuestas para un futuro sostenible. Lima: PNUD; 2013 [cited 2017 Jun 26]. Available from: http://www.repositorio.cedro.org.pe/bitstream/ CEDRO/143/1/Informe%20Sobre%20Desarrollo%20Humano%20Per%C3%BA%202013%20 -%203036-DR.pdf
25. Gobierno Regional del Callao, Dirección Regional de Salud del Callao. Análisis de la Situación de Salud de la Región Callao 2015. Callao (PE); 2016 [cited 2017 Jun 25]. Available from: http://www. diresacallao.gob.pe/wdiresa/documentos/boletin/epidemiologia/asis/ASIS_Regional_2015.pdf
26. Ministerio de Salud del Perú, Instituto de Gestión de Servicios de Salud, Red de Salud Túpac Amaru. Análisis de Situación de Salud de Red de Salud Túpac Amaru 2016. Lima (PE); 2016 [cited 2017 Jun 25]. Available from: http://www.minsarsta.gob.pe/epidemiologia/sala%20 situacional%202016/Resolución%20Directoral%20N°%20306.pdf
27. Ministerio de Educación del Perú. Resolución Ministerial Nº 0440-200-ED, de 15 de diciembre de 2008. Aprueban el “Diseño Curricular Nacional de Educación Básica Regular”. Diario Oficial
El Peruano. 16 dic 2008 [cited 26 Dec 2016]. Available from: http://www.elperuano.com.pe/
NormasElperuano/2008/12/16/291133-1.html
28. Naing L, Winn T, Rusli BN. Practical issues in calculating the sample size for prevalence studies.
Arch Orofac Sci. 2006;1:9-14.
29. World Health Organization. Global School-Based Student Health Survey (GSHS)2013: core questionnaire modules. Geneva: WHO; 2013 [cited 2016 Apr 4]. Available from: http://www. who.int/chp/gshs/GSHS_Core_Modules_ 2013_English.pdf .
30. Peltzer K, Pengpid S. Leisure time physical inactivity and sedentary behaviour and lifestyle correlates among students aged 13–15 in the Association of Southeast Asian Nations (ASEAN) Member States, 2007-2013. Int J Environ Res Public Health. 2016;13(2):217. https://doi.org/10.3390/ijerph13020217
31. Barros AJ, Hirakata,VN. Alternatives for logistic regression in cross-sectional studies: an empirical comparison of models that directly estimate the prevalence ratio. BMC Med Res
Methodol. 2003;3:21. https://doi.org/10.1186/1471-2288-3-21
32. Li M, Dibley MJ, Sibbritt D, Yan H. Factors associated with adolescents’ physical inactivity in Xi’an City, China. Med Sci Sports Exerc. 2006;38(12):2075-85. https://doi.org/10.1249/01.mss.0000233802.54529.87
33. Chen LJ, Haase AM, Fox KR. Physical activity among adolescents in Taiwan. Asia Pac J Clin Nutr. 2007 [cited 2017 Nov 30];16(2):354-61. Available from: http://apjcn.nhri.org.tw/server/APJCN/16/2/354.pdf
34. Kelishadi R, Ardalan G, Gheiratmand R, Gouya MM, Razaghi EM, Delavari A, et al. Association of physical activity and dietary behaviours in relation to the body mass index in a national sample of Iranian children and adolescents: CASPIAN Study. Bull World Health Organ. 2007;85(1):19-26. https://doi.org/10.2471/BLT.06.030783
35. Jekauc D, Reimers AK, Wagner MO, Woll A. Prevalence and socio-demographic correlates of the compliance with the physical activity guidelines in children and adolescents in Germany. BMC
Public Health. 2012;12:714. https://doi.org/10.1186/1471-2458-12-714
36. Stalsberg R, Pedersen AV. Effects of socioeconomic status on the physical activity in
adolescents: a systematic review of the evidence. Scand J Med Sci Sports. 2010;20(3):368-83. https://doi.org/10.1111/j.1600-0838.2009.01047.x
37. Heath GW, Parra DC, Sarmiento OL, Andersen LB, Owen N, Goenka S, et al. Evidence-based intervention in physical activity: lessons from around the world. Lancet. 2012;380(9838):272-81. https://doi.org/10.1016/S0140-6736(12)60816-2
39. Sharma B, Nam EW, Kim D, Yoon YM, Kim Y, Kim HY. Role of gender, family, lifestyle and psychological factors in self-rated health among urban adolescents in Peru: a school-based cross-sectional survey. BMJ Open. 2016;6(2):e010149. https://doi.org/10.1136/bmjopen-2015-010149
40. Elinder LS, Sundblom E, Rosendahl KI. Low physical activity is a predictor of thinness and low self-rated health: gender differences in a Swedish cohort. J Adolesc Health. 2011;48(5):481-6. https:/doi.org/10.1016/j.jadohealth.2010.08.005
41. Finne E, Bucksch J, Lampert T, Kolip P. Age, puberty, body dissatisfaction, and physical activity decline in adolescents. Results of the German Health Interview and Examination Survey (KiGGS). Int J Behav Nutr Phys Act. 2011;8:119. https://doi.org/10.1186/1479-5868-8-119
42. Baharudin A, Zainuddin AA, Manickam MA, Ambak R, Ahmad MH, Naidu BM, et al. Factors associated with physical inactivity among school-going adolescents data from the Malaysian School-Based Nutrition Survey 2012. Asia Pac J Public Health. 2014;26 (5 Suppl): 27S-35S. https://doi.org/10.1177/1010539514543682
43. Kantanista A, Osi ski W, Borowiec J, Tomczak M, Król-Zieli ska M. Body image, BMI, and physical activity in girls and boys aged 14-16 years. Body Image. 2015;15:40-3. https://doi.org/10.1016/j.bodyim.2015.05.001
44. Congreso de la República del Perú. Ley Nº 28705 Ley General para la prevención y control de los riesgos del consumo del tabaco. Diario Oficial El Peruano. 6 abr 2006 [cited 2016 Dec 26]; Poder Legislativo: 316197. Available from: https://www.minsa.gob.pe/portada/Especiales/2017/ tabaco/documentos/Ley28705.pdf
45. Congreso de la República del Perú. Ley Nº 28681, 3 de marzo del 2006. Ley que regula la comercialización, consumo y publicidad de bebidas alcohólicas. Diario Oficial El Peruano. 3 mar 2006 [cited 2016 Dec 26]. Available from: http://docs.peru.justia.com/federales/ leyes/28681-mar-3-2006.pdf
46. Lisha NE, Sussman S. Relationship of high school and college sports participation with alcohol, tobacco, and illicit drug use: a review. Addict Behav. 2010;35(5):399-407. https://doi.org/10.1016/j.addbeh.2009.12.032
Funding: Korea International Cooperation Agency (KOICA) under the title of “Lima and Callao, Peru, Health Promotion Program, 2014-2017 (Number P2013-00151-1)” in 2015.
Authors’ Contributions: Conception and design of the study: EWN, BS, RCC. Analysis and interpretation of
the data: BS. Writing of the study: BS, RCC. Critical revision of the study: EWN. Revision and finalization of the study: BS, RCC, EWN. Approval of the final study: BS, RCC, EWN. Supervision as the principal investigator: EWN.