FUNDAÇÃO GETULIO VARGAS
ESCOLA BRASILEIRA DE ADMINISTRAÇÃO PÚBLICA E DE EMPRESAS MESTRADO EXECUTIVO EM GESTÃO EMPRESARIAL
CHANGES OF TRADE PATTERNS OF THE BALTIC
STATES IN THE CONTEXT OF THE EUROPEAN UNION
INTEGRATION
EIVILE CIPKUTE
Rio de Janeiro - 2016DISSERTAÇÃO APRESENTADA À ESCOLA BRASILEIRA DE ADMINISTRAÇÃO PÚBLICA E DE EMPRESAS PARA OBTENÇÃO DO GRAU DE MESTRE
CHANGES OF TRADE PATTERNS OF THE BALTIC STATES IN THE CONTEXT OF THE EUROPEAN UNION INTEGRATION
Master’s thesis presented at Corporate International Master’s program, Escola Brasileira de Administração Pública, Fundação Getulio Vargas, as a requirement for obtaining the title of Master in Business Management
ADVISOR: PH.D. RONALDO PARENTE
Rio de Janeiro 2016
Cipkute, Eivile
Changes of trade patterns of the Baltic States in the context of the European Union integration / Eivile Cipkute. – 2016.
56 f.
Dissertação (mestrado) - Escola Brasileira de Administração Pública e de Empresas, Centro de Formação Acadêmica e Pesquisa.
Orientador: Ronaldo Couto Parente. Inclui bibliografia.
1. Relações internacionais. 2. Relações econômicas internacionais. 3. Comércio internacional. 4. União Européia - Países Bálticos. 5. Desenvolvimento econômico - Países Bálticos. I. Parente, Ronaldo Couto. II. Escola Brasileira de Administração Pública e de Empresas. Centro de Formação Acadêmica e Pesquisa. III. Título.
I would like to thank all of the staff and professors from FGV, ESADE, and Georgetown University for their honest contribution to the CIM program. I want to express my special thanks to the Academic Directors from all the institutions – Professors Marco Tulio Zanini, Pedro Parada and Jose Luis Guerrero – for their honest dedication to the program and the students.
I would like to acknowledge my thesis advisor, Professor Ronaldo Parente, who always took time to have a thorough look at my drafts and gave me constructive advice, feedback and professional support during my research.
List of Illustrations………...5
List of Abbreviations………....6
Abstract ………..……….….7
Introduction ……….8
1. Research Justification and Topic Relevance ………10
2. Research Objectives………...13
3. Theoretical Reference and Literature Review……….……….15
3.1. International Trade Policy ………...………..15
3.2. Gravity Model of Trade………...18
3.3. European Union and Baltic States………..20
4. Research Methodology………..……….….22
4.1. Research Model and Hypotheses …..……….22
4.2. Gravity Model Specification……….………..23
4.3. Data Used in Research……….……...26
4.4. Limitations of Research………..27
5. Analysis of Results………...28
5.1. Analysis of Trade Developments of Baltic States ………...……...28
5.2. Results of Gravity Model of Trade……….34
5.3. Testing of Hypotheses ………...37
5.4. Additional Gravity Model Estimates………..38
Conclusions……….………42
Recommendations for Further Research……….45
Annex………...46
List of Pictures
Picture 1. Evolution of Regional Trade Agreements (RTAs) in the World, 1948-2016…...17
Picture 2. Research Model……….22
Picture 3. GDP Annual Growth Rate of the Baltic States, 1996-2015……….….28
Picture 4. Estonia’s Export Dynamics with Top 10 Trade Partners………..……29
Picture 5. Latvia’s Export Dynamics with Top 10 Trade Partners………...….30
Picture 6. Lithuania’s Export Dynamics with Top 10 Trade Partners……….…..31
Picture 7. Baltic States Export Trends 1992-2015, in million USD.……….………32
Picture 8. Changes of Baltic States Exports to Russia, 2010-2015, %...33
List of Tables Table 1. List of Variables of the Gravity Equation to be used in the Research……….25
Table 2. Summary Statistics………...34
Table 3. Gravity Model Results………..35
ASEAN – Association of Southeast Asian Nations
CEPII – Centre for Prospective Studies and International Information CIS – Commonwealth of Independent States
EEC – European Economic Community EFTA – European Free Trade Area EU – European Union
FTA – Free Trade Agreement
GATT – General Agreement on Tariffs and Trade GDP – Gross Domestic Product
GNP – Gross National Product IFS – International Trade Statistics IMF – International Monetary Fund ITO – International Trade Organization
MERCOSUR – Mercado Común del Sur (Southern Common Market) NAFTA – North American Free Trade Agreement
RTA – Regional Trade Agreement
TPP – Trans-Pacific Partnership Agreement UN – United Nations
US – United States
VIF – Variance inflation factor
WDI – World Development Indicators WTO – World Trade Organization
International trade is the key element of globalization and closer economic and political cooperation between the countries. The thesis focuses on analyzing the regional integration effects on the trade patterns of the members of regional trading blocs. The analysis focuses on the EU as the regional formation, and the Baltic States as the members of this union. The Baltic States have undergone unique economic and political developments since gaining independence after the Soviet Union collapsed. Lessons learned from the Baltic States’ experience are unique and valuable for other countries and regions, which are undergoing similar transformations.
The main research method used in the thesis is the gravity model of trade, which rests on the key assumption that trade between the countries is defined by the size of the economies and the distance between the countries.
The gravity equation estimates showed that the membership of the Baltic States in the EU had a positive and significant effect on the export levels of the Baltic States to other EU members. On the other hand, the membership in the EU is not the main trade stimulating factor. The more important factor for the Baltic States’ exports is the common history of belonging to the former Soviet Union. Therefore, the longer lasting ties still remain important trade creating factors for the Baltic States. At the same time, analysis revealed that the economic ties of the Baltic States with the former Soviet Union members was diminishing significantly over time.
Introduction
International trade is the key element of globalization and closer economic and political cooperation between the countries. Country’s active participation in the global trade is also a path to economic growth and prosperity. The world trade liberalization has come a long way since the beginning. One of the major recent trends is the emergence of numerous regional trade agreements, instead of deepening worldwide trade liberalization arrangements. While both of the trade liberalization routes pave the way towards economic growth of the trading countries, regional trade agreements are more likely to promote other political and non-trade aspects of the partnering countries.
The recent upsurge in the number of regional trading blocs is currently high on the political agenda of many countries and global businesses, who are analyzing the effects of the regionalization on their business prospects. Thus, it is important to well understand the effects of participation in the trading block on the member countries’ trade.
In this context, the research question of the thesis is to find out what the regional integration effects on the trade patterns of the members of regional trading blocs are. The analysis focuses on the EU as the regional formation and Estonia, Latvia and Lithuania (the Baltic States) as the members of this union. The Baltic States have undergone unique economic and political developments since gaining independence after the Soviet Union collapsed. Lessons learned from Baltic States’ experience are unique and valuable for other countries and regions undergoing similar economic and policy transformations, in particular in Central and Eastern Europe and in other former Soviet Union countries.
Thus, the purpose of the thesis is to define the impact the integration into the EU has on the trade patterns of the Baltic States. The thesis also analyzes the effects of the external factors on the trade patterns of the Baltic States. The scientific area of the thesis is international economics. The topic analyzed in the thesis is relevant and important for these major aspects: political-economic, uniqueness of the Baltic region, international trade theory and business related perspective. The main target audience, for whom the research results will be relevant, are international policy experts, in particular, the ones specializing in the European integration issues. This audience also includes scholars of this policy area as well as public sector officials and politicians.
The most common tool in the literature to analyze trade patterns of the countries and the effects of various trade agreements is the gravity model of trade, which will is also used as the main research tool in this thesis.
The research, carried out in this thesis contributes to the body of studies of the Baltic region with the most recent results and economically and policy backed explanations about the changing patterns of the trade of the selected countries.
The thesis starts with the elaboration on the justification and relevance of the research topic, followed by definition of general and specific research objectives. The thesis provides a literature review and theoretical background, describes the research methodology, sources of information, and the limitations of the research. The thesis concludes with the analysis of the research results, followed by conclusions and recommendations.
1. Research Justification and Topic Relevance
The topic analyzed in the thesis is relevant and important for these major aspects: political-economic, uniqueness of the Baltic region, international trade theory, and business related perspective:
Political-economic perspective. The development of international trade was significantly dependent on the dominant theoretical thought at a particular time. In the post–World War II period, many nations pursued the objective of trade liberalization. One vehicle used to achieve this was the General Agreement on Tariffs and Trade (GATT), and its successor, the World Trade Organization (WTO). Although the GATT began with less than 50 member countries, the WTO now claims 162 members. Since GATT and WTO agreements commit all member nations to reduce trade barriers simultaneously, the agreements are sometimes referred to as a multilateral approach to trade liberalization (Suranovic, 2010). An alternative method used by many countries to achieve trade liberalization includes the formation of preferential trade arrangements, free trade areas, customs and economic unions. Since, many of these agreements involve geographically contiguous countries, these methods are referred to as a regional approach to trade liberalization. Agreements liberalizing trade at the bilateral, regional, and multilateral levels have been highly successful over the past five decades, and help to benefit many countries. Hence, the thesis will contribute to the body of research, analyzing the effects of economic unions on trade patterns of the countries, and in this way, will also contribute to the guiding of future political decisions of the countries, contemplating on creating or joining a trading bloc.
Uniqueness of the Baltic region. There are also a number of studies, specifically analyzing the effects of the EU integration on the Baltic States, and studies analyzing the trade patterns of the Baltic States in general. The research, carried out in this thesis, will contribute to the body of studies of the Baltic region with the most recent results, and economically and policy backed explanations to the changing patterns of the trade of the selected countries. The analysis of Baltic region trade patterns is unique due to its economic and policy developments. After regaining independence in the early 90s, the countries started political and economic transition by transforming their economies from planned ones into market-based ones. The policy of the countries also changed dramatically, with an extensive focus on integrating into Western Europe while
weakening dependence on the former Soviet bloc. Lessons learned from Baltic States’ experience are unique and valuable for other countries and regions undergoing major transformations.
International trade theory perspective. The thesis will rest on the theory of the gravity model of trade. The gravity model estimates the pattern of international trade. While the model’s basic form consists of factors that have more to do with geography and spatiality, the gravity model has been used to test hypotheses rooted in pure economic theories of trade as well. The model has been an empirical success because it accurately predicts trade flows between countries. While using the gravity model of trade as the main research tool, this thesis will contribute to the body of the scientific literature, developing the usage of the model.
Business related perspective. Finally, the thesis topic is also relevant from a business perspective, especially international. While taking the decision to expand a company’s activities internationally, the company must analyze many aspects of the potential new markets. An important aspect is to understand and to foresee how country’s political decisions might impact the business environment in that country. The findings of the research will help to guide the business analysis of country’s decisions to join trade blocs and economic unions. Therefore, the thesis topic is relevant and important in making international business decisions, when analyzing a country’s trade policy and trade orientation.
Having in mind several areas of the relevance of the thesis subject described above, the target audience of the research findings is also diverse. However, the main audience for whom the research results will be relevant are international policy experts, in particular the ones specializing in the European integration issues. This audience also includes scholars of this policy area as well as public sector officials and politicians. Research results will be also relevant to other scholars, looking into using the gravity model of trade to analyze trade flows among the countries in the Europe or any other region. Additional interest could also come from the business community, working in the Baltic region, who could use the research results in the process of setting their long term business strategy in the region.
Over the last half-century, the gravity model has become the workhorse of the applied international trade literature, and has given rise to literally thousands of publications and working papers covering a wide variety of regions, time periods, and sectors. The research, carried out in this thesis, falls within the group of research studies, which analyze the general
question of the trade flows in the region, and also look at the effect of the economic union on the trade creation and diversion with the members and non-members of that union.
2. Research Objectives
The research question of the thesis is to find out what the regional integration effects on the trade patterns of the new members of the economic union are. The analysis will focus on the EU as the economic union and the Baltic States as the members of this union.
The trade creation and trade diversion effects have been observed among many countries joining and/or forming the Free Trade Agreement (FTA), or deeper international arrangement such as the EU. The trade creation effect means that when a country joins the FTA, the trade volumes with other members of that FTA increases. The trade diversion effect means that after joining FTA, a country’s trade volumes with previous trade partners, who are not the members of FTA, will decrease. This is a theoretical approach to the question of FTA – the basic shape of the trade block.
However, as obvious from the history, FTAs often evolve into deeper forms of international cooperation. Also, often countries decide to form an economic union with the aim of deep economic and political cooperation. An example of that is the creation of the EU, where the purpose of this international formation was to create stronger ties within the members of the EU, which should eliminate the risk of armed conflict or war.
Despite the strong forces of the integration, there are also many other external factors affecting countries, belonging to the economic union. For example, the economic and political developments in major trade partners outside of the economic union may encourage or diminish the trade flows between economic union members and that country. In other words, one or another trade theory in today’s complex world often cannot explain the trends of international trade in its entirety. Therefore, the thesis analysis should reveal trade patterns, which could require more complex explanation than just an effect of the FTA.
Below are defined the general objective and the specific goals of the thesis.
General objective: to define the impact the integration into the EU has on the trade patterns of the Baltic States.
Specific objectives:
1. What effect the integration into the EU had on the trade patterns of the Baltic States? 2. What other external political and economic factors had significant effect on the trade patterns of the Baltic States?
3. How were the trade patterns of the Baltic States affected in the context of the Russian crisis of 1998, start of the integration into the EU in 2002, and the recent global crisis of 2008?
Thus, the research of the thesis will focus on analyzing the trade patterns of the Baltic States with their major trade patterns, specifically looking at the structural changes of the trade before and after the countries joined the EU.
3. Theoretical Reference and Literature Review
The theoretical and analytical background relevant for this thesis’ research area mainly comprises of the international trade policy and its development. Accordingly, this chapter overviews the international trade policy development, and the body of research in that respect. The chapter also analyzes the key analytical tools, used for the research on the effects of the FTAs, and also gives an overview of the studies in the area of trade and integration between the Baltic States and the EU.
3.1. International Trade Policy
Over time, economists have developed theories to explain the mechanisms of global trade. The main classical theories are assessing trade from the perspective of a country. By the mid-twentieth century, the theories began to shift to explain trade from a firm, rather than a country, perspective.
Mercantilism as a first trade theory was developed in the sixteenth century and stated that country’s wealth was determined by the amount of its gold and silver holdings. Mercantilists believed that a country should increase its holdings of gold and silver by promoting exports and discouraging imports (Morrow, 2010). In 1776, Adam Smith offered a new trade theory called absolute advantage, which focused on the ability of a country to produce goods more efficiently than another nation. David Ricardo, an English economist, introduced the theory of comparative advantage in 1817. Ricardo reasoned that even if a country had the absolute advantage in the production of many products, specialization and trade could still occur with other countries (Ricardo, 2001; Porter, 2011). In the early 1900s, two Swedish economists, Eli Heckscher and Bertil Ohlin, determined that the cost of any factor or resource in the country was a function of supply and demand. Their theory stated that countries would produce and export goods that required resources or factors that were in great supply and, therefore, cheaper production factors (Morrow, 2010).
In contrast to classical, country-based trade theories, the category of modern, firm-based theories emerged after World War II. Unlike the country-based theories, firm-based theories incorporate other product and service factors, including brand and customer loyalty, technology, and quality, into the understanding of trade flows. For example, Paul Krugman in 1979 offered a new trade theory, focusing on explaining the trade between similarly developed
countries. His theory involved two key assumptions: that consumers prefer a diverse choice of brands, and that production favors economies of scale (Krugman, 1979).
Hence, foundations of modern international trade theories were laid down in the 19th century. The theories were in one way or another advocating for the benefits of international and free trade. The factual trade and policy practice started to follow the mainstream liberal trade thought, up until the major economic and political events in the 20th century.
The Great Depression of 1929 was a major economic recession that ran from 1929 to the late 1930s. During this period, there was a great drop in trade and other economic indicators. The lack of free trade was considered by many as a principal cause of the depression causing stagnation and inflation (Gerber, 2013).
The turn of the nineteenth century was marked by rising protectionist moods, in particular, in the US (Bartlett, 1998; Crucini, 1994). Only during the World War II, the recession started to come to an end and countries started to rebuild the path to free trade. As a result, in 1944, 44 countries signed the Bretton Woods Agreement, intended to prevent national trade barriers, and to avoid depressions. It set up rules and institutions to regulate the international political economy: the International Monetary Fund and the International Bank for Reconstruction and Development (later divided into the World Bank and Bank for International Settlements).
The Bretton Woods Conference also recommended that participating governments reach an agreement to reduce obstacles to international trade. The recommendation was later embodied in the proposed International Trade Organization (ITO) to establish rules and regulations for international trade. However, due to the US resistance, the institution was never created and the less ambitious General Agreement on Tariffs and Trade (GATT) was adopted instead (Toye, 2012). Later in 1995, the GATT was replaced by the World Trade Organization (WTO).
As a result of worldwide trade liberalization efforts, the past 50 years have seen an exceptional growth in world trade. Merchandise exports grew on average by 6% annually. Total trade in 2000 was 22 times the level of 1950. GATT and the WTO have helped to create a strong and prosperous trading system contributing to unprecedented growth (Multilateral, 2016).
Most countries in the world are currently members of the WTO – a worldwide international trade regulating body. In parallel, many regions started deeper regional trade integration by creating FTAs, regional trading blocs and other international cooperation structures: EU, NAFTA (North American Free Trade Agreement), ASEAN (Association of
Southeast Asian Nations), EFTA (European Free Trade Area), MERCOSUR (Mercado Común del Sur), and many others.
FTAs, in particular, have become increasingly prevalent since the early 1990s. In 2016, according to WTO, there were more than 420 regional trade agreements in force, and all of the WTO members (163 countries) belonged to at least one of them (see picture 1).
Picture 1. Evolution of Regional Trade Agreements (RTAs) in the World, 1948-2016
Source: Regional Trade Agreements, WTO
As seen from the picture 1, the number of trade agreements in the world increased dramatically starting from the year 1991. There are many studies analyzing the effects of the trade agreements and other aspects of the global trade.
Studies, based on the large sets of empirical data, prove that FTAs have a positive effect on trade between the FTA members (Dür et al., 2014). Authors also analyze the compatibility between international trade agreements and regional trade blocs, and their contradictions and compliments to each other (Ohyama, 2016), and the role of smaller countries in shaping the international trade policy (Bollen et al., 2016). Other studies highlight the specificities of the dynamic FTAs as a new shape of international trade cooperation, which has a continued integration obligation between its members (Sieber-Gasser, 2016). Other researches look beyond the economic effects of FTAs and trade blocs, and analyze their social implications
through labor standards (Ferrante, 2016) and implications on public health (Gleeson & Friel, 2013).
More recent studies pay much attention to analyzing the effects of FTAs in global trade, arguing that the current vast number of ‘crisscrossing’ FTAs is beginning to make the world trade more difficult (Ratna & Sharma, 2016). The recent debate on the interaction between regional FTAs and international trade rules, based on WTO agreements, was mainly fueled by the negotiation of mega-trade agreements, such as Trans-Pacific Partnership (TPP), negotiated by 12 Pacific Rim countries. Recent studies analyze mega-trade agreements, and their effects on the global economy (Awuku, 2016; Schott et al., 2016). Other authors argue that the domino-like spread of regionalism is partly driven by ‘defensive’ FTAs, i.e., FTAs signed to reduce discrimination created by third-nation FTAs (Baldwin R & Jaimovich, 2012; Francois & Pindyuk, 2013; Baier et al., 2014).
Many authors chose to examine FTAs and their trade effects through an empirical analysis (Taguchi & Lee, 2016). The main analytical tool, used in most of the studies on FTAs, is the gravity model of trade (Costinot & Rodriguez-Clare, 2013; Anderson & Yotov, 2016; Taguchi & Lee, 2016). By using the gravity model of trade, authors are also trying to predict what impacts the forthcoming trade agreements will have on the welfare of the participating
countries (Aichele et al., 2014). The gravity model of trade has been a key analytical tool to
analyze and predict the effect of FTAs, namely by empirically defining the trade creation and diversion effects of the FTAs. Thus, due to its appropriateness and proven track-record, the gravity model of trade will also be used as the main analytical tool in this thesis.
3.2. Gravity Model of Trade
It has been known since 1960s that the size of bilateral trade flows between any two countries can be approximated by the same law of gravity, an analogy with the Newtonian theory of gravitation. Tinbergen (1962) was the first to outline this phenomena. Just as planets are mutually attracted in proportion to their sizes and proximity, countries trade in proportion to their respective GDPs and proximity (Bacchetta et al., 2013).
In the basic form of the gravity model, the amount of trade between two countries is assumed to increase proportionate to their size as measured by their national income (or GDP), and decrease proportionately to the cost of transport between them, as measured by the distance between their economic centers. Later researches have suggested to include population in the model as an additional measure of the size of the country and its economy. This model is
sometimes called the augmented gravity model. It is also common to specify the augmented gravity model using per capita income (or per capita GDP) instead of the overall national income. Per capita income expresses the level of economic development. Thus, the size of the economy and the level of economic development are the main attractive forces, stimulating or pull factors, of bilateral trade flows, while the main push or resisting factor is the distance between the trading countries. The distance expresses the impact of transaction costs on the intensity of trade relations. These pull and push factors are the traditional gravitational forces that influence bilateral trade flows (Pass & Tafenau, 2004).
Over the last half-century, the gravity model has become the workhorse of the applied international trade literature, and has given rise to literally thousands of publications and working papers covering a wide variety of regions, time periods, and sectors. For example, Disdier and Head (2008), in their meta-analysis of the effect of distance on trade, cover 1,052 separate estimates in 78 papers. By linking trade flows directly with economic size, and inversely with trade costs, usually proxied by geographical distance as an indicator of transport costs, the gravity model captures some deep regularities in the pattern of international trade and production. In this way, the gravity model has produced some of the clearest and most robust findings in empirical economics (Shepherd, 2012), and, therefore, have been commonly used to investigate trade flows and related policies.
Many of the studies, using the gravity model of trade, analyze the general question of the trade flows between one country and its trade partners or the region with an attempt to determine the key factors to that trade (Kristjánsdóttir, 2005; Papazoglou, 2007; Lampe, 2008;
Pietrzak & Lapinska, 2014). Other studies look more specifically to the trade flows of the certain products (Pelletiere & Reinert, 2004; Sarker & Jayasinghe, 2007). Researches also focus on different policy implications and factors, affecting the trade flows between the countries, for example, the effects of common currency (Bun & Klaassen, 2007), foreign direct investments (Gopinath & Echeverria, 2004), natural border effects (Nitsch, 2000), and transportation costs (Martinez & Suarez, 2005; Egger, 2008). Other studies focus on researching the different trade policy effects on the trade flows between the countries (Nowak-Lehmann et al., 2007; Grant & Lambert, 2008; Park & Park, 2008). Also, a number of researches have attempted to provide improvements of the performance of the gravity model by introducing methodological adjustments (Kalirajan, 2007; Baier & Bergstrand, 2009).
The research, carried out in this thesis falls within the group of research studies, which analyze the general question of the trade flows in the region, and also look at the effect of the
economic union on the trade creation and diversion with the members and non-members of that union.
3.3. European Union and Baltic States
The EU is a unique economic and political union between most of the European countries that together cover much of the continent. The evolution of what is today the EU, from a regional economic agreement among six neighboring states in 1958 to today’s hybrid intergovernmental and supranational organization across the European continent, stands as an unprecedented phenomenon. Dynastic unions for territorial consolidation were long the norm in Europe, but for such a large number of nation-states to cede some of their sovereignty to an overarching entity is unique.
The EU was created in the aftermath of the World War II as the first steps aimed at fostering economic cooperation; the idea being that countries who trade with one another become economically interdependent, and, so, are more likely to avoid conflict. The result was the European Economic Community (EEC) created in 1958, initially increasing the economic cooperation between six countries: Belgium, Germany, France, Italy, Luxembourg and the Netherlands (European, 2016). Since then, a huge single market has been created, and it continues to develop towards its full potential.
Although the EU is not a federation in the strict sense, it is a much deeper form of international cooperation compared to FTAs such as ASEAN, NAFTA or MERCOSUR. Furthermore, the EU also has certain attributes associated with independent nations: its own flag, currency (for 19 members), and law-making abilities. (CIA, 2015).
After the collapse of the Soviet Union, Baltic States started their integration into Western international structures, including United Nations (UN), WTO and the EU. Baltic States joined EU in 2004 together with other eight new countries. The new member countries included Estonia, Latvia, Lithuania, Poland, Czech Republic, Hungary, Slovakia, Slovenia, Cyprus and Malta.
Accession to the EU meant many things to the new member states. First, it created new trade opportunities, which could be utilized even more via the closer integration into the single market and harmonization of the laws. There are a number of studies analyzing the EU integration effects on trade (Richard & Evžen, 2013; Ravishankar & Stack, 2014; Pietrzak & Lapinska, 2014); others analyze the trade effects of EU monetary integration (Sledziewska &
States (Hacker & Einarsson, 2003) and the changes of trade patterns due to the EU integration process (Byers et al, 2000; Laaser & Scharder, 2002). Some studies, however, less often, analyze the trade patterns of the Baltic States in general, not linking this to the EU integration (Nakamura et al., 2012). Most of the researches analyzing EU membership effects on trade are using the gravity model equations as the main research tool.
The research carried out in this thesis contributes to the body of studies of the Baltic region with the most recent results and economically and policy backed explanations of the changing patterns of the trade of the selected countries. The lessons learned from the Baltic region are also useful for other countries and regions which are undergoing major and rapid economic transformations.
4. Research Methodology
This chapter provides the research model and hypotheses of the theses, defines the gravity model specification and describes the data to be used in the research.
4.1. Research Model and Hypotheses
The general objective of the thesis is to define the impact the integration into the EU has on the trade patterns of the Baltic States. The specific objectives are to assess what effect integration into the EU had on the trade patterns of the Baltic States, to assess what other external political and economic factors had significant effect on the trade patterns of the Baltic States, and to analyze how the trade patterns of the Baltic States were affected in the context of the Russian crisis of 1998, start of the integration into the EU in 2002, and the recent global crisis of 2008. In order to reach the objectives of the thesis, three hypotheses will be tested:
H1: Baltic States’ membership in the EU has created trade with members of the EU.
H2: The membership in the EU is not the main factor, apart from the core gravity model
variables, affecting the volumes of Baltic States’ trade with the EU members.
H3: The economic ties with former Soviet Union countries are not the main factor, apart
from the core gravity model variables, affecting the volumes of Baltic States trade.
The specific objectives and the hypotheses represent the factors whose influence on the patterns of the Baltic States trade will be analyzed. Based on this, the research model was defined:
Picture 2. Research Model
Source: Created by author
As is evident from the research objectives and hypotheses, the center-piece of the research model for this thesis is the trade patterns of the Baltic States. To analyze the trade
BALTIC STATES TRADE PATTERNS E C O N O M I C F A C T O R S GRAVITY MODEL GRAPHICAL ANALYSIS
patterns, few research methods are applied, including the empirical and graphical analysis and the expertise assessment. The main empirical tool used in the research is the gravity model of trade. The graphical analysis is applied to analyze the trends of the trade patterns of the Baltic States and the economic and political factors, affecting the levels of trade. Factors affecting the trade patterns of the Baltic States, among others, include Baltic States’ accession to the EU, introduction of euro in the EU and in the Baltic States, the 1998 Russian crisis, 2008 global financial crisis, Russia and Ukraine conflict of 2014.
The next section defines the specification and the steps of an empirical analysis, based on the gravity model of trade.
4.2. Gravity Model Specification
The gravity model of trade will be the main tool to carry out an empirical analysis of the trade patterns of the Baltic States. The gravity model specification for calculating trade volumes is typically of the following form (Ravishankar & Stack, 2014):
𝑇𝑅𝐴𝐷𝐸𝑖𝑗𝑡 = 𝛽0+ 𝛽1𝐺𝐷𝑃𝑖𝑡+ 𝛽2𝐺𝐷𝑃𝑗𝑡+ 𝛽3𝐷𝐼𝑆𝑇𝑖𝑗 + 𝛽4𝐺𝐷𝑃𝑃𝐶𝑖𝑡+ 𝛽5𝐺𝐷𝑃𝑃𝐶𝑗𝑡+
∑𝐺𝑔=1𝛾𝑔𝑍𝑖𝑗 +∑𝐾𝑘=1𝛼𝑘𝑋𝑖𝑗𝑡 + 𝜀𝑖𝑗𝑡 (1)
𝑇𝑅𝐴𝐷𝐸𝑖𝑗𝑡 are the bilateral trade flows between countries i and j over a given time period
t. Many studies use the sum of exports and imports as the dependent variable, however, exports
is the most commonly used dependent variable found in the trade flows gravity models (Kepaptsoglou et al., 2010). Some researches choose to use gross national product (GNP) to measure the size of the economy, however the GDP will be used in this research because it captures all the output of the economy. 𝐺𝐷𝑃𝑖𝑡and 𝐺𝐷𝑃
𝑗𝑡 denote the economic size of both
countries; 𝐷𝐼𝑆𝑇𝑖𝑗is the geographical distance between their economic centers; and 𝐺𝐷𝑃𝑃𝐶𝑖𝑡 and 𝐺𝐷𝑃𝑃𝐶𝑗𝑡 are the respective countries’ per capita income levels.
The separate role of per capita income in the gravity equation is to indirectly test the Linder hypothesis. Although the Linder hypothesis presents no empirical model, the theory suggests that if an importing country’s aggregated preferences for goods are similar to an exporting country’s consumption patterns, the country j will develop industries similar to the country i. In other words, the Linder hypothesis is concerned with income similarities (Fajgelbaum et al., 2011).
The gravity equation also includes a vector of time-invariant explanatory variables, 𝑍𝑖𝑗; a vector of time-varying trade-stimulating (pull) and trade resisting (push) variables, 𝑋𝑖𝑗𝑡; and the error term, 𝜀𝑖𝑗𝑡. The vector of time-invariant explanatory variables 𝑍𝑖𝑗 comprises dummy
variables, such as landlocked countries, common colonial ties, or indicator for institutional proximity. The vector of time-varying explanatory variables 𝑋𝑖𝑗𝑡 refers to the time sensitive variables such as exchange rates and accession to the trade blocs.
Some dummy variables (island, landlocked country, common borders) are used to reflect the hypotheses that transport costs increase with distance, and that they are higher for landlocked countries and islands but are lower for neighboring countries. Dummies for common language, adjacency or other relevant cultural features such as common colonial history are used to capture information costs. Search costs are lower for trade between countries whose business practices, competitiveness and delivery reliability are well known to one another. Tariff barriers are generally included in the form of dummies for the existence of regional trade agreements. Very few studies use information on bilateral tariffs, one reason being the lack of data over time (Bacchetta M. et al., 2013).
The most often explanatory variables used in the gravity equations are: landlocked, island, land area, common border, common language, common colonizer, current colony, ever colony, common country, institutional proximity, common currency, exchange rate, membership in the same trade block, bilateral trade tariffs (Derosa, 2008; Ravishankar & Stack, 2014).
The full gravity equation of trade determinants between Baltic States and their trade partners, to be used in the research, is specified as follows:
𝑙𝑛𝐸𝑋𝑃𝑖𝑗𝑡 = 𝛽0+ 𝛽1ln (𝐺𝐷𝑃)𝑖𝑡+ 𝛽2ln(𝐺𝐷𝑃)𝑗𝑡+ 𝛽3ln (𝐷𝐼𝑆𝑇)𝑖𝑗 + 𝛽4ln (𝐺𝐷𝑃𝑃𝐶)𝑖𝑗𝑡 +
𝛽5ln (𝑅𝐸𝑅)𝑖𝑡 + 𝛽6ln (𝑅𝐸𝑅)𝑗𝑡 + 𝛽7ln (𝐷_𝐶𝐵𝑂)𝑖𝑗+ 𝛽8ln (𝐷_𝐶𝐶𝑂)𝑖𝑗 + 𝛽9ln (𝐶_𝐸𝑈)𝑖𝑗𝑡 +
𝛽10ln (𝐷_𝐶𝐶𝑈)𝑖𝑗𝑡 + 𝜀𝑖𝑗𝑡 (2)
The gravity equation was log-linearized to give an empirical version of the model. Variables of the equation are explained in table 1.
Table 1. List of Variables of the Gravity Equation to be used in the Research
Variables Explanation
𝑬𝑿𝑷𝒊𝒋𝒕 Exports from country i to country j in USD producer prices (year 2010 = 100)
𝑮𝑫𝑷𝒊𝒕 Exporter GDP in USD producer prices (year 2010 = 100)
𝑮𝑫𝑷𝒋𝒕 Importer GDP in USD producer prices (year 2010 = 100)
𝑮𝑫𝑷𝑷𝑪𝒊𝒋𝒕 Exporter and importer GDP per capita difference in USD producer prices (year
2010 = 100)
𝑹𝑬𝑹𝒊𝒕 Exporter real exchange rate, in local currency units per USD in consumer
prices (year 2010 = 100)1
𝑹𝑬𝑹𝒋𝒕 Importer real exchange rate, in local currency units per USD in consumer prices (year 2010 = 100)
𝑫𝑰𝑺𝑻𝒊𝒋 Distance in kilometers between the capitals of the trading partners 𝑫_𝑪𝑩𝑶𝒊𝒋 Common border; = 1 if the countries share a dry land border, = 0 if not 𝑫_𝑪𝑪𝑶𝒊𝒋 Common colonizer; = 1 if both of the countries were part of the Soviet union,
= 0 if not
𝑪_𝑬𝑼𝒊𝒋𝒕 EU membership; =1 if both of the countries belong to the EU in the year t, =
0 if not
𝑫_𝑪𝑪𝑼𝒊𝒋𝒕 Common currency; = 1 if both of the countries have common currency in the
year t, = 0 if not
𝜷𝟎, 𝜷𝟏,… 𝜷𝟏𝟎 Parameters of the model
𝜺𝒊𝒋𝒕 Error term
Source: Created by author, based on Derosa (2008) and Ravishankar & Stack (2014)
Variables of island, landlocked, land area are not used in the gravity equation because, from the perspective of the Baltic States, all the countries have similar geographical positions, and this aspect is not considered as important. As countries do not share a common language, this variable is also not relevant. Institutional proximity, being difficult to quantify, is also omitted from the gravity equation of this research.
Variables 𝐸𝑋𝑃𝑖𝑗𝑡, 𝐺𝐷𝑃
𝑖𝑡 and 𝐺𝐷𝑃𝑗𝑡 are expected to have a positive sign as they all are
trade stimulating factors. A negative coefficient for 𝐺𝐷𝑃𝑃𝐶𝑖𝑗𝑡 (GDP per capita difference of the
1 The exchange rates for the countries that adopted common currency (euro) were chain linked with the euro
trading partners) is expected, because trade is positively related to customers with similar per capita incomes, and therefore, having similar consumption patterns. 𝐷𝐼𝑆𝑇𝑖𝑗 variable represents distance between trading partners, and is also expected to have a negative coefficient.
The real exchange rate for both countries 𝑅𝐸𝑅𝑖𝑡 and 𝑅𝐸𝑅𝑗𝑡 is included to capture the trade effect of currency price movements. The real exchange rate can also be interpreted as a measure of national competitiveness. Currency appreciation reduces the competitiveness of country’s exports, accordingly, the RER coefficients are expected to be negatively signed. The dummies 𝐷_𝐶𝐵𝑂𝑖𝑗 (common border), 𝐷_𝐶𝐶𝑂𝑖𝑗 (common colonizer) 𝐶_𝐸𝑈𝑖𝑗𝑡 (EU membership), and 𝐷_𝐶𝐶𝑈𝑖𝑗𝑡 (common currency) are expected to have a positive sign as they are all trade stimulating factors.
4.3. Data Used in Research
Panel data is often used for gravity model calculations. For this research, the panel data set consists of bilateral export flows from the Baltic States to their main export markets. The export markets were selected following the rule that export to these countries should constitute at least 90% of any of the Baltic States exports (for the detailed list, see Annex A).
Accordingly, there are 30 countries included in the set of panel data: Latvia, Estonia, Lithuania (as trade partners to each other), Russia, Germany, Sweden, United Kingdom, Poland, Denmark, Finland, Netherlands, Norway, Belarus, United States, Ukraine, France, Italy, Belgium, Spain, Algeria, Czech Republic, Turkey, Kazakhstan, Ireland, Switzerland, Cyprus, China, Nigeria, Hungary and Canada; 18 of the countries are members of the EU, 12 of them have common currency (the euro), 2 belong to EFTA (European Free Trade Area), and 3 belong to CIS (Commonwealth of Independent States2), with Russia being the most important of them.
The sample period covers the period of 1994–2015. The period captures important economic and political events in the Baltic States and the global history. The nominal exports data in USD at constant producer prices (year 2010 = 100) is sourced from Directions of Trade Statistics (DOT), IMF (Directions, 2016). The USD producer prices were sourced from International Financial Statistics (IFS), IMF (International, 2016). Data on GDP and GDP per
2 Commonwealth of Independent States (CIS) is a regional organization formed in 1991 during the breakup of the
Soviet Union, whose participating countries are some former Soviet Republics. The CIS members include:
Armenia, Azerbaijan, Belarus, Kazakhstan, Kyrgyzstan, Moldova, Russia, Tajikistan and Uzbekistan (Kubicek, 2016)
capita were taken from World Development Indicators (WDI), World Bank (World, 2016). The geographical distance between the trading partner countries was taken from the Centre for Prospective Studies and International Information (CEPII) (Centre, 2016).
Data for calculating the real exchange rate was taken from WDI, World Bank (World, 2016). Data to chain link the national exchange rates with the euro upon its adoption was taken from the European Commission (Converting, 2016). The US consumer prices (year 2010 = 100) were used to express the nominal exchange rate into real exchange rate, sourced from IFS, IMF (International, 2016).
4.4. Limitations of Research
The research model and the chosen research methods of the thesis have certain limitations.
The main empirical tool to be used in the research is the gravity model of trade which is based on certain assumptions about the factors, influencing the trade levels between the countries. However the gravity model of trade is the model itself, and, therefore, has certain approximations and other methodological and theoretical limitations (for example, Anderson, 2011; Mele & Baistrocchi, 2012).
The dependent variable to be used in the research are the export volumes from the Baltic States to their main trading partners. Some authors have been using different variables to define the output of the gravity model, for example, the sum of exports and imports. The export was chosen as the most commonly used dependent variable by other authors.
The defined gravity equation of the research has a limited number of variables. The limited number of variables is advised in the regression analysis, however, this implies that some variables, also affecting the export levels of the Baltic States, will not be taken into account.
In particular, the specified gravity model equation does not encompass any bilateral tariffs information, information on import duties and import quotas. However, this important information in assessing the impact of the FTA on the trade flows is omitted by most other researches too. This is due to the fact that the information on the bilateral tariffs, import duties and import quotas is very difficult to find, and to calibrate in a way that comparative analysis could be carried out. As a proxy the dummy variable of the country’s membership in FTA is used. In this research, it is the variable of EU membership.
5. Analysis of Results
This chapter provides the analysis of the data according to the research model. The chapter provides a geographical analysis of the Baltic States’ trade patterns, and also gives key insights into economic and political developments of the countries. The chapter also includes the results of the gravity model estimations.
5.1. Analysis of Trade Developments of Baltic States
More than a decade before joining the EU, Baltic States were part of the Soviet Union, and were covered by the Iron Curtain. Hence, the trade flows were oriented to the countries of the Soviet Union and its satellites. At the end of 1990s, all three countries had the same main trading partners – the EU (mainly Germany), and Russia. Latvia’s exports went mainly to Germany, Russia and Sweden; Lithuania’s respectively, to Russia, Germany and Latvia; and Estonia’s – to Finland, Sweden, Russia and Germany (Sumilo, 2006). This structure of exports remained stable in the years before joining the EU.
Following the accession into the EU, Baltic States economies grew very fast, fueled by their integration into the EU. But economic growth also followed the building up of the economic bubbles in many advanced economies of the world, resulting in the outburst of the economic and financial crisis in 2008.
Picture 3. GDP Annual Growth Rate of the Baltic States 1996-2015
Source: World Development Indicators, World Bank -20% -15% -10% -5% 0% 5% 10% 15%
As seen from the picture 3, Baltic States’ GDPs in 1996–2015 have been growing most of the time, except during the periods of Russian crisis of 1998 and the economic crisis of 2008, the latter having a much more significant impact. The average growth rate during the period of 1996–2015 was 4% in Latvia and Estonia, and 5% in Lithuania. The worst year for all the countries was 2009, when their economies plummeted by 14–15%. All the economies started to grow again in 2011, and currently maintain 3–4% of the annual GDP growth rate.
Estonia, a member of the euro zone since 2011, has a modern market-based economy and one of the highest per capita income levels in Central Europe and the Baltic region. The economy benefits from strong electronics and telecommunications sectors, and strong trade ties with Finland, Sweden, and Germany. Estonia fell into recession in mid-2008, but the economy recovered strongly in the following years (Economic, 2016; CIA, 2016).
The main export commodities of Estonia are machinery and equipment, foodstuffs, mineral fuels, wood and wood products, metals and furniture (CIA, 2016). Picture 4 provides data on Estonia’s export dynamics with its top ten trade partners.
Picture 4. Estonia’s Export Dynamics with Top 10 Trade Partners
Source: Direction of Trade Statistics, IMF
As seen from picture 4, Estonia’s main export markets remained fairly similar during the period of 1992–2015. Exports to Finland, Sweden, Russia and Latvia constituted more than 50% of the country’s exports. The share of trade with Russia, however, declined around the year 2000, coinciding with the Russian crisis of 1998 and intense Baltic States’ preparations to become members of the EU.
0% 10% 20% 30% 40% 50% 60% 70% 80% 90% 100%
Latvia’s exports contribute to nearly a third of its GDP. The country’s economy experienced a GDP growth of more than 10% per year during 2006–07, but entered a severe recession in 2008 as a result of an unsustainable current account deficit and large debt exposure amid the softening world economy. Triggered by the collapse of the second largest bank, GDP plunged by 18% in 2009. The economy has not returned to pre-crisis levels yet, despite the strong growth. Latvia joined the euro zone in 2014 (Economic, 2016; CIA, 2016).
Picture 5. Latvia’s Export Dynamics with Top 10 Trade Partners
Source: Direction of Trade Statistics, IMF
Latvia’s main export markets have been changing more significantly compared to Estonia (see picture 5). Russia was clearly the key export market for Latvia up until the 1998 Russian crisis. After the accession to the EU in 2004, Latvia exported more to other Baltic States, but also, interestingly, the trade with Russia rebounded, thus, suggesting that membership in the EU is not the only and key driving factor changing Latvia’s trade patterns. The main Latvia’s export commodities are foodstuffs, wood and wood products, machinery and equipment, metals and textiles (CIA, 2016).
Lithuania's trade with the EU and former Soviet Union countries, forming the CIS, accounts for approximately 87% of the total trade. Foreign investment and EU funding have aided in the transition from the former planned economy to a market economy. Baltic States were severely hit by the 2008–09 financial crisis, but Lithuania has rebounded and become one of the fastest growing economies in the EU. Lithuania joined the Eurozone as the last of the Baltics in 2015 (Economic, 2016; CIA, 2016).
0% 10% 20% 30% 40% 50% 60% 70% 80% 90% 100%
The main export commodities of Lithuania are refined fuel, machinery and equipment, chemicals, textiles, foodstuffs, and plastics (CIA, 2016). Picture 6 illustrates the main trade partners of Lithuania.
Picture 6. Lithuania’s Export Dynamics with Top 10 Trade Partners
Source: Direction of Trade Statistics, IMF
Almost during the whole period of 1992–2015, the main export market for Lithuania remained Russia constituting16% of total exports during the analyzed period. In case of Latvia and Estonia, exports to Russia constitute 14% and 10% respectively. Furthermore, the accession into the EU in 2004 does not seem to be reflected in the dynamic of main export markets for Lithuania. The more important impact of trade reorientation emerged after the Russian crisis of 1998.
On a general note, Baltic States economies and the trade flows were growing almost during the whole period of 1992–2015 (see picture 7).
0% 10% 20% 30% 40% 50% 60% 70% 80% 90% 100%
Picture 7. Baltic States Export Trends 1992-2015, in million USD
Source: Direction of Trade Statistics, IMF
The volume of exports of Latvia, Estonia and Lithuania mostly grew in double digits since 2002. On absolute terms, Lithuania’s export is twice as high as that of Latvia’s and Estonia’s because Lithuania is a larger economy. The growth trend of the Baltic States exports was strong up until the current crisis of 2008, when exports dropped in all the three countries. However, the export volumes reached the previous levels in just three years, and continued to grow up until 2013.
The export levels of Baltic States in 2014–2015 have been hampered by the economic slowdown in the EU and economic and political developments in Russia. The Russian military intervention in Ukraine, which began in late February 2014, prompted a number of governments to apply sanctions against individuals, businesses and officials from Russia and Ukraine. Sanctions were approved by the US, the EU and other countries and international organizations. Russia has responded with sanctions against a number of countries, including a total ban on food imports from the EU, US, Norway, Canada and Australia. The sanctions have contributed to the collapse of the Russian currency and the 2014–2015 Russian financial crisis. They have also caused economic damage to a number of EU countries, with the total losses estimated at €100 billion (Sharkov, 2015). Additionally, Russia’s economy has been hardly hit by low oil prices. In turn, Baltic States economies got a strongest hit by the negative political and economic developments in Russia.
0 5.000 10.000 15.000 20.000 25.000 30.000 35.000 1 9 9 2 1 9 9 3 1 9 9 4 1 9 9 5 1 9 9 6 1 9 9 7 1 9 9 8 1 9 9 9 2 0 0 0 2 0 0 1 2 0 0 2 2 0 0 3 2 0 0 4 2 0 0 5 2 0 0 6 2 0 0 7 2 0 0 8 2 0 0 9 2 0 1 0 2 0 1 1 2 0 1 2 2 0 1 3 2 0 1 4 2 0 1 5
Picture 8. Changes of Baltic States Exports to Russia 2010–2015, %
Source: Direction of Trade Statistics, IMF
As seen from picture 8, Baltic States exports to Russia started to fall dramatically in 2014 with -3% from Lithuania and up to -17% from Estonia. The year 2015 was even worse, when the already low levels of exports declined even further by -30%, -42% and -44% in Latvia, Estonia and Lithuania, respectively. Russia is one of the key trading partners for all of the countries, thus, the dramatic drop in exports to Russia severely impacted the Baltic States’ trade levels and their economies in general.
In summary, the trade patterns of the Baltic States have shifted in a slightly different way over the analyzed period. Latvian main trade flows were shifting from Russia to more trade with Lithuania and Estonia. Meanwhile, Estonia and Lithuania continued to have rather stable trade directions’ composition during the past twenty years. On the other hand, Estonia’s exports are flowing more and more into EU trade partners, while Lithuania and Latvia continue to trade with Russia according to the economic cycles of the Russian economy (higher trade flows when Russian economy is doing well and reduced trade during periods of recession). This implies that countries still maintain strong economic ties among each other.
The results of the analysis, proved in this section, clearly demonstrate that there are many external factors influencing the trade patterns of the Baltic States. At the beginning of the 1990s, the Baltic States’ trade directions were much more oriented towards former Soviet Union countries, and the trade reorientation towards Western European countries had only begun. However, the composition of the main trading partners in the past twenty years did not change dramatically. The key events in Baltic States’ history, such as accession to the EU, did have a strong impact on the economies of the said countries, however, this is not reflected in the changes of the trade patterns of the Baltic States.
-60% -40% -20% 0% 20% 40% 60% 2010 2011 2012 2013 2014 2015
Furthermore, the dramatic changes of the trade composition of the Baltic States occurred in the past couple of years, when exports to Russia shrunk in double digits. This mainly happened due to the geopolitical tensions around the Russia and Ukraine conflict. This implies that often political, and not economic factors, have a more significant impact on the country’s trade patterns.
5.2. Results of Gravity Model of Trade
This section provides the results of the empirical analysis of the Baltic States trade patterns, based on the gravity model of trade. Table 2 provides the summary statistics on the data, used in the gravity equation for this research.
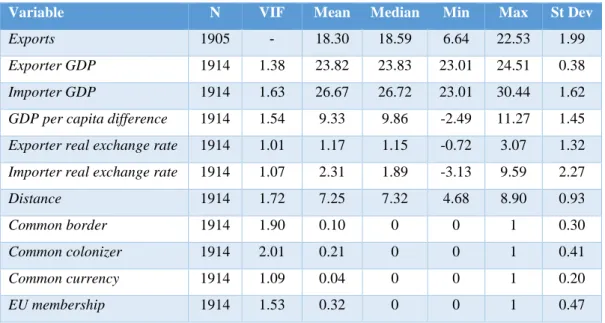
Table 2. Summary Statistics
Variable N VIF Mean Median Min Max St Dev
Exports 1905 - 18.30 18.59 6.64 22.53 1.99 Exporter GDP 1914 1.38 23.82 23.83 23.01 24.51 0.38 Importer GDP 1914 1.63 26.67 26.72 23.01 30.44 1.62 GDP per capita difference 1914 1.54 9.33 9.86 -2.49 11.27 1.45 Exporter real exchange rate 1914 1.01 1.17 1.15 -0.72 3.07 1.32 Importer real exchange rate 1914 1.07 2.31 1.89 -3.13 9.59 2.27 Distance 1914 1.72 7.25 7.32 4.68 8.90 0.93 Common border 1914 1.90 0.10 0 0 1 0.30 Common colonizer 1914 2.01 0.21 0 0 1 0.41 Common currency 1914 1.09 0.04 0 0 1 0.20 EU membership 1914 1.53 0.32 0 0 1 0.47
Source: Author’s calculations
The number of observations N for all except one variable is 1914, which means that the panel is nearly balanced, and is also large enough to produce statistically reliable results. Since the VIF (variance inflation factor) for none of the independent variables is greater than 2.01, the correlation between variables and multicollinearity of the regression is not high.
The mean of the numerical variables is, in general, very close to the median values, which implies that there are not many outlying values and the panel data is quite symmetric. Five out of seven variables are slightly skewed to the left as their medians are more than the mean values. The standard deviation of the exports is small, despite the rather big difference between minimum and maximum values (6.64 and 22.53). This suggests that export
observations are relatively close to the mean value. The exporter and importer real exchange rate is relatively higher than the median deviation from the mean, and the higher standard deviation suggests that exchange rates of the analyzed trading partners have been fluctuating significantly during the analyzed period, and, in this way, have impacted the competitiveness of the trading partners. A rather high standard deviation of GDP per capita difference suggests that Baltic States have many important trade partners with different levels of income. This does not support the Linder hypothesis which states that the main trading partners should have a rather similar level of income.
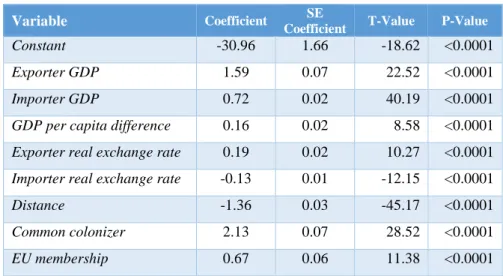
Table 3 gives the empirical results of the gravity model, capturing export flows from the Baltic States to their main 30 trading partners over the period of 1994–2015.
Table 3. Gravity Model Results
Variable Coefficient SE
Coefficient T-Value P-Value Constant -30.96 1.66 -18.62 <0.0001 Exporter GDP 1.59 0.07 22.52 <0.0001 Importer GDP 0.72 0.02 40.19 <0.0001 GDP per capita difference 0.16 0.02 8.58 <0.0001 Exporter real exchange rate 0.19 0.02 10.27 <0.0001 Importer real exchange rate -0.13 0.01 -12.15 <0.0001 Distance -1.36 0.03 -45.17 <0.0001 Common colonizer 2.13 0.07 28.52 <0.0001 EU membership 0.67 0.06 11.38 <0.0001 Source: Author’s calculations
The initial regression analysis showed that dummies of common border and common currency are statistically insignificant (with P-values more than 0.05 for both). The insignificance of a common border can be explained, because Baltic States are rather small in size, and are considered small open economies with an easy access to the most of the neighboring countries. The common currency dummy insignificance was most likely a result of Baltic States having euro as their currency for a relatively short period (Estonia introduced euro in 2011, Latvia in 2014, and Lithuania in 2015). All the rest of the variables are significant with the 95%, and also with the 99% confidence level.
The R-Square of the regression is 74.86%, which is rather high, meaning that gravity model variables explain most of the export levels between the analyzed countries.
The gravity model results suggest that the most important factors influencing the trade between the Baltic States countries and their trade partners are a common colonizer, exporter GDP, and distance between the countries. Membership in the EU is a positive factor, but not as important as the latter ones. The least important factors are exporter and importer real exchange rates and the GDP per capita difference.
The core gravity model variables are GDP of trading partners and the distance between the countries. In the case of Baltic States, both of the core parameters are significant, however, their importance is second to the previous ties with the former Soviet Union countries (i.e. variable of common colonizer). The augmented gravity model also includes GDP per capita variable, as a reflection of Linder hypothesis. According to the hypothesis, countries with the similar level of income should trade more. However, the Linder hypothesis does not hold true in the case of the Baltic States, as the parameter of GDP per capita difference is positive, suggesting that bigger the difference between the GDPs, the more trade should there be. On the other hand, the coefficient for GDP per capita difference is one of the smallest, therefore, the importance of this variable is rather limited. The distance coefficient is negative, thus, supporting the core gravity model of trade assumption that trade related costs reduce the trade volumes between the countries.
The importance of variables of real exchange rate is rather limited, thus, meaning that the exchange rate movements are not the key drivers of the trade volumes of the Baltic States, even though exchange rate movements affect competitiveness of the countries. All of the Baltic States at the end of the analysis period had the euro as their currency. Despite all the three countries introducing euro only in recent years, all of them had been preparing to join the eurozone by pegging their currencies to euro soon after the euro was introduced in the EU. Therefore, for the Baltic States, the euro and US dollar exchange rates proximate the national currency movements against the dollar. The gravity equation estimates suggest that the euro depreciation against US dollar had a positive effect on the Baltic States’ export levels. On the other hand, the trade partner real exchange rate coefficient is negative, meaning that partner currency’s depreciation against the US dollar has reduced receptiveness for Baltic States’ exports.
The gravity equation estimates show that Baltic States’ membership in the EU has a positive and significant effect on the export levels of the Baltic States to other EU members. On the other hand, the estimates suggest the conclusion that membership in the EU is not the main trade stimulating factor. The more important factor for the Baltic States exports is the common history of belonging to the Soviet Union. Baltic States have been part of the Soviet
Union for around 50 years up until early 1990s. And they were members of the EU for only 11 years at the end of the research period. Therefore, the longer lasting, even currently inexistent economic ties still remain important trade creating factors for the Baltic States.
5.3. Testing of Hypotheses
The gravity model estimates allow to accept or reject the hypotheses of the thesis: H1: Baltic States’ membership in the EU has created trade with members of the EU.
This hypothesis rests on the importance and the sign of the coefficient of the EU membership variable. Since the said variable coefficient is positive and significant, the hypothesis is accepted. This implies important economic and political conclusions. Firstly, the country’s decision to join FTA or deeper economic union does affect trade directions of that country. The conclusion goes in line with a number of empirical studies, proving similar results for other FTAs. The conclusion is also important for business strategy, while assessing investment opportunities to different countries.
H2: The membership in the EU is not the main factor, apart from the core gravity model variables, affecting the volumes of Baltic States trade with the EU members. The hypothesis
implies that apart from the size of the GDP of the trading partners and the distance between them, the membership in the EU is not the main driver of the higher trade volumes of Baltic States with other EU counterparts. The hypothesis can be accepted because gravity estimates showed that EU membership is not the most important factor, after GDP and distance, defining the export levels of the Baltic States. A conclusion is important from the policy making perspective, as it suggests that foreign policy, based on the membership in the different trading blocs, is not enough to ensure a country’s trade integration with the members of that trading bloc.
H3: The economic ties with former Soviet Union countries are not the main factor, apart from the core gravity model variables, affecting the volumes of Baltic States trade. The
hypothesis implies, that apart from the size of the GDP of the trading partners and the distance between them, former belonging to the Soviet Union is not the main driver of the higher trade volumes. The hypothesis is rejected, since according to gravity model estimates, the coefficient of common colonizer is the most important factor of all, creating Baltic States exports to the former Soviet Union countries. The conclusion supports the results of the second hypothesis, because despite the fact that Soviet Union, as a form of FTA, is no longer existent, the economic ties between its former members are still very strong.
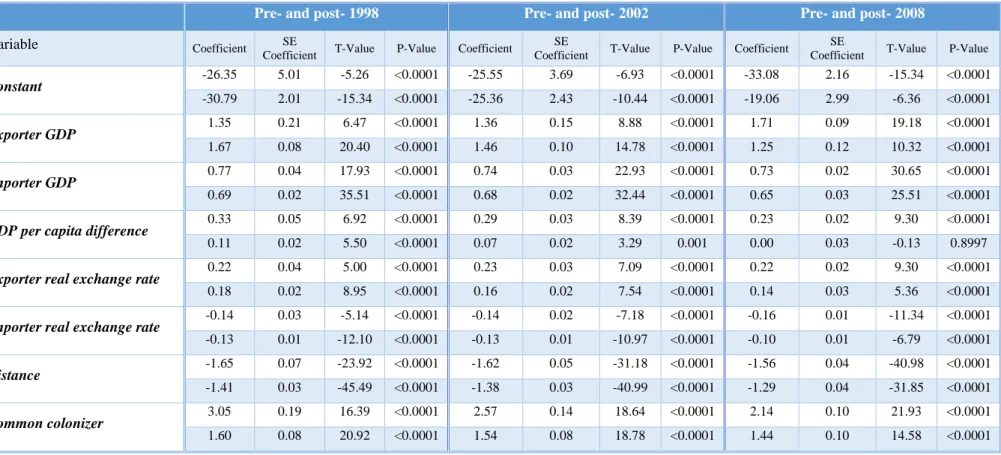
5.4. Additional Gravity Model Estimates
The previous section provided analysis of gravity model variables, which have an impact on the volumes of the Baltic States’ exports. In addition to the chosen variables, looking through the analysis period of 1994–2015, few important events should be identified and analyzed separately: the 1998 Russian crisis, the start of Baltic States integration into the EU in 2002 and the 2008 financial crisis. To separately analyze the effects of these events on the Baltic States’ trade, the panel data was accordingly divided into pre- and 1998, pre- and post-2002 and pre- and post-2008 years. The gravity model estimations for separate periods are provided in table 4. The variable of EU membership was excluded from these estimates, as EU membership dummy has only the value of 0 in pre-1998/2002 data sets.