Rev. Caatinga
BIOCHAR AS SOIL CONDITIONER IN THE SUCCESSION OF UPLAND RICE
AND COWPEA FERTILIZED WITH NITROGEN
1NEYTON DE OLIVEIRA MIRANDA2*, ALEXANDRE SANTOS PIMENTA3, GUALTER GUENTHER COSTA DA SILVA3, ERMELINDA MARIA MOTA OLIVEIRA3, MARY ANNE BARBOSA DE CARVALHO4
ABSTRACT- The effects of biochar and nitrogen application on yields of upland rice and cowpea and on soil
fertility were determined in a greenhouse in Macaíba, RN, Brazil. The trial consisted of the succession of two crops in a completely randomized design and a factorial scheme, with four replicates. Initially, four doses of biochar and four doses of nitrogen were tested for cultivation of rice. Subsequently, four doses of biochar and two doses of nitrogen were tested in half of the pots maintained for planting cowpea. Soil was sampled after rice harvest for half of the pots and at end of the trial for the remaining pots. We evaluated the following parameters: mass of hundred grains of rice, dry shoot mass, panicle number, number of filled spikelets and of empty spikelets, and grain production. Determinations for cowpea were: pod number per pot, grain number per pod, and grain production per pot. Measured soil parameters were: pH, contents of organic carbon, P, K, Ca, Mg, Na, cation exchange capacity, and exchangeable sodium percentage. Biochar addition did not influence yield components of upland rice and cowpea, but resulted in increased soil N retention, which influenced rice dry shoot mass, spikelets sterility, panicle number, and grain mass. Biochar also promoted increased soil pH,
potassium content, and exchangeable sodium percentage and decreased calcium and magnesium concentrations.
Keywords: Oryza sativa. Vigna unguiculata. Charcoal. Carbon sequestration.
CARVÃO VEGETAL COMO CONDICIONADOR DE SOLO NA SUCESSÃO ARROZ E FEIJÃO-CAUPI ADUBADOS COM NITROGÊNIO
RESUMO - Os efeitos da aplicação de carvão vegetal e nitrogênio sobre a produtividade de arroz de terras
altas e feijão-caupi e a fertilidade do solo foram determinados em ambiente protegido em Macaíba, RN, Brasil.
O experimento constou de dois cultivos sucessivos em delineamento experimental completamente casualizado em arranjo fatorial, com quatro repetições. Inicialmente, foram testadas quatro doses de carvão vegetal e quatro
de nitrogênio para a cultura do arroz. A seguir, foi cultivado feijão-caupi em metade dos vasos (quatro doses de
carvão e duas de nitrogênio). O solo foi amostrado após a colheita do arroz, em metade dos vasos, e ao final do experimento, nos vasos restantes. Do arroz foram determinados, massa de cem grãos e, por vaso, massa seca da
parte aérea, número de panículas, número de grãos cheios e grãos vazios e produção de grãos. Do feijão-caupi
foram determinados: número de vagens por vaso, número de grãos por vagem e produção de grãos por vaso. No solo foram determinados: pH, teores de carbono orgânico, P, K, Ca, Mg e Na, capacidade de troca de cátions e percentagem de sódio trocável. As doses de carvão vegetal não influenciaram nas características de
produção do arroz e feijão-caupi, mas favoreceram a retenção de nitrogênio no solo, que se refletiu sobre massa
seca da parte aérea do arroz, esterilidade das espiguetas, número de panículas e massa dos grãos. Além disso, promoveram aumento no pH, teor de potássio e percentagem de sódio trocável do solo, com diminuição no teor de cálcio e magnésio.
Palavras-chave: Oryza sativa. Vigna unguiculata. Biochar. Sequestro de carbono.
_____________________ *Corresponding author
1Received for publication in 11/08/2014; accepted in 07/29/2016.
Paper extracted from the report of Senior Post Doctoral Research Grant received from CNPq.
2Department of Environmental and Technological Sciences, Universidade Federal Rural do Semi-Árido, Mossoró, RN, Brazil;
neyton@ufersa.edu.br.
3Agricultural Sciences Specialized Unit, Universidade Federal do Rio Grande do Norte, Macaíba, RN, Brazil;
alexandre_spimenta@hotmail.com, gualtermve@gmail.com, ermelindamota@yahoo.com.br.
Rev. Caatinga
INTRODUCTION
According to the FAO (2011), the degradation of natural resources due to population pressure, climate change, and competition for land and water has social and cultural implications and affects biomass production, carbon accumulation, soil quality, water availability, biodiversity, and greenhouse gas emissions. In this context, dryland
farming systems in semi-arid regions lead to water
scarcity, salinization, pollution and sediment deposition in water reservoirs, degradation of the soil structure, reduction of soil fertility and carbon content, and nutrient depletion.
Population growth is accompanied by increased agricultural production, which should be accomplished in a sustainable way, using already existing crop areas and employing practices of soil and water conservation to increase carbon stocks via organic matter, thereby increasing water and nutrient retention erosion control and reducing greenhouse gas emissions.
High soil quality and productivity in terms of
carbon storage can represent a trade-off between
conservation targets and organic matter
decomposition (JANZEN, 2006). This implies that, in order to accumulate C under fixed supplies of organic residues, it is necessary to inhibit biological activity and decomposition, which in turn negatively impacts soil fertility. One approach to solve this issue is to add large quantities of organic residues to the soil in order to achieve a balance between added and decomposed C; alternatively, recalcitrant C forms might be added to the soil to stabilize carbon. Another approach is to use coal rich in pyrogenic carbon as agricultural soil conditioner (CARVALHO et al., 2013), because it resists decomposition and can remain in the soil for centuries (SOMBROEK et al., 2003).
Pyrolysis is the thermal decomposition of biomass in partial or total absence of oxygen and at temperatures between 400 and 800°C. The raw material used can be any organic material, such as bark, wood, crop residues or other waste of agricultural or livestock origin (MAIA; MADARI; NOVOTNY, 2011; NÓBREGA, 2011; LINHARES et al., 2012).
In a comprehensive literature review about biochar addition to soils, Jeffery et al. (2011) reported variable results depending on the experimental conditions and soil properties. In terms of crop productivity, their analysis showed a small, but significant average increase of 10%, with the best results observed in acid and neutral soils of sandy or loamy texture. This study indicates that the main mechanisms by which biochar increases productivity are soil acidity correction and increase of water retention and nutrient availability. However, application of biochar also present potential environmental risks due to toxic compounds, removal of plants residues that protect the soil, and the use of forests, conservation areas, or areas previously producing food for producing biomass for carbonization. Carbonization is acceptable for biomass that would be decomposed or burned or is obtained from residues of forest management, industry, and agriculture, besides the use of manure, organic garbage, and residues of pruning.
The objective of this work was to determine the effect of different doses of biochar and nitrogen on soil fertility in general and the yield of upland rice and cowpea in particular.
MATERIAL AND METHODS
The work was conducted from September 2013 to January 2014 in a greenhouse at the Specialized Unit of Agricultural Sciences, Federal University of Rio Grande do Norte, Macaíba, RN, Brazil (5° 53' 11 "S and 35° 21 ' 49" W). According to the Köppen classification, the climate is a transition between the types As' and BSh’, with high temperatures throughout the year and rainfall in autumn and winter. Average annual temperature is 27.1° C and average air relative humidity 76%.
Soil, classified as dystrophic Yellow Latosol (Typic Hapludox) according to the Brazilian System of soil Classification (SANTOS et al., 2013), was collected at a depth of 0 to 20 cm, passed through a
2 mm mesh sieve and air-dried. Table 1 shows the
main physical and chemical characteristics of the soil.
Table 1. Chemical and physical soil characteristics.
SOM = soil organic matter; SB = sum of bases; HAL = potential acidity; CEC = cation exchange capacity. Chemical characteristics
pH SOM N P K Na Ca Mg SB HAL CEC
--g kg-1-- mg dm-3 ---cmolc dm-3---
5.80 10 0.18 19.40 0.23 0.03 1.50 0.80 2.56 1.86 4.42
Physical characteristics
Sand Silt Clay
---g kg-1---
Rev. Caatinga
Biochar was produced from wood residues of cashew trees by the traditional "hot tail" kiln method, milled, and passed through a 2 mm sieve. Total moisture was 5.43% and chemical analysis showed 21% of volatile materials, 16% of ash, and 63% of
fixed carbon. Nutrient levels were as follows:
N = 9.35 g kg-1; P = 89.16 mg kg-1; K = 1.34 g kg-1;
Cu = 10.21 mg kg-1; Mn = 32.27 mg kg-1;
Fe = 185.04 mg kg-1; Zn = 18.45 mg kg-1.
The experimental design was completely randomized in a factorial scheme, with four replicates. The first crop was upland rice (Oryza sativa L.) conducted as a 4 x 4 factorial scheme
constituted by the factors biochar dose
(D0 = 0 kg ha-1; D1 = 3,500 kg ha-1 or 15.75 g per
pot; D2 = 7,000 kg ha-1 or 31.5 g per pot, and
D3 = 10,500 kg ha-1 or 47.25 g per pot) and nitrogen
(N, as calcium nitrate) (0, 30, 60, and 90 kg ha-1).
After harvest, 32 pots were maintained for growing cowpea (Vigna unguiculata (L.) Walp.) under the residual effects of all doses of biochar and only the
doses 0 and 90 kg ha-1 of N.
Mixtures of biochar and soil were placed in polyethylene pots with a capacity of 10 L and filled to a height of 20 cm from the bottom, resulting in a volume of 8 liters and a final mass of 11 kg, with a
density of 1.375 kg cm-3 before mixtures. Soil was
weighted using a 20 kg scale with accuracy of 5 g and the weighing of biochar and fertilizer was performed in an electronic analytical scale with accuracy of 0.001 g.
Upland rice cv. BRS Sertaneja was sowed along with the application of a single dose of the amount of nitrogen corresponding to each treatment, without any other fertilizer. After thinning, 14 days after sowing (DAS), three plants were left per pot. The crop was irrigated manually every three days and the amount of water was determined by difference after the weighing of four control pots, with 324 mm of water applied up to 120 DAS.
Rice was harvested 120 days after sowing. The plants were cut low to the ground and the panicles were separated to determine number per pot, number of filled and empty grains per pot, production per pot, and mass of 100 grains, both corrected to 13% moisture. Subsequently, the plants were dried in a forced air circulation oven at 65°C for 72 hours to determine dry mass of shoots per pot.
In terms of cowpea, we used the variety Itaim. After thinning at 10 DAS, three plants remained per pot. Irrigation was performed as described above, with 245 mm water applied until 59 DAS. In addition, there were two applications of 2.5% deltamethrin at a dose of 1 mL per liter of water for
controlling Aphis spp. and Liriomyza sativae. The
dry pods were harvested between 57 and 72 days after sowing for determination of number of pods per pot, number of grains per pod, and grain production per pot, corrected to 13% moisture.
Soil was sampled after harvest of rice (150
days after application of the treatments) in the pots
that received the doses of 30 and 60 kg ha-1 of N and
after harvest of cowpea (220 days after application of the treatments) in the remaining pots. We measured soil pH, soil organic carbon content, and contents of P, K, Ca, Mg and Na, having calculated CEC (cation exchange capacity) and ESP (exchangeable sodium percentage). Soil analyses were performed as described in EMBRAPA (2009).
Data from upland rice cultivation were submitted to variance analysis of the effects of the factors biochar and N and their interactions (coal x nitrogen), with regression analysis of significant effects. Data from cowpea cultivation were submitted to variance analysis of the effects of doses of biochar, two doses of N, and their interaction, with regression analysis for the effects of doses of
biochar and test of means (Duncan-p < 0.05)
between the two doses of N. Data from soil analyses (including two sampling dates) were submitted to joint variance analysis to evaluate the effect of sampling and dose of biochar, followed by test of means and regression analysis. For each sampling, the effects of dose of biochar, two doses of N, and their interactions were analyzed, with regression analysis for doses of biochar and test of means between doses of N.
RESULTS AND DISCUSSION
Upland Rice Production VariablesDifferent biochar doses had no significant effect on upland rice production variables. This result was also obtained by Carvalho et al. (2013), who stated the hypothesis that soil without application of biochar did not present limitations of availability of water, K, or P, and that the crop is tolerant to soil acidity. However, there was a significant effect of the N doses on number of filled
grains per pot (NFG - p < 0.01) and rice production
per pot (PRODR - p < 0.01).
Apart from the effects of N doses, dry shoot
mass (DSM - p < 0.05), number of panicles per pot
(NP - p < 0.05), and number of empty grains per pot
(NEG - p < 0.01) were significantly affected by
interactions between doses of biochar and N, while
the mass of 100 grains (MHG -p < 0.05) was only
Rev. Caatinga
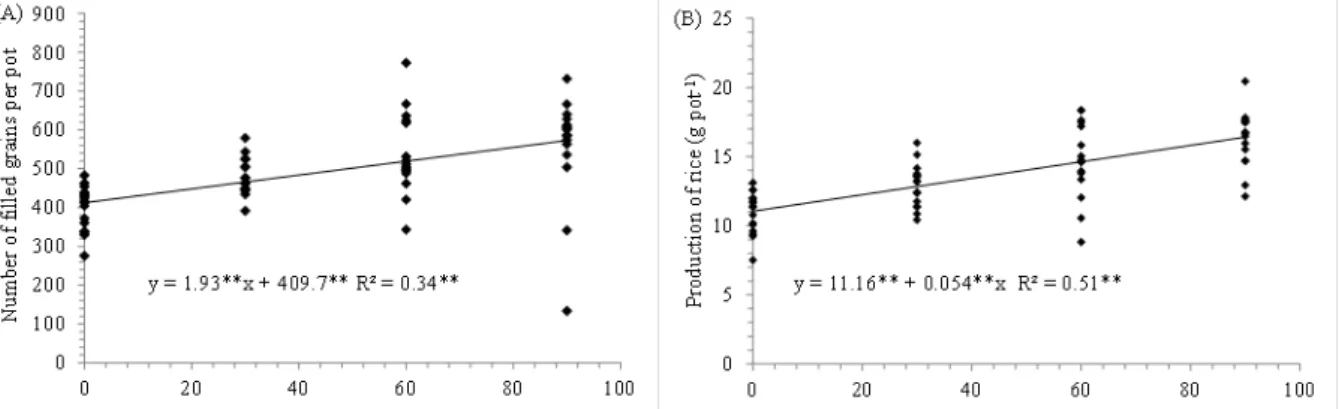
We observed a linear increase in NFG and PRODR with increased N doses (Figure 1). Hereby, NFG increased by 20% when the quantity of N was
increased from 0 to 30 kg ha-1, by 35% when the
dose was increased from 0 to 60 kg N ha-1, and by
40% when the dose of N was increased from 0 to
90 kg ha-1. The same increments in the doses of N
caused increases in PRODR of 15, 26, and 29%,
respectively. The cultivar BRS Sertaneja presented the same behavior regarding filled grains in a research of Barreto et al. (2012). However, in a study by Fabre et al. (2011) and Buzetti et al. (2006), increase in rice yield as a function of N dose was quadratic. This indicates that the doses of N tested in the present study did not reach the dose which provides maximum rice yield.
Figure 1. Effect of doses of nitrogen on number of filled grains of rice per pot (A) and production of rice per pot (B). (**significant at 1% of probability).
In general, increase in the doses of N raises rice yields due to the increase in the number of filled grains (MINGOTTE; HANASHIRO; FORNASIERI FILHO, 2013). Apart from the dose, whose increase promotes increase in the number of spikelets and filled spikelets, the moment of N application is critical for the yield (YOSEFTABAR, 2013). However, yield increase depends on a balance between number of panicles per area and number of filled grains per panicle, and this balance can be modified by increased N doses (BARRETO et al., 2012).
Interaction between N doses and biochar doses was significant (p < 0.01) for the variables DSM and NEG (Table 2), whereas MHG showed only a significant effect (p < 0.05) of N doses
interacting with doses of 7,000 and 10,500 kg ha-1 of
biochar, and NP showed only a significant effect of
N doses (p < 0.01) within the doses of 0 and
10,500 kg ha-1. The ability of biochar to improve N
use efficiency in plants has been demonstrated in Chan et al. (2007), who observed increased productivity of radish in pots due to the application
of biochar in the presence of nitrogen. This ability can potentially result in economic and environmental
benefits due to reduced N2O emissions and losses of
inorganic N via leaching (NÓBREGA, 2011). Highest N use efficiency (using N that is
mobile in the soil-plant system and is lost easily
through leaching, volatilization, and denitrification) (FABRE et al., 2011) can be provided by the synchrony between N demands of the crop and N supply by the soil or through fertilization (YOSEFTABAR, 2013). According to Yoshida (1981), zeolite is used in Japan to increase the soil´s capacity of N retention and, consequently, increase rice yields. Steiner et al. (2010) reported that
retention of NH4-N by biochar explains the large N
recovery in soils where it was applied. Therefore, soil N retention capacity determines the splitting of the applied N fertilizer doses. In contrast, Ding et al. (2010) reported evidences that biochar can be used in the soil as an additive capable of retaining nutrients, thereby increasing the efficiency of chemical fertilizers.
Table 2. Effect of interaction, indicated by test F, of doses of nitrogen within each dose of biochar (kg ha-1) on production
variables of upland rice.
**significant at 1 % of probability; *significant at 5 %; nsnon-significant.
D0 = 0 kg ha-1; D1 = 3,500 kg ha-1; D2 = 7,000 kg ha-1, and D3 = 10,500 kg ha-1 of
biochar.
D0 D1 D2 D3
Dry shoot mass (g pot-1)
Effect of N 14.62** 20.04** 11.50** 18.34** Mean 20.71 19.70 20.42 19.66 CV (%) 7.18 5.46 9.96 9.92
Mass of hundred grains (g)
Effect of N 1.43ns 0.93ns 3.39* 3.80*
Mean 2.84 2.82 2.79 2.79
Rev. Caatinga Table 2. Continuation.
**significant at 1 % of probability; *significant at 5 %; nsnon-significant.
D0 = 0 kg ha-1; D1 = 3,500 kg ha-1; D2 = 7,000 kg ha-1, and D3 = 10,500 kg ha-1 of
biochar.
The quadratic effect of N on DSM was
observed for doses of 0 and 3,500 kg ha-1 of biochar,
both with a point of maximum at 67.5 kg ha-1 of N
(Figure 2A), with the higher values of DSM occurring at the dose zero of biochar. However, the effect of the N doses was linear positive for the doses
of 7,000 and 10,500 kg ha-1 of biochar, which values
of dry mass become higher than values for the doses
of 0 and 3,500 kg ha-1 near the point of maximum of
these two doses. A beneficial effect of biochar application of biochar on growth and dry mass accumulation of upland rice was also observed by Madari et al. (2006).
Figure 2. Effect of the interaction of nitrogen doses and biochar doses on dry shoot mass (g pot-1) (A), mass of hundred
grains (g) (B), number of panicles per pot (C), and number of empty grains per pot (D). (**significant at 1% of probability; *significant at 5%; nsnon-significant).
When biochar was not applied, an increase of
36% in DSM was obtained with the dose of
90 kg ha-1 of N compared to no N application,
whereas when we applied 3,500 kg ha-1 of biochar,
the increase was 31%. The application of
7,000 kg ha-1 of biochar provided increases of 27.5%
for the dose of 30 kg ha-1 of N compared to no N
application, and of 52% for the dose of 90 kg ha-1 of
N. However, higher DSM values were obtained
when we applied 90 kg ha -1 of N combined with a
dose of 10,500 kg ha-1 of biochar, resulting in an
increase of 63% compared to no N application. Considering that the entire dose of N was applied at the time of sowing, the effect of the lower doses of biochar on DSM is similar to the isolated effect of N in the soil, when plant dry mass increases until application of the dose of N that provides maximum growth. At larger biochar doses, the linear increase of DSM would be due to the positive effect of biochar on N retention, thereby diminishing N losses and improving N recovery.
Contrasting effects were observed for MHG
D0 D1 D2 D3
Number of panicles per pot
Effect of N 5.53** 0.56ns 1.89ns 7.10**
Mean 7.62 7.44 7.44 6.87
CV (%) 14.66 15.40 15.65 19.47 Number of empty grains per pot
Rev. Caatinga
using N doses which significantly interacted with
biochar doses. At a dose of 7,000 kg ha-1 of biochar,
the effect was quadratic as a function of the N dose
(Figure 2B), reaching a maximum at a dose of 36 kg ha-1 of N, while at a dose of 10,500 kg ha-1,
minimum values were obtained with 43 kg ha-1 of N.
Considering that the regression for the dose of
7,000 kg ha-1 of biochar did not result in equation
with significant parameters, the regression for the
dose of 10,500 kg ha-1 indicates that MHG decreases
with smaller N doses, but for doses higher than
43 kg ha-1, part of N was retained by biochar,
positively impacting grain filling.
In this respect, Yoseftabar (2013) noted that split application of the nitrogen fertilizer promoted higher grain mass, thereby increasing yields. However, Barreto et al. (2012) did not observe significant effects of N doses on the MHG of the upland rice cultivar BRS Sertaneja, similarly to Zhang et al. (2008) who working with other rice varieties. There are also reports of reductions in mass of 100 grains with increasing levels of N (BUZETTI et al., 2006; MINGOTTE; HANASHIRO; FORNASIERI FILHO, 2013). According to Kischel et al. (2011) this can be due to excess nitrogen, resulting in luxury consumption in which the plant prioritizes growth at the expense of grain mass.
Nitrogen fertilization in combination with 0
and 10,500 kg ha-1 of biochar linearly positively
affected panicle numbers in upland rice (Figure 2C), while the regressions for the other doses were not significant. Linear increase in the number of panicles per area of the same cultivar, BRS Sertaneja, was also observed by Barreto et al. (2012) when all N doses were applied at planting. In contrast, Fabre et al. (2011) verified quadratic effect of N doses on the number of panicles. In the present work, when biochar was not applied, a 52% increase in the number of panicles was observed when N doses
increased from 0 to 30 kg ha-1, whereas with the dose
of 10,500 kg ha-1 of biochar, the increase was 50%
between the dose 0 and the dose of 60 kg ha-1 of N
and 80% between the dose 0 and the dose of
90 kg ha-1 of N.
According to Buzetti et al. (2006), who observed a positive response of rice to nitrogen fertilization in terms of number of panicles per area and number of grains per panicle, panicle number per area is directly related to rice productivity. In a similar study, Mingotte, Hanashiro and Fornasieri Filho (2013) stated that variables related to panicles are determined by the application of nitrogen, e.g. the number of panicles which increases significantly with nitrogen fertilization. As panicle number is determined during germination, it can only be increased by the application of nitrogen at the beginning of the growth cycle (BUZETTI et al., 2006; FABRE et al., 2011; YOSEFTABAR, 2013).
The highest number of empty grains was observed when no biochar was added, in which case
the doses of N has a quadratic impact and NEG
reached maximum levels at 61 kg ha-1 of N
(Figure 2D). A dose of 3,500 kg ha-1 of biochar
resulted in lower NEG levels than the dose zero and
presented a point of maximum at 67 kg ha-1 of N.
However, NEG increased linearly with increasing N doses. The quadratic increase in percentage of sterile spikelets of BRS Sertaneja as a function of the doses of N was also observed by Barreto et al. (2012), while Buzetti et al. (2006) observed a linear increase
when testing other varieties. The coal-free treatment
demonstrates the isolated effect of N, where increased doses cause increase in sterility of spikelets up to a maximum level. This effect is
attenuated with a dose of 3,500 kg ha-1 of biochar,
due to partial N retention. However, with higher biochar doses, NEG increased linearly with increased N doses, due to a greater retention of nitrogen which is released slowly, maintaining an excess of N in the soil.
The lower fertility of rice spikelets due to increased N doses is related to the fact that this nutrient provides higher spikelet numbers per panicle. Therefore, low spikelet sterility under high doses of N is an important criterion in the selection of rice genotypes (BARRETO et al., 2012;
MINGOTTE; HANASHIRO; FORNASIERI
FILHO, 2013). Decrease in spikelet sterility is one of the causes of the increase in yield when the application of N is split. This reduction occurs when N is applied after spikelet differentiation, because the upper leaves remain upright and more efficiently use the photosynthetically active radiation (MINGOTTE; HANASHIRO; FORNASIERI FILHO, 2013; YOSEFTABAR, 2013).
Cowpea Production Variables
The production variables of cowpea showed
no significant effect (test F - p < 0.05) of biochar
doses or interactions between biochar and N application. These variables, presented in Table 3, presented coefficients of variation (CV) between 24 and 28%, which are considered medium. Different results were obtained by Silva et al. (2011) with common bean; they observed increased yields
with a dose of 32 Mg ha-1 of biochar.
The significant effect of N doses on the production of cowpea per pot (Table 3) indicates that
the dose of 90 kg ha-1 of N was detrimental to the
crop. In this respect, Oliveira et al. (2003) achieved
maximum cowpea yields with the dose of 60 kg ha-1
Rev. Caatinga
Table 3. Means of grain production per pot (PRODC - g), number of pods per pot (NPP), and grain number per pod (NGP) of cowpea under doses of biochar and nitrogen.
Means followed by different letters differ by the Duncan´s test (p < 0.05).
Soil Chemical Characteristics
Analysis of variance did not indicate significant effects for contents of Ca and Mg and for soil cation exchange capacity (CEC). In relation to the content of Na, despite the significant effect of biochar doses, exchangeable sodium percentage (ESP) is more suitable to indicate the effects of salinization on the soil and the crops, according to Andrade Júnior et al. (2006). Therefore, we only discuss the variables pH, ESP, levels of organic carbon (CORG), P, K, and calcium and magnesium (CAMG). Most of these variables showed significant differences between the two samplings at the 1% probability level, with the exception of P (p < 0.05), whereas the effect of biochar was not significant for phosphorous content and ESP. The application of biochar to the soil is considered as a way of sequestering carbon and also of improving soil functions (VERHEIJEN et al., 2010). Some beneficial characteristics of biochar as a soil conditioner are its high cation exchange capacity,
high specific surface, and affinity for macro- and
micronutrients.
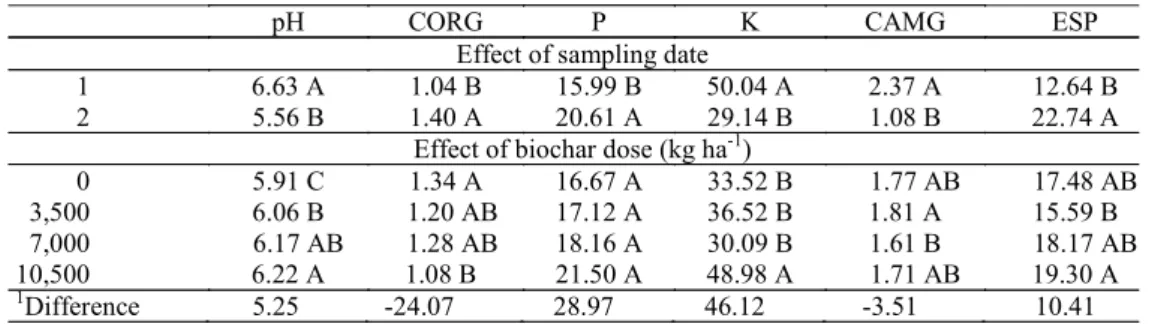
Joint regression analysis for the two seasons did not provide equations with significant parameters for soil chemical characteristics. However, comparison of means (Table 4) demonstrates that the values of pH, K, and CAMG decreased from the first to the second crops, which may be due to leaching of
nutrients and their consumption by the crops. On the other hand, increases in CORG and P may be due to their greater availability to the soil; alternatively, the reaction of carbon with the soil allowed its detection by the methodology employed. The increase in ESP was due to increased Na levels and decreases in calcium and magnesium.
Among the variables which significantly increased between the lowest and highest doses of biochar in the two samplings (Table 4), the largest increase was observed for K, with 46%, while pH increased by 5%. Although not statistically significant, the increase in soil P was 29%. In a similar study by Carvalho et al. (2013), the authors did not observe any effects of coal on levels of P and organic carbon. However, increases of soil P were observed by Chan et al. (2007) in pot experiments and by Silva et al. (2011). According to Madari et al. (2006), increased soil P levels may be due to the release of this element by biochar when in organic linkage with different forms of organic matter, while when in inorganic linkage with clay minerals in the soil, it is unavailable to plants. In a previous study by Petter et al. (2012), soil P availability increased by
17% with a dose of 32 Mg ha-1 of biochar in relation
to the control. According to Sohi et al. (2010), an indirect effect of biochar on soil P availability, besides the content of P in the ash fraction of
biochar, can explain the short-term effects of biochar
application.
Table 4. Comparison of means of soil chemical variables for both sampling dates and doses of biochar applied to the soil.
CORG = organic carbon; CAMG = sum of Ca and Mg contents; ESP = exchangeable sodium percentage. 1Difference (%) between the mean of dose zero and the highest mean. Means followed by
different letters differ significantly by Duncan´s test (p < 0.05).
Dose PRODC NPP NGP
Effect of biochar dose (kg ha-1)
0 5.77 6.25 3.91
3500 6.41 6.63 4.41
7000 5.56 5.88 4.08
10500 5.81 5.63 4.68
Effect of nitrogen dose (kg ha-1)
0 6.69 A 6.25 A 4.56 A 90 5.08 B 5.94 A 3.98 A
pH CORG P K CAMG ESP
Effect of sampling date
1 6.63 A 1.04 B 15.99 B 50.04 A 2.37 A 12.64 B 2 5.56 B 1.40 A 20.61 A 29.14 B 1.08 B 22.74 A
Effect of biochar dose (kg ha-1)
0 5.91 C 1.34 A 16.67 A 33.52 B 1.77 AB 17.48 AB 3,500 6.06 B 1.20 AB 17.12 A 36.52 B 1.81 A 15.59 B 7,000 6.17 AB 1.28 AB 18.16 A 30.09 B 1.61 B 18.17 AB 10,500 6.22 A 1.08 B 21.50 A 48.98 A 1.71 AB 19.30 A
1
Rev. Caatinga
The decrease of 24% in the organic carbon content of the soil, even after the application of biochar containing 63% of carbon, may be due to the
methodology employed (Walkley-Black modified).
Madari et al. (2006) also used this method and claim that it only quantifies oxidizable organic matter, while biochar, which is a more stable form of organic matter, is rarely quantified.
In the first sampling, we verified the significant effect of biochar dose on pH, CAMG (p < 0.05), and K (p < 0.01), which presented a CV of 50%. However, there was no significant effect of
N doses (30 and 60 kg ha-1) or the interaction
between doses of carbon and of nitrogen. Although Silva et al. (2011) affirm that in case of a short time of interaction between soil and biochar, the effect of biochar on soil chemical properties is lower than expected, Madari et al. (2006) observed significant effects 28 days after biochar application.
The increase in soil pH, as observed in this study, is the most quoted chemical change resulting from biochar application and is, according to Jeffery et al. (2011), one of its main positive effects, besides the promotion of indirect effects on soil chemistry (SOHI et al., 2010). The corrective effect of soil acidity, according to Verheijen et al. (2010), is one of the most probable mechanisms to increase crop yields after application of biochar to the soil. According to Wang et al. (2014), the main factors in
neutralization of soil acidity are the association of H+
ions with the biochar and decarboxylation processes. In this respect, a study of Petter et al. (2012) showed that the positive effect of application of coal on the soil pH increased with increased biochar doses.
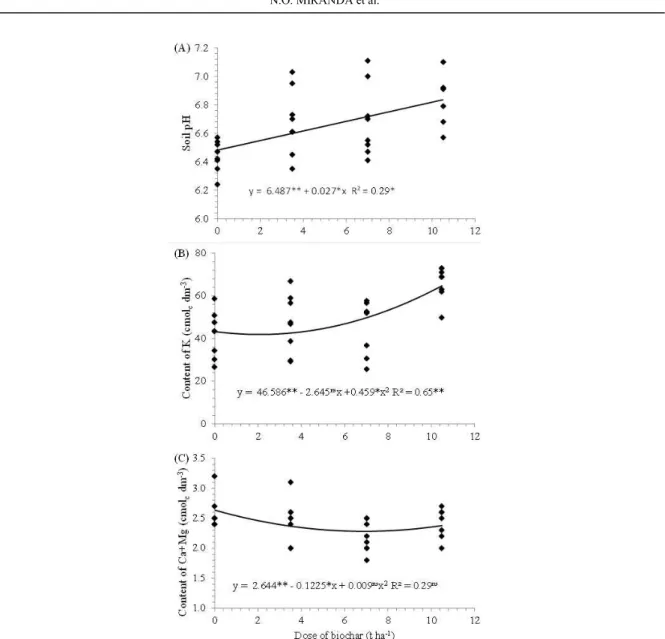
The effect of biochar dose on soil pH was linear positive (Figure 3A), leading to an increase of
6% in pH between the doses zero and 10,500 kg ha-1
of biochar. For K, the effect of biochar dose was quadratic (Figure 3B), with an increase of 73% between the lowest and highest doses of biochar. The effect on CAMG was also quadratic (Figure 3C) and showed a reduction of around 10% in CAMG contents. Although not statistically significant, an increase of 40% for P and a reduction of 62% in soil organic carbon were observed.
In a research by Streubel et al. (2011), the application of biochar to the soil, irrespective of its origin, significantly increased pH values of all soil types studied, with higher effects in sandy soil. In another study, Chan et al. (2007) observed that biochar applications provided an increase in soil pH
of 1.22 units between the doses zero and 100 Mg ha-1
in the absence of nitrogen fertilizer and 0.61 units when nitrogen fertilizer was applied. Verheijen et al.
(2010) performed a statistical meta-analysis of
studies on the yields of diverse crops and observed that, on average, soil pH increased from 5.3 before
application of biochar to 6.2 after application. The authors emphasized the use of biochar from cattle manure that promoted an increase in pH from 4.8 to 7.8.
In relation to increased soil K values during the duration of this experiment, Jeffery et al. (2011) state that higher nutrient availability, in particular K, is one of the main positive effects of biochar application on crop yields, apart from higher water retention and soil acidity reduction. Increased
plant-available potassium through biochar
application was also observed by Madari et al. (2006), Chan et al. (2007), and Silva et al. (2011).
Analysis of the data of the second sampling showed a significant effect of biochar doses only on
the variables pH (p < 0.01), CAMG, and ESP (p < 0.05), whereas as effect of N doses was
observed for pH and ESP, without significant interactions. Our results differ from those obtained by Petter et al. (2012), who had observed an effect of biochar on K availability only in the second year of the experiment. According to these authors, biochar contains considerable amounts of K and other nutrients. Increased soil K values were also observed by Carvalho et al. (2013); however, this increase was dependent on the N dose applied.
The effect of biochar dose on pH, CAMG, and ESP was quadratic (Figure 4). When the dose of
biochar was increased from 0 to 10,500 kg ha-1,
increases of 7% in pH and 19% in ESP were observed, whereas CAMG decreased by around 9%. The increase in ESP after application of biochar was due to increased soil sodium values (not presented) and decreased calcium and magnesium values. Although not statistically significant, increases around 23% in the content of P and 27% in K were observed between the lowest and highest doses of biochar.
The observed reduction in the contents of calcium (Ca) and magnesium (Mg) of the soil, which could have been dislocated from the sites of exchange to the soil solution and then leached, is in accordance with results found by Silva et al. (2011), who observed increased K and P values and reduced Ca and Mg concentrations in the soil after application of biochar. However, in contrast, Chan et al. (2007) observed that the use of high doses of biochar increased exchangeable cations. In this respect, Carvalho et al. (2013) observed linear increases of Ca and Mg in the soil due to increased biochar does, whereas Petter et al. (2012) observed increases of 36% in the calcium content of the soil
when biochar was applied at a dose of 32 Mg ha-1 in
Rev. Caatinga
Figure 3. Effect of biochar doses on soil pH (A), potassium content (B), and content of calcium and magnesium (C) in the first soil sampling. (**significant at 1% of probability; *significant at 5%; nsnon-significant).
Rev. Caatinga
Soil pH increased by 5% when a dose of
90 kg ha-1 of N was applied, compared to no
application of biochar (Table 5). In the case of ESP, we observed a 27% reduction when the dose was
increased from 0 to 90 kg ha-1. These results can be
explained by the application of calcium nitrate as N source.
In relation to the increase of ESP promoted by the application of biochar in the present work, which was also observed by Chan et al. (2007) in pot experiments, Verheijen et al. (2010) state that the
salts contained in biochar can be a potential source of secondary salinization. According to these authors, the composition of salts in the ash fraction of the biochar is highly dependent on the composition of its feedstock, although sodium is contained in lower amounts in relation to other minerals. The authors also point out the fact that there is little research on the ashes of the biochar and on the possibility of the salts becoming soluble and contributing to soil salinization.
Table 5. Comparison of means between doses of nitrogen for the soil chemical variables in the second sampling.
CONCLUSIONS
Application of biochar has no impact on the production of upland rice and cowpea.
Application of biochar improves soil N retention, which influences the shoot dry mass of rice, sterility of spikelets, number of panicles, and grain mass.
Application of biochar promotes increased pH, potassium content, and soil exchangeable sodium percentage, along with a decrease in calcium and magnesium contents.
REFERENCES
ANDRADE JÚNIOR, A. S. et al. Uso e qualidade da
água subterrânea para irrigação no semi-árido
piauiense. Revista Brasileira de Engenharia
Agrícola e Ambiental, Campina Grande, v. 10, n. 4,
p. 873-880, 2006.
BARRETO, J. H. B. et al. Yield performance of upland rice cultivars at different rates and times of
nitrogen application. Revista Brasileira de Ciência
do Solo, Viçosa, v. 36, n. 2, p. 475-483, 2012.
BUZETTI, S. et al. Resposta de cultivares de arroz a doses de nitrogênio e do regulador de crescimento
cloreto de clormequat. Pesquisa Agropecuária
Brasileira, Brasília, v. 41, n. 12, p. 1731-1737, 2006.
CARVALHO, M. T. M. et al. Biochar improves soil fertility of a clay soil in the Brazilian Savannah:
short term effects and impact on rice yield. Journal
of Agriculture and Rural Development in the Tropics and Subtropics, Witzenhausen, v. 114, n. 1,
p. 101-107, 2013.
CHAN, K. Y. et al. Agronomic values of greenwaste
biochar as a soil amendment. Soil Research,
Canberra, v. 45, n. 8, p. 629–634, 2007.
DING, Y. et al. Evaluation of biochar effects on
nitrogen retention and leaching in multi-layered soil
columns. Water, Air & Soil Pollution, Dordrecht, v.
213, n. 1-4, p. 47-55, 2010.
DUTRA, A. S. et al. Produtividade e qualidade fisiológica de sementes de feijão caupi em função da
adubação nitrogenada. Revista Ciência
Agronômica, Fortaleza, v. 43, n. 4, p. 816-821,
2012.
EMPRESA BRASILEIRA DE PESQUISA
AGROPECUÁRIA - EMBRAPA. Manual de
análises químicas de solos, plantas e fertilizantes. 2. ed. Brasília, DF: Embrapa Informação
Tecnológica, 624 p. 2009.
FABRE, D. V. O. et al. Doses e épocas de aplicação
de nitrogênio em arroz de várzea. Pesquisa
Agropecuária Tropical, Goiânia, v. 41, n. 1,
p. 29-38, 2011.
FOOD AND AGRICULTURE ORGANIZATION
OF THE UNITED NATIONS - FAO. The state of
the world’s land and water resources for food and
agriculture. Managing systems at risk. Summary
Report. Rome, 2011. 47 p.
JANZEN, H. H. The soil carbon dilemma: Shall we
hoard it or use it? Soil Biology & Biochemistry,
Amsterdam, v. 38, n. 3, p. 419–424, 2006.
JEFFERY, S. et al. A quantitative review of the effects of biochar application to soils on crop
productivity using meta-analysis. Agriculture,
Ecosystems & Environment, Amsterdam, v. 144, n. 1, p. 175–187, 2011.
Dose pH CORG P K CAMG ESP
0 kg ha-1 5.43 B 1.33 B 21.84 A 30.51 A 1.07 A 25.33 A
90 kg ha-1 5.68 A 1.46 A 19.37 A 28.14 A 1.09 A 19.88 B
Rev. Caatinga
KISCHEL, E. et al. Efeito do Nitrogênio em genótipos de arroz cultivados em várzea úmida do
Estado do Tocantins. Revista Ceres, Viçosa, v. 58,
n. 1, p. 84-89, 2011.
LINHARES, C. R. et al. Reproducing the organic matter model of anthropogenic dark earth of Amazonia and testing the ecotoxicity of
functionalized charcoal compounds. Pesquisa
Agropecuária Brasileira, Brasília, v. 47, n. 5, p.
693-698, 2012.
MADARI, B. E. et al. Carvão vegetal como
condicionador de solo para arroz de terras altas
(cultivar Primavera): um estudo prospectivo.
Santo Antônio de Goiás: Embrapa Arroz e Feijão,
2006. 6 p. (Comunicado Técnico, 125).
MAIA, C. M. F.; MADARI, B. E.; NOVOTNY, E.
H. Advances in biochar research in Brazil. Dynamic
Soil, Dynamic Plant, Kagawa, v. 5, n. 1, p. 53-58,
2011.
MARTINS, R. N. L. et al. Nitrogênio e
micronutrientes na produção de grãos de feijão-caupi
inoculado. Semina: Ciências Agrárias, Londrina, v.
34, n. 4, p. 1577-1586, 2013.
MINGOTTE, F. L. C.; HANASHIRO, R. K.; FORNASIERI FILHO, D. Response of rice cultivars
to nitrogen in upland conditions. Revista Ceres,
Viçosa, v. 60, n. 1, p. 86-95, 2013.
NÓBREGA, I. P. C. Efeitos do biochar nas
propriedades físicas e químicas do solo: sequestro de carbono no solo. 2011. 38 f. Dissertação (Mestrado em Engenharia do Ambiente) –
Universidade Técnica de Lisboa, Lisboa, 2011.
OLIVEIRA, A. P. et al. Rendimento de feijão-caupi
em função de doses e formas de aplicação de
nitrogênio. Horticultura Brasileira, Brasília, v. 21,
n. 1, p. 77-80, 2003.
PETTER, F. A. et al. Soil fertility and upland rice yield after biochar application in the Cerrado.
Pesquisa Agropecuária Brasileira, Brasília, v. 47,
n. 5, p. 699-706, 2012.
SANTOS, H. G. et al. Sistema Brasileiro de
Classificação de Solos. 3. ed. Brasília, DF:
Embrapa, 2013. 353 p.
SILVA, M. A. S. et al. Efeito da aplicação de biochar sobre propriedades químicas do solo e produtividade de feijoeiro comum irrigado. In: CONGRESSO NACIONAL DE PESQUISA DE FEIJÃO, 10.,
2011, Goiânia. Anais... Goiânia: Embrapa Arroz e
Feijão, 2011. CD-ROM.
SOHI, S. P et al. A review of Biochar and its use and
function in soil. Advances in Agronomy, San
Diego, v. 105, s/n., p. 47-82, 2010.
SOMBROEK, W. G. et al. Amazonian Dark Earths as carbon stores and sinks. In.: LEHMANN, J. et al.
(Eds.). Amazonian Dark Earths: origin,
properties, and management. Dordrecht: Kluwer
Academic Publishers, 2003. p. 125-139. Disponível
em:<http://link.springer.com/chapter/10.1007/1
-4020-2597-1_7>. Acesso em: 29 jan. 2014.
STEINER, C. et al. Reducing nitrogen loss during
poultry litter composting using biochar. Journal of
Environmental Quality, Madison, v. 39, n. 4, p.
1236-1242, 2010.
STREUBEL, J. D. et al. Influence of contrasting biochar types on five soils at increasing rates of
application. Soil Science Society of America
Journal, Madison, v. 75, n. 4, p. 1402-1413, 2011.
VERHEIJEN, F. et al. Biochar Application to
Soils. A Critical Scientific Review of Effects on Soil Properties, Processes and Functions. Ispra (Itália): European Commission, Joint Research Centre Institute for Environment and Sustainability, 2010.
166 p. Disponível em: <http://
eusoils.jrc.ec.europa.eu/esdb_archive/eusoils_docs/ other/ eur24099.pdf> Acesso em: 29 jan. 2014.
YOSEFTABAR, S. Effect of nitrogen management on panicle structure and yield in rice (Oryza sativa
L.). International Journal of Agriculture and
Crop Sciences, London, v. 5, n. 11, p. 1224-1227,
2013.
YOSHIDA, S. Fundamentals of rice crop science.
Los Baños: IRRI, 1981. 269 p.
ZHANG, Y. J. et al.Effects of nitrogen nutrition on
grain yield of upland and paddy rice under different
cultivation methods. Acta Agronomica Sinica,
Beijing, v. 34, n. 6, p. 1005–1013, 2008.
WANG, L. et al. Effect of crop residue biochar on soil acidity amelioration in strongly acidic tea garden
soils. Soil Use and Management, Bedford, v. 30, n.