Crop Breeding and Applied Biotechnology 10: 357-363, 2010 Brazilian Society of Plant Breeding. Printed in Brazil
Received 29 October 2009 Accepted 25 January 2010
Stability and adaptability of upland rice genotypes
Stability and adaptability of upland rice genotypes
Stability and adaptability of upland rice genotypes
Stability and adaptability of upland rice genotypes
Stability and adaptability of upland rice genotypes
Marcio Balestre1*, Vanderley Borges dos Santos2, Antonio Alves Soares2 and Moisés Souza Reis2
ABSTRACT- The aim of this study was to identify upland rice genotypes with high stability and adaptability by the GGE biplot method based on the predicted genotypic and phenotypic values. Of the 20 genotypes evaluated, 14 were lines developed by the cooperative program for rice improvement of Minas Gerais and six were controls. The GGE biplot analysis showed that cultivar BRS Pepita and MG1097 were closest to the ideal genotype. In the comparison of the fixed with the random models (% G + GE, prediction error sum of squares and correlation), it was observed that the use of phenotypic means in all comparative parameters indicated a lower predictive potential under simulated imbalance than the use of predicted genotypic values. The conclusion was drawn that BRS Pepita and MG1097 are ideal genotypes for southern Minas Gerais and that the predictive power of the phenotypic means underlying the study of stability and adaptability is lower than of genotypic means.
Key words: Oryza sativa, cross-validation, genotype by environment interaction, BLUP.
INTRODUCTION
The evaluation phase of the genotypes prior to recommendation in different environments is a costly step that requires a high level of investment. These assessments are extremely important, especially when the objective of the breeder is to select lines with high homeostasis and adaptability, i.e., high-yielding genotypes associated with high yield stability.
In the state of Minas Gerais, lines of the upland rice breeding program are evaluated in various environmental conditions, which maximize the influence of the interaction of phenotypic values with environments (Atroch et al. 2000). The breeder must therefore use tools to efficiently and accurately measure the response of these lines in multiple test environments (Yan et al. 2007).
The use of biplots to quantify the genotype environment interaction (IGE) is widespread since the GE effects can be
visualized in a single graph, which facilitates the comparison of genotypes and their interaction with the environments (Gauch and Zobel 1996). More recently, Yan et al. (2000) proposed a new technique in the IGE analysis using biplots similar to the AMMI technique, which has the advantage of decomposing the joint effect of genotype (G) and GE (G + GE) by principal component analysis, differing from the original AMMI analysis that decomposes only GE (Yan et al. 2007). The method was called GGE biplot by Yan et al. (2000).
Although the use of this method for decomposing G + GE together is criticized (Gauch et al. 2008), the advantage of observing the effects of G + GE in a biplot graph indicates this technique as a good alternative to the AMMI analysis, in which the G effect can not be visualized directly in the biplot graphic AMMI2, requiring the use of additional procedures since the method decomposes only GE in the principal component analysis. Besides, although the GGE
biplot analysis is very similar to AMMI 1, it usually explains a greater proportion of G + GE and could, in most cases, result in a more accurate graphic (Yan et al. 2007, Gauch et al. 2008, Balestre et al. 2009a). This statement can however not be taken as a rule (Balestre et al 2009b).
To use GE analysis techniques, breeders generally rely on the data means (phenotypic values) to evaluate the phenotypic stability. However, some authors criticize the use of phenotypic means since these are influenced by environmental or nuisance factors that reduce the predictive value for future assessments (Smith et al. 2001). A classical approach still little used in GEI evaluations is the use of the BLUPs of genotype effects and their interaction with environments in order to quantify genotypic stability and adaptability. Accordingly, some methods were proposed, e.g., the method that uses the harmonic mean of genotypic values proposed by Resende (2004) and a modification of the AMMI method using mixed models called FAMM (Resende and Thompson 2004). However, no techniques using mixed models was applied in the GGE biplot method.
The aim of this study was to evaluate and identify genotypes with high stability and adaptability by the GGE biplot method, using predicted phenotypic and genotypic values to compare their predictive accuracy.
MATERIAL AND METHODS
Fourteen inbred lines developed by the cooperative rice breeding program in Minas Gerais plus six additional controls were evaluated in a randomized block design with three replications. Each plot consisted of five 5-m-long rows, of which the three central lines were evaluated without the outer 0.50 m of each row. The rows were spaced 0.40 m apart, with a density of 60 viable seeds per meter. The crop was treated with the normal cultural practices. The lines and controls were evaluated in seven environments in the 2007/2008 growing season (Table 1).
Two different approaches were used to assess stability and adaptability.
First the classical approach was used based on the analysis of variance (ANOVA) and use of phenotypic means. In this case, the effects of genotype and interaction were considered as fixed in the model.
To evaluate the phenotypic stability and adaptability, the GGE biplot analysis performed, considering the simplified model for two main components:
Yij - y.j = λ1ξi1ηj1 + λ2ξi2ηj2 + εij
where: Yijis the mean yield of cultivar i in environment j; y.j is the mean of environment j;λ1ξilηj1 is the first principal component (PC1); λ2ξi2ηj2 is the second principal component (PC 2); λ1and λ2 and are the singular values associated with the components PC1 and PC 2; ξi1 and ξi2 are the scores of the axes PC 1 and PC 2 for genotype; ηj1 and ηj2 are the scores of axes PC 1 and PC 2 for environment; and εij is the error associated to the model. The biplot was constructed based on the scores of the first two principal components.
In the second approach, the effects of genotype (G) and genotype by environment (GE) were considered as random in the model. In this case, the best linear unbiased prediction (BLUP) of G and GE effects was calculated. The following linear model was used for this purpose:
Y = Xb + Zg + Wi + e
where Y is the observation vector, b is the vector of fixed effects (overall mean and blocks within environments), g is the vector of genotypic effects (assumed to be random), i is the vector of genotype environment interaction (random) and e is the error vector. X, Z and W are the incidence matrices of the effects of b, g and e, respectively.
The combined solution for fixed and random effects was obtained by the equation system according to Henderson (1984):
where
and
The components of genotypic variance , of the variance of GE interaction and residual were estimated by the method of restricted maximum likelihood (REML).
For all analyses and the construction of biplots the software package SAS was used with the IML (Interactive Matrix Language) procedure and SAS GRAPH (SAS Institute 2000).
In both cases, cross-validation tests were carried out with the results of the GGE biplot to compare in which approaches the prediction or predictive accuracy of the performance of genotypes in the environments under imbalance was better. For this purpose, the prediction error sum squares (PRESS) was used (Gabriel 2002), which measures the discrepancy between the observed phenotypic and the predicted value , as expressed by:
(σ2) g (σ2)
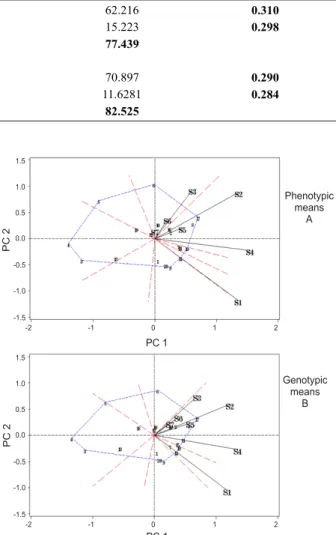
Summaries of the analysis and singular value decomposition of the PRESS of the two approaches are described in Table 3. In all comparative parameters used, the predictive potential of phenotypic means was lower under simulated imbalance than when using BLUP-estimated genotypic values. The proportion of the G and GE effects in the PCs was smaller and the value of prediction error for both principal components higher. The same result is shown in Figure 1, where the accuracy values were consistently lower than those obtained by genotypic values. Nevertheless, the graphical analyses were very similar (Figure 2).
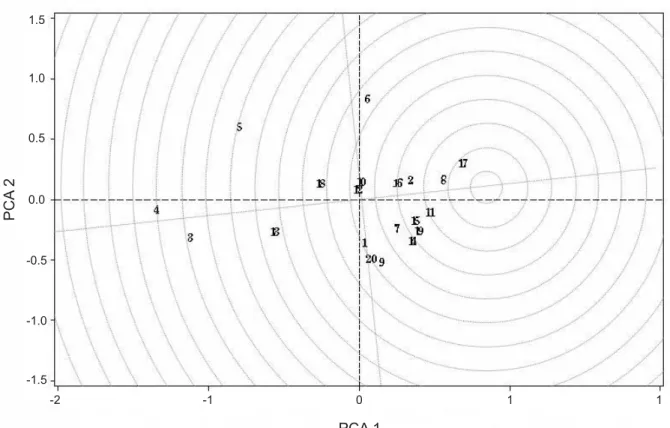
The best-adapted genotypes were BRS Pepita (17), followed by the line MG 1097 (8) and cultivar BRSMG Caravera (11) (Figure 3b). On the other hand, the most stable genotypes were those with number 4, 11 and 12 (BRA 042160, BRSMG Caravera and BRSMG lightning, respectively). In this figure, two possible mega-environments can be observed. Within the first mega-environment, BRS Pepita (17) can be considered the winning genotype for being on the edge of the polygon, where six of the seven environments studied are located. In the other mega-environment, line CMG 1152 (14) was the winning genotype in Lambari upland (S1).
The ideal test environments would be those closest to the set of locations (PC2 near the average environmental coordinate) and with greater capacity to discriminate genotypes (High PC1). Thus it can be concluded that Lavras (S4), Lambari (S2) and Lavras (S3) were the most ideal test environments.
Figure 3 also shows the distance of genotypes from the ideal genotype obtained by the average environmental coordinate (AEC). In this case, according to Yan and Hunt (2002) only one mega-environment is considered and the ideal genotype is the one located closest to the location of AEC, where the genotypes are considered stable if they are on the AEC line and productive if the PC is high and positive. Accordingly, it can be inferred that BRS Pepita, Furthermore, the accuracy was calculated based on
the correlation matrix between predicted and observed matrix means.
RESULTS AND DISCUSSION
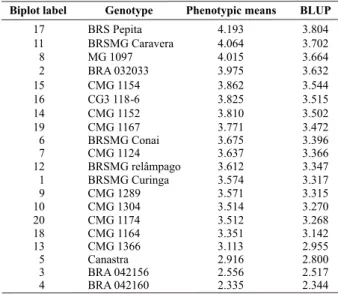
The phenotypic and genotypic mean values obtained by BLUP are shown in Table 2. Both the phenotypic and genotypic means showed that cultivar BRS Pepita was the most productive, followed by BRSMG Caravera, MG 1097 and BRA 032033. The genotype ranking in the two approaches did not differ either, as already expected, since the data are balanced. The results of ANOVA showed that all sources of variation (genotypes, environments and IGE) differed significantly at 5% probability.
Table 1. Description and characterization of the locations used in the evaluation of 20 rice genotypes in the 2007/2008 growing season
MG 1097 (8) and CMG in 1167 (19), differing considerably from the results in Table 2. However, in the GGE based on genotypic means, although the second and third genotypes were inverted, the PC1of the three most productive genotypes was also higher, i.e., Pepita (17), MG 1097 (8) and BRSMG Caravera (11), confirming the better performance of the GGE biplot when using genotypic than when using phenotypic means.
The use of phenotypic means is widespread in stability and adaptability studies on different crops. But, as pointed out above, the use of phenotypic means should MG 1097 and BRSMG Caravera are closest to the genotype
considered ideal, which combines high productivity and good stability. Interestingly, based on the observed means and distance to the ideal genotype, the ranking of the genotypes BRSMG Caravera and MG 1097 was changed Line BRA 042160 (4) was very stable, however, farther away from the ideal genotype, because the mean was lowest, indicating that genotypes with high stability and low productivity can be discarded directly by GGE analysis. However, these inferences are only valid when all information on the data is accurately summarized in the graphic analysis. Concerning this, some points regarding the graphic accuracy will be emphasized.
It was found that the correlation between PC1 values and the means was higher when genotypic values were used, i.e., the correlation value of the conventional GGE biplot with phenotypic means was 0.964, versus 0.987 using BLUP. This fact can be observed directly in the biplot in Figure 3a, where the sequence of means of the most productive genotypes follows the order: BRS Pepita (17),
Table 3. Recovery of the sum of squares of the G and GE effects indicated on the axes (PC1 and PC2) and sum of squares of the error of prediction (PRESS) associated to each axis of the GGE biplot analysis used in the evaluation of the stability and adaptability of 20 rice genotypes assessed in seven environments in the 2007/2008 growing season
Figure 1.Predictive accuracy of the GGE biplot models considering the use of the mean phenotypic and genotypic values estimated by the REML/BLUP method for 20 rice genotypes evaluated in seven environments for grain yield, in the 2007/2008 growing season.
Figure 2.GGE biplot analysis considering the mean phenotypic (a) and genotypic values estimated by REML/BLUP (b) for 20 rice genotypes evaluated in seven environments for grain yield, in the 2007/2008 growing season.
1.5
1.0
0.5
0.0
-0.5
-1.0
-1.5
not be seen as an optimal procedure to predict genotypic values, due to the strong influence of the “nuisance” or interferences (block, plot, location, year, etc.), which are intermingled in the means, masking the real genotypic value. According to Smith et al. (2001), to predict the future performance of genotypes, as is normally done in studies to quantify the IGE as well as stability and adaptability, considering the effect of genotypes as random in the model (BLUP) will most likely lead to the most realistic estimations. This fact became evident in this study, where the values of predictive accuracy were higher when BLUP-estimated genotypic values were used instead of phenotypic mean values in the GGE biplot analysis. Furthermore, the use of phenotypic means resulted in a higher PRESS value, confirming that this estimator would not be the best choice for stability and adaptability studies.
This accuracy was tested by the cross-validation method proposed by Gabriel (2002). In this prediction or cross-validation method, the values of the effects of G + GE (rows and columns) are removed one at a time from a two-way table, which contains the genotypic and environmental effects. Later these values are predicted by
the GGE model. In each cycle of imbalance, the estimate is stored until all genotypes that are imbalanced within each environment are predicted. Then, the values of accuracy and PRESS (Dias and Krzanowski 2003) are obtained using the values of correlation between the prediction table and the table of means.
In this case, the observations confirmed the graphical analysis, in other words, as pointed out by Yan et al. (2001), PC 1 tends to be highly correlated with the means, but when this correlation was calculated, it was higher when based on genotypic rather than on phenotypic means. The greater accuracy was therefore confirmed by cross-validation.
environments (BRS Pepita and CMG 1152). However, small changes occurred in the ranking of the most adapted genotypes (Figure 3a) which can eventually lead to an error of recommendation.
Based on the empirical results of this study it is possible to demonstrate that the mixed model approach for studying the stability and adaptability may be superior to conventional analysis based on estimated performance means of genotypes under imbalance.
Therefore, we conclude that the predictive power of phenotypic means underlying stability and adaptability
studies is lower than of BLUP-estimated genotypic means. Furthermore, it was concluded that BRS Pepita was the cultivar closest to the ideal for the south of Minas Gerais, followed by line MG 1097.
ACKNOWLEDGEMENTS
The authors would like to thank the Pro-Reitoria de Pós-Graduação (PRPG) of the Universidade Federal de Lavras for supporting this research.
Estabilidade de adaptabilidade em genótipos de arroz de
Estabilidade de adaptabilidade em genótipos de arroz de
Estabilidade de adaptabilidade em genótipos de arroz de
Estabilidade de adaptabilidade em genótipos de arroz de
Estabilidade de adaptabilidade em genótipos de arroz de
terras altas
terras altas
terras altas
terras altas
terras altas
RESUMO- O objetivo deste trabalho foi identificar genótipos de arroz de terras altas com alta estabilidade e adaptabilidade, pelo método GGE biplot empregando os valores fenotípicos e genotípicos preditos. Foram avaliados 20 genótipos, sendo 14 linhagens desenvolvidas pelo programa cooperativo de melhoramento de arroz de Minas Gerais e seis testemunhas. Verificou-se que a cultivar BRSPepita e MG1097, foram as mais próximas do “genótipo ideal” pela análise GGE Biplot. Em todos os parâmetros comparativos utilizados para comparação do modelo fixo e aleatório (% G+GE, PRESS e correlação), observou-se que o uso das médias fenotípicas apresentou menor potencial preditivo sob desbalanceamento simulado quando comparadas com o uso dos valores genotípicos preditos. Conclui-se que a cultivar BRS Pepita e MG1097 são os genótipos ideais para o sul de Minas Gerais e que a utilização das médias fenotípicas, como base para estudo de estabilidade e adaptabilidade, possui menor poder preditivo quando comparada ao uso das médias genotípicas.
Palavras-chave: Oryza sativa,validação cruzada, interação genótipos por ambientes, BLUP.
REFERENCES
Atroch AL, Soares AV and Ramalho MAP (2000) Adaptabilidade e estabilidade de linhagens de arroz de sequeiro testadas no estado de minas gerais. Ciência e Agrotecnologia 24: 541-548.
Balestre M, Souza JC, Von Pinho RG, Oliveira RL and Paes MVP (2009a) Yield stability and adaptability of maize hybrids based on GGE biplot analysis characteristics. Crop Breeding and Applied Biotechnology 9: 226-234.
Balestre M, Von Pinho RGV, Souza JC and Oliveira RL (2009b) Genotypic stability and adaptability in tropical maize based on AMMI and GGE biplot analysis. Genetics and Molecular Research 9: 123-1135.
Dias CTS and Krzanowski WJ (2003) Model selection and cross validation in additive main effect and multiplicative interaction models. Crop Science 43: 865–873.
Gabriel KR (2002) Le biplot– outil d’exploration de données multidimensionelles. Journal de la Société Française de Statistique 143: 5-55.
Gauch HG, Piepho HP and Annicchiarico P (2008) Statistical analysis of yield trials by AMMI and GGE: further considerations. Crop Science 48: 866–889.
Gauch HG and Zobel RW (1996) AMMI analysis of yield trials. In Kang MS and Gauch Jr. HG (eds.) Genotype-by-environment interaction. CRC Press, Boca Raton, p. 85–122.
Henderson CR (1984) Applications of linear models in animal breeding. University Guelph, Guelph, 461p.
Resende MDV (2004) Métodos estatísticos ótimos na análise de experimentos de campo. Embrapa Florestas, Colombo, 65p.
Resende MDV and Thompson R (2004) Factor analytic multiplicative mixed models in the analysis of multiple
experiments. Brazilian Journal of Mathematics and
Statistics 22: 31-52.
Smith A, Cullis B and Gilmour A (2001) The analysis of crop variety evaluation data in Australia. Australian and New Zealand Journal of Statistical2: 129-145.
Stein C (1955) Inadmissibility of the usual estimator for mean of
multivariate normal distribution. In Symposium on
mathematical statistics and probability. University of California Press, Berkeley, p. 197-206.
Yan W and Hunt LA (2002) Biplot analysis of multi-environment trial data. In Kang MS (ed.) Quantitative Genetics, Genomics and Plant Breeding. Louisiana State University, Louisiana, p. 289-304.