* Corresponding author: E-mail: [email protected]
Received: February 19, 2015 Approved: October 15, 2015
How to cite: Dotto AC, Dalmolin RSD, ten Caten A, Moura-Bueno JM. Potential of Spectroradiometry to Classify Soil Clay Content. Rev Bras Cienc Solo. 2016;v40:e0151105.
Copyright: This is an open-access article distributed under the terms of the Creative Commons Attribution License, which permits unrestricted use, distribution, and reproduction in any medium, provided that the original author and source are credited.
Potential of Spectroradiometry to
Classify Soil Clay Content
André Carnieletto Dotto(1)
, Ricardo Simão Diniz Dalmolin(2)*
, Alexandre ten Caten(3) and Jean Michel Moura-Bueno(1)
(1)
Universidade Federal de Santa Maria, Departamento de Solos, Programa de Pós-graduação em Ciência do Solo, Santa Maria, Rio Grande do Sul, Brasil.
(2)
Universidade Federal de Santa Maria, Departamento de Solos, Santa Maria, Rio Grande do Sul, Brasil. (3)
Universidade Federal de Santa Catarina, Centro de Curitibanos, Departamento de Agricultura, Biodiversidade e Floresta, Curitibanos, Santa Catarina, Brasil.
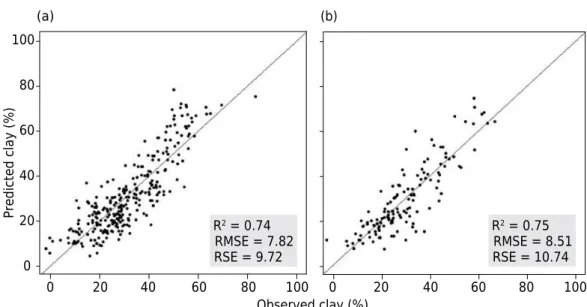
ABSTRACT: Diffuse reflectance spectroscopy (DRS) is a fast and cheap alternative for soil clay, but needs further investigation to assess the scope of application. The purpose of the study was to develop a linear regression model to predict clay content from DRS data, to classify the soils into three textural classes, similar to those defined by a regulation of the Brazilian Ministry of Agriculture, Livestock and Food Supply. The DRS data of 412 soil samples, from the 0.0-0.5 m layer, from different locations in the state of Rio Grande do Sul, Brazil, were measured at wavelengths of 350 to 2,500 nm in the laboratory. The fitting of the linear regression model developed to predict soil clay content from the DRS data was based on a R2 value of 0.74 and 0.75, with a RMSE of 7.82 and
8.51 % for the calibration and validation sets, respectively. Soil texture classification had an overall accuracy of 79.0 % (calibration) and 80.9 % (validation). The heterogeneity of soil samples affected the performance of the prediction models. Future studies should consider a previous classification of soil samples in different groups by soil type, parent material and/or sampling region.
INTRODUCTION
Particle size is one of the most stable soil physical properties and represents the quantitative distribution of the size of the mineral solid particles. The high stability of this property makes it essential for the description, identification and classification of soils (Santos et al., 2013). Particle size influences soil chemical properties directly, as well as soil structure, compaction degree, and water availability and storage, among others. Thus, particle size is a quantitative soil property that must be determined to ensure an adequate management of this natural resource.
Soil particle size is usually determined by a method described by Donagema et al. (2011). Texture can be evaluated directly in the field through touch sensitivity and is widely used in morphological descriptions of soil profiles (Santos et al., 2013). The methods recommended for routine laboratory analysis produce errors (Ruiz, 2005). In view of the diversity of forms and methods adopted by many soil laboratories for particle size determination, Klein et al. (2013) evaluated two methods for quality control of particle size analyses and found that size fractions with the highest percentage of misclassification are silt and clay. Furthermore, clay is the fraction that causes inconsistencies in the results due to its difficulty of particle dispersion (Suzuki et al., 2015). Additionally, Sousa Junior et al (2011) stated that the determination of particle size distribution in soil laboratories is often costly and time-consuming, particularly in the case of large volumes of samples for analysis.
Changes in the legislation of agricultural financing and insurance have increased the volume of particle size analyses in laboratories across the country. The regulation (Normative n. 2) of the Brazilian Ministry of Agriculture, Livestock and Supply (MAPA) (Brasil, 2008) classifies the particle size of agricultural soils as follows: type 1 – sandy soils with a clay content in the range of 10-15 %, or with ≥15 % clay content and a difference between the percentage of sand and clay is ≥50 %; type 2 – medium-textured soils with minimum content of 15 % and less than 35 % clay, where the difference between sand and clay percentages is <50 %; type 3 – clayey soils with a clay content of ≥35 %. These values were adopted for agricultural zoning by MAPA to classify soils in climate risk regions and are being used by research support institutions and agricultural insurance agencies as a condition for approval of payments.
With the advancement of technology, alternative methods to assess soil particle size have been developed (Viscarra Rossel et al., 2010). Diffuse reflectance spectroscopy (DRS) is a promising new option for soil analysis, with advantages such as ease of data acquisition from large amounts of samples, within less time and without involving environmentally hazardous chemicals (Viscarra Rossel et al., 2010; Sousa Junior et al., 2011; Ramirez-Lopez et al., 2014). DRS can be an alternative to current methods of routine analyses, since particle size is one of the most relevant properties for soil spectral reflectance (Dalmolin et al., 2005; Demattê and Terra, 2014). Improvements are needed, mainly in terms of model accuracy (requiring model training and validation variables) and of spatial dependence relations, to establish relationships with the environment.
This study investigated the hypothesis that DRS model can group the soils into three textural classes turning this technique a potential particle size classification analysis for routine laboratory. The objective of this study was to determine the clay content by DRS to group the soils into three textural classes (1, 2 and 3) based on the particle size classification for agricultural soils, according to the regulation (Normative N. 2) of MAPA (Brasil, 2008) and to test the potential of this technique for routine laboratory analyses of particle size.
MATERIALS AND METHODS
by the densimeter method, as described by Donagema et al. (2011). From the 0.0-0.5 m layer (determined by the regulation), 412 samples with highly heterogeneous particle size were selected (Figure 1b). These samples were also highly heterogeneous with regard to color, organic matter content, and parent material. Out of this total, samples were randomly divided into two subsets, one with 276 samples for model calibration (70 %) and the other with 136 samples for model validation (30 %).
Diffuse reflectance spectroscopy (DRS) data were obtained in a laboratory with a FieldSpec 3 (ASD) spectroradiometer, in a range from 350 to 2,500 nm. About 100 g of each soil sample (air-dried, ground and sieved through 2 mm mesh) were placed on a Petri dish for two readings per sample, rotating the plate (180°) after each reading, and the mean of both readings was calculated. The sensor was placed vertically, 0.08 m away from the sample, to measure light reflectance in an area of about 2 cm2 in the center of the sample. The light source was a 50
W halogen lamp with a collimated beam not directed to the target plane, placed 0.40 m away from the sample, in a 45° angle in relation to the zenith. A white plate coated with barium sulfate (BaSO4) was used as reference standard. The spectra were determined by averaging
the 100 scan readings made by the sensor in 10 s. All spectra were measured in a chamber (1.00 × 0.75 × 1.00 m) painted black on the inside, to avoid interference from stray light.
The descriptive statistical analysis of the calibration and validation sets was performed to describe the population sample, summarize the data, and identify relationships and differences among variables. The Pearson asymmetry index was used to assess whether the data distribution was symmetric or asymmetric. To reduce the dimensionality of the predictor variables, 2,150 spectral reflectance values were grouped, based on the mean of 10 per 10 nm spectrum (Vasques et al., 2008), reducing the variables to 215 reflectance values. A linear regression model (LRM) was fitted for clay based on the function lm (linear model) and stepwise in the R programming language (R Core Team, 2014). To evaluate the LRM of the calibration and validation sets, we used the coefficient of determination (R2), the root of
the mean square error (RMSE – root mean square error) and residual standard error (RSE). For the descriptive statistical analysis and LRM the statistical package R (stats) was used.
Clay contents determined by the densimeter and the DRS method were used to separate the soils into three clay classes: Class 1 – clay content below 15 %; class 2- clay content of at least 15 % and maximally 35 % and class 3 – clay content greater than or equal to 35 %. These classes are consistent with the texture groups sand, medium and clay texture, respectively (Santos et al., 2013) and similar to the particle size classification for agricultural
Figure 1. Sampling location in the state of Rio Grande do Sul, Brazil (a) and distribution of the
proportions of sand, silt and clay of 412 samples in a soil texture diagram, based on the classification of Santos et al. (2013) (b) (very clayey: MA, clay: A, silty: S, medium silty: MeS, medium clay: MeA; medium sandy: MeAr; sandy medium: ArMe and very sandy: MAr).
[%] Sand 50–2000 µm 90
[%] Clay 0–2 µm
[%] Silt 2–50 µm
80 70 60 50 40 30 20 10 90 80 70 60 50 40 30 20 10 90
80
70
60
50
40
30 20
10
S MA
A
MeS MeAr
MeA
ArMe MAr Legend
Sample sites
a) 57° 00’ 00” W 54° 00’ 00” W 51° 00’ 00” W b)
27° 00’ 00”
S
30° 00’ 00”
S
33° 00’ 00”
S
0 100 200 300 400 km
soils according to the regulation (Normative n. 2) of MAPA (Brasil, 2008) by which soils are labeled according to types (type 1, type 2 and type 3), considering mainly the clay content.
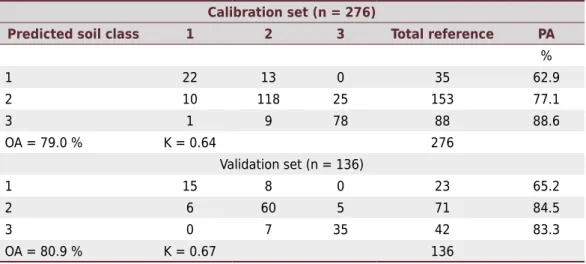
The two methods of soil texture classification were compared by an error matrix, calculating the accuracy values of class prediction (PA), overall accuracy (OA) and Kappa index (K) (Congalton, 1991).
RESULTS AND DISCUSSION
Descriptive statistics of the data
When testing the statistical performance of the data by descriptive analysis, the mean clay, sand and silt contents were 30.95, 37.38 and 31.66 %, respectively (Figure 2), i.e., the set of 412 soil samples has an equivalent mean. The standard deviations of the properties have different trends, but the coefficient of variation (CV) was similar for clay and sand (0.53 and 0.52), i.e., the dispersion of means was high.
For silt, the CV was lower (0.44), but the data deviation from the mean was still high. The asymmetry values showed that the distribution for the three properties was positive and asymmetric. Descriptive analysis combined with the evaluation of the histograms showed that the properties have an adequate distribution for the statistical data analysis.
Prediction of clay content by DRS
The descriptive statistical analysis of the calibration and validation sets showed data similarity, confirming the homogeneity of the groups. The LRM for clay was:
Clay = 43.68 + (-727.1×R420) + (4301×R440) + (-31600×R460) + (90180×R470) + (-113200×R480) + (67390×R490) + (-16080×R500) + (-2686×R550) + (2562×R560) + (-4342×R660) + (10100×R680) + (-9586×R700) + (18990×R740) + (-15370×R750) + (5883×R900) + (-7908×R910) + 3930×R950) + (-4226×R980) + (2340×R990) + (937,9×R1000) + (-1044×R1020) + (4396×R1110) + (-7307×R1170) + (-4879×R1220) + (4911×R1280) + (7939×R1300) + (-4768×R1310) + (2459×R1380) + (-2997×R1390) + (4153×R1410) + (3507×R1530) + (-5175×R1540) + (-4063×R1560) + (4050×R1590) + (-6930×R1640) + (8573×R1650) + (6149×R1690) + (-9664×R1700) + (4585×R1720) + (-4163×R1740) + (-1343×R1870) + (1793×R1930) + (-3700×R1970) + (1560×R2020) + (3077×R2060) + (-4150×R2070) + (2551×R2110) + (-1810×R2200) + (-2533×R2230) + (2612×R1990) + (-2198×R1950) + (2647×R2250) + (-1089×R2270) + (1237×R2290) + (1255×R2300) + (-722.9×R2350) + (441.4×R2380) + (-587.2×R2390) + (304×R2410) + (157.7×R2460) + (-248×R2470) + (-159.6×R2480) + (143.4×R2490).
For the validation set, the R2 of LRM for prediction of clay content was 0.75, RMSE 8.51 %
and RSE 10.74 % (Figure 3b). This result can be explained by the effects on reflectance spectra caused by variations in size, shape and arrangement of soil particles in the samples of the calibration set. In 199 samples from an experimental area in Poland, Debaene et al. (2014) calculated an R2 of 0.73 in the prediction of clay content, with RMSE of 0.32 %.
The low RMSE value obtained by these authors was due to the homogeneity of soil types and the large size of the experimental area (53.6 ha). For the prediction of clay content of soils in Kenia, Waruru et al. (2014) calculated R2 = 0.5 and RMSE = 16.0 % for the validation
set. These authors claimed that the DRS technique proved little efficient because of the high heterogeneity of the soil samples.
Classification of soil samples
and the Kappa index 0.64. The same trend was observed for PA in the validation set (65.2 % ≤ PA ≤ 84.5 %) with OA = 80.9 % and the Kappa index = 0.67. The calibration and validation sets showed the same performances, where only the PA value of class 1 soils had an inferior performance to those grouped in classes 2 and 3.
The results of the error matrix (Table 1) showed the best performance for the soils of class 3, followed by those of class 2. The performance for soils classified in class 1 was poorer. The reason for this are the constituents of the clay fraction which have characteristic absorption regions of the visible and near infrared electromagnetic spectrum; thus, the higher the clay content, the better the model performance (Sousa Junior et al., 2011). A lower clay and higher sand content reduce the predictive ability of the models (Mouazen et al., 2005). This statement is consistent with the results of this study (Table 1), where most misclassified samples were in class 1.
Figure 3. Fit of the linear regression model to the calibration samples (n = 276) (a) and to the
validation samples (n=136) (b). Significance level α=0.05, root of the mean square error (RMSE, %) and residual standard deviation (RSE, %).
Predicted clay (%
)
Observed clay (%) 100 80 60 40 20 0
0 20 40 60 80 100 0 20 40 60 80 100
R2 = 0.74
RMSE = 7.82 RSE = 9.72 (a)
R2 = 0.75
RMSE = 8.51 RSE = 10.74 (b)
Figure 2. Histograms with curves of normal distribution and descriptive analysis.
0 20 40 60 80 0 20 40 60 80 100 0 20 40 60 80
100 80 60 40 20 0 120 Frequenc y
Clay (%) Sand (%) Silt (%)
n = 412 Clay (%) Minimum Maximum Mean St. Deviation CV Asymmetry Kurtosis 4.50 78.40 30.95 16.32 0.53 0.86 -0.02
n = 412 1.60 88.50 37.38 19.30 0.52 0.12 -0.74 Minimum Maximum Mean St. Deviation CV Asymmetry Kurtosis Sand (%) CV Minimum Maximum Mean St. Deviation Asymmetry Kurtosis
The minimum Kappa index in this study was 0.64 for the calibration set and the maximum value 0.67 for the validation set. The Kappa index is defined as a measure of association to describe and test the degree of agreement, reliability and accuracy of a classification. The Kappa indices in this study (0.64 and 0.67) were classified with a high level of agreement in according to the categorical data of Landis and Koch (1977). Comparing the laboratory particle-size analysis with DRS prediction for the clay content, Kuang et al. (2015) found a Kappa index of 0.48. To predict the soil texture and other properties in a semi-arid area of northern Turkey, Bilgili et al. (2010) used DRS. These authors used the Kappa index as an indicator of similarity between laboratory results and DRS, obtaining a value of 0.68 for the prediction of the textural classes.
Soil samples from various regions of Denmark (variation in clay content 3-74 %) were used by Sorensen and Dalsgaard (2005) to develop a model using DRS. The model showed that the prediction error depends on the range of clay contents, being greater, the more heterogeneous the samples. The main drawback of DRS for the characterization of soil properties is the complexity of soil constituents (Wight et al., 2016). In fact, the heterogeneity of texture and other soil properties from different regions of the state in this study can be considered the main factor that prevented a better performance of soil classification. Organic matter, Fe oxides, clay minerals, as well as particle size distribution and moisture are the constituents that influence the spectral characteristics of the soil (Dalmolin et al., 2005). An alternative would be for future studies to develop models for different sample groups, since the triangle of figure 1b shows the great diversity of soil samples modeled in this study.
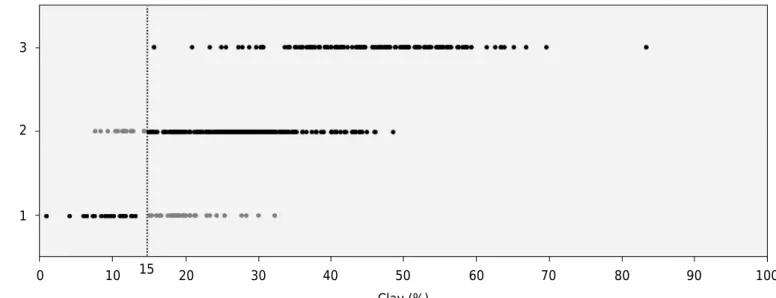
The grouping of the predicted clay contents into three textural classes is shown in figure 4. The dashed line shows the limit in the separation of class 1 from 2. The predicted samples represented in gray were misclassified in classes 1 and 2. The critical limit set at 15 % clay is very close to the limit that separates the majority of soils classified as type 1 and type 2 by the MAPA regulation, which is decisive for the approval of agricultural payments. This directive contains no restrictions for bank financing in areas with soil type 2 or 3. Samples of class 3 and the vast majority of samples of class 2 were correctly classified, similarly to type 2 and 3 classified as proposed by the MAPA regulation.
The results indicate the high potential of DRS in clay prediction and its practical use. With more efficient prediction models, a value of 25 % could be assigned as clay content limit. Soils with values above this threshold would be not have to be analyzed for particle size and grouped in soil types according to MAPA regulations, for being within the defined range for agricultural financing.
Calibration set (n = 276)
Predicted soil class 1 2 3 Total reference PA
%
1 22 13 0 35 62.9
2 10 118 25 153 77.1
3 1 9 78 88 88.6
OA = 79.0 % K = 0.64 276
Validation set (n = 136)
1 15 8 0 23 65.2
2 6 60 5 71 84.5
3 0 7 35 42 83.3
OA = 80.9 % K = 0.67 136
Table 1. Error matrix for the texture classes 1, 2 and 3 and the predicted accuracy values of the
To adopt the DRS method as a screening method in routine laboratory analyses, further research on the preliminary separation of soil samples in different groups or by soil type, source material and, or, sampling region is required, to improve prediction models. The interest in replacing routine laboratory methods is a shorter analysis time, error minimization, a reduction in the use of chemical reagents, and above all, of costs. Thus, studies addressing the practical potential of DRS must continue to make advances in the use of new techniques and sensors in soil science.
CONCLUSIONS
The prediction of linear regression model for clay content reached a value of R2 = 0.75.
The results of the error matrix showed an overall accuracy of 80.9 % in the grouping of soil samples in textural classes.
This study demonstrated the potential of diffuse reflectance spectroscopy to predict clay contents and its application as a screening method for soil tests in routine laboratories.
ACKNOWLEDGEMENTS
The first author would like to thank the Brazilian Coordination for the Improvement of Higher Education Personnel (CAPES) for the scholarship, and the second author to the National Council for Scientific and Technological Development (CNPq) for the scholarship and financial support. The authors are grateful to the Soil Physics Laboratory at UFSM for providing the soil samples.
REFERENCES
Bilgili AV, van Es HM, Akbas F, Durak A, Hively WD. Visible-near infrared reflectance spectroscopy for assessment of soil properties in a semi-arid area of Turkey. J Arid Environ. 2010;74:229-38. doi:10.1016/j.jaridenv.2009.08.011
Brasil. Ministério da Agricultura, Pecuária e Abastecimento. Secretaria de Política Agrícola. Instrução Normativa nº. 2, de 9 de out. de 2008. Diário Oficial da União, n.193, Seção 1, p.5, out. de 2008. [Acessado em: 15 de ago. 2015] Disponível em: http://www.mda.gov.br/sitemda/ sites/sitemda/files/user_arquivos_64/INSTRU%C3%87%C3%83O_NORMATIVA_N%C2%BA_2,_ DE_9_DE_OUTUBRO_DE_2008.pdf.
Figure 4. Grouping of predicted clay content by Vis-NIR spectroscopy into three soil classes. Gray-colored soil samples were erroneously
assigned to classes 1 and 2.
Textural classes
Clay (%) 3
2
1
Congalton RG. A review of assessing the accuracy of classification of remotely sensed data. Remote Sens Environ. 1991;37:35-46.
Dalmolin RSD, Gonçalves CN, Klamt E, Dick DP. Relação entre os constituintes do solo e seu comportamento espectral. Cienc Rural. 2005;35:481-9.
doi:10.1590/S0103-84782005000200042
Debaene G, Niedźwiecki J, Pecio A, Żurek A. Effect of the number of calibration samples on the prediction of several soil properties at the farm-scale. Geoderma. 2014;214/215:114-25. doi:10.1016/j.geoderma.2013.09.022
Demattê JAM, Terra FS. Spectral pedology: a new perspective on evaluation of soils along pedogenetic alterations. Geoderma. 2014;217/218:190-200. doi:10.1016/j.geoderma.2013.11.012
Donagema GK, Campos DVB, Calderano SB, Teixeira WG, Viana JHM. Manual de métodos de análise de solos. 2ª. ed. Rio de Janeiro: Embrapa Solos; 2011.
Klein VA, Madalosso T, Reichert JM, Suzuki LEAS, Veiga M, Albuquerque JA, Pauletto EA. Metodologias de controle de qualidade de análises granulométricas do solo. Cienc Rural. 2013;43:850-3. doi:10.1590/S0103-84782013000500015
Kuang B, Tekin Y, Mouazen AM. Comparison between artificial neural network and partial least squares for on-line visible and near infrared spectroscopy measurement of soil organic carbon, pH and clay content. Soil Till Res. 2015;146:243-52. doi:10.1016/j.still.2014.11.002
Landis JR, Koch GG. The measurement of observer agreement for categorical data. Biometrics. 1977;33:159-74. doi:10.1016/j.foodchem.2015.06.112
Mouazen AM, Karoui R, De Baerdemaeker J, Ramon H. Classification of soil texture classes by using soil visual near infrared spectroscopy and factorial discriminant analysis techniques. J Near Infrared Spec. 2005;13:231-40. doi:10.1255/jnirs.541
R Core Team. R: A language and environment for statistical computing. R Foundation for Statistical Computing. Vienna, Austria: 2014. [Accessed: Apr 15, 2014]. Available at: http://www.R-project.org/.
Ramirez-Lopez L, Schmidt K, Behrens T, Wesemael BV, Demattê JAM, Scholten T. Sampling optimal calibration sets in soil infrared spectroscopy. Geoderma. 2014;226-227:140-50. doi:10.1016/j.geoderma.2014.02.002
Ruiz HA. Incremento da exatidão da análise granulométrica do solo por meio da coleta da suspensão (silte + argila). Rev Bras Cienc Solo. 2005;29:297-300. doi:10.1590/S0100-06832005000200015
Santos HG, Jacomine P KT, Anjos LHC, Oliveira VAVL, Francisco J, Coelho MR, Almeida JA, Cunha TJF, Oliveira JB, coordenadores. Sistema brasileiro de classificação de solos. 3ª. ed. Brasília, DF: Embrapa; 2013.
Sorensen LK, Dalsgaard S. Determination of clay and other soil properties by near infrared spectroscopy. Soil Sci Soc Am J. 2005;69:159-67. doi:10.2136/sssaj2005.0159
Sousa Junior JG, Demattê JAM, Araújo SR. Modelos espectrais terrestres e orbitais na
determinação de teores de atributos dos solos: potencial e custos. Bragantia. 2011;70:610-21. doi:10.1590/S0006-87052011000300017
Suzuki LEAS, Reichert JM, Reinert DJ, Albuquerque JA, Kaiser D. Dispersion and flocculation of Vertisols, Alfisols and Oxisols in Southern Brazil. Geoderma Regional. 2015;5:64-70.
Vasques GM, Grunwald S, Sickman JO. Comparison of multivariate methods for inferential modeling of soil carbon using visible/near-infrared spectra. Geoderma. 2008;146:14-25. doi:10.1016/j.geoderma.2008.04.007
Viscarra Rossel RA, Mcbratney AB, Minasny B. Proximal soil sensing. New York: Springer; 2010.
Waruru BK, Shepherd KD, Ndegwa GM, Kamoni PT, Sila AM. Rapid estimation of soil engineering properties using diffuse reflectance near infrared spectroscopy. Biosyst Eng. 2014;121:177-85. doi:10.1016/j.biosystemseng.2014.03.003