Relationship between soil texture and soil organic matter content on
mined-out lands in Berau, East Kalimantan, Indonesia
WAHJUNI HARTATI1,♥, TRIYONO SUDARMADJI2
1Laboratory of Forest Soil, Universitas Mulawarman. Kampus Gunung Kelua, Samarinda 75119, East Kalimantan, Indonesia. Tel.: +62-541-335379; Fax.: +62-541-335379;
email address: [email protected]
2Laboratory of Soil and Water Conservation, Universitas Mulawarman. Kampus Gunung Kelua, Samarinda 75119, East Kalimantan, Indonesia Manuscript received: 21 December 2015. Revision accepted: 7 May 2016.
Abstract. Hartati, Sudarmadji T. 2016. Relationship between soil texture and soil organic matter content on mined-out lands in Berau, East Kalimantan, Indonesia. Nusantara Bioscience 8: 83-88. Post open pit mining may in most cases leave unarable and degraded lands
due to heavy soil disturbances and therefore reclamation efforts of such area should be addressed on the revitalization of the soil functions for plant growth. The capability of tropical humid soils, including post open pit mining soils, to support plant growth is largely determined by their organic matter content-nutrient pool, soil aggregation, microbial activity, etc. However, soil organic matter content is, to large extent, governed by the soil clay content which is most likely permanent. This may imply that the soil texture couple with soil organic matter content could be a sound measurement to assess the recovery stages of the mined-out lands in term of soil functions for plant growth. This research was conducted in three sites of reclamation area in Berau, East Kalimantan. Soil texture varied from moderately fine (35-40% clay) to fine (40-50% clay) and very fine (>50% clay) for the BMO, SMO and LMO sites respectively. Soil clay eluviations were found in both of SMO (8 years old revegetation) and BMO (>12 years old revegetation) sites but not in LMO site. Soil organic matter content ranged from very low (<1%) to low (1-2%) and gradually increases in line with the increase of soil clay contents. For the soils with 35-50% clay contents (SMO and BMO sites), the top 30 cm depth soil organic matter content is to some extent controlled by the soil clay contents.Clay eluviations might be used as indicators of soil pedogenic were found in moderately fine to fine soil texture. Each process occurs at >12 and 8 years old revegetation when the organic matter content reaching its maximum. The very fine soil texture does not show clay eluviations process until > 12 years old revegetation even containing the highest organic C content and reaches its maximum at 8-10 years old revegetation.
Keywords: mined-out lands, soil texture, soil organic matter, clay content
INTRODUCTION
Post open pit mining may in most cases leave unarable lands due to heavy soil disturbances (Kainthola et al. 2011; Wang et al 2014) and therefore rehabilitation efforts of such area should be addressed on the revitalization of the soil functions for plant growth(Singh et al. 2002; Fan and Wang 2009; Zhang et al. 2015). In the mining activities open systems, soil damage begins with the destruction of the soil structure. As a result, the soil is no longer able to be the ideal medium for plant growth in terms of required air and water circulation. Soil organic matter is one of the most important adhesive in the formation of soil aggregates. The soil organic matter is also a source of some macro- and micro-nutrients of the soil, affecting soil improvement for nutrients adsorption and water as well as improving the biological life of the soil. Therefore, the recovery of mined-out land must be initiated with the revitalization of soil function, especially soil structure followed by other land components such as vegetation cover, microclimate and incoming wild lives (Bronick and Lal 2005; Peng et al. 2004).
Soil organic matter content is to large extent, governed by the soil texture which is most likely permanent. This may imply that couple of clay content and its soil organic matter content could be a sound measurement to assess the stage of the mined-out lands recovery in term of soil
functions for plant growth. The optimum content of soil organic matters that can support plant growth are ideally is about 2%. Another fact is known that the soil texture itself is a unique permanent soil property (Sopher and Baird 1998). Moreover, soil diversity expresses organic matter content and therefore at same time also indicates the potential mined-out lands recovery.
The main objective of this study was to determine the relationship between soil texture in term of clay content and soil organic C content in mined-out lands to assess the mined-out lands recovery stages of in term of soil functions for plant growth.
MATERIALS AND METHODS
Study area
N U S A N T A R A B I O S C I E N C E 8 (1): 83-88, May 2016
84
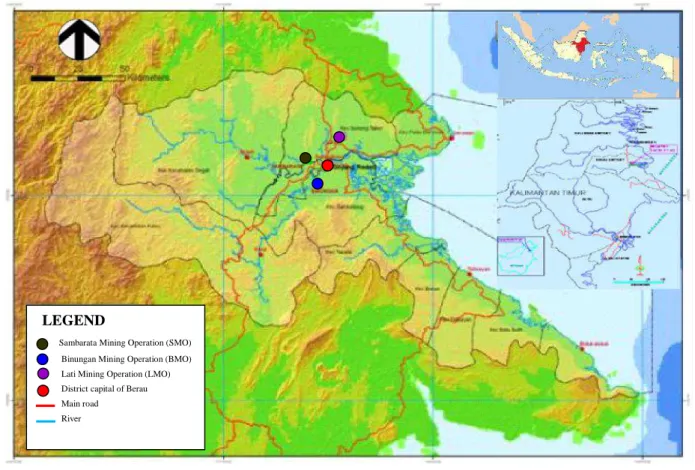
Figure 1. The study area at coal mining concession of PT Berau Coal, Berau, East Kalimantan, Indonesia
The climate of the region is classified as A type (SMO
and LMO) and B type (BMO) referred Schmidt-Ferguson’s
classification system or Af in Koppen’s classification system (Sudarmadji 2013). The geology of the areas is characterized by sedimentary rocks of tertiary and quarterly sediment, sandstone, aquiclude consisting of clay layers, clay stone, shale and siltstone. Geomorphologically, the coal concession of PT Berau Coal as synclin area belongs to lowland, river land until rugged hills characterized by steep slope in the river land and undulating to moderately steep in the rugged hills. Physiographically, the lowland consist of flood plain and back swamp.
Soils used and analytical method
This research was conducted at three sites of mined-out lands after revegetation works of PT Berau Coal East Kalimantan. Four hundred and thirty two (432) disturbed soil samples were collected from MoL by considering MoL revegetation of <2, 2-4, 4-6, 6-8, 8-10, 10-12, >12 years old and OL, each 18 soil samples at three sites.
In each site, a series of different revegetation ages were taken to clarify the influence of revegetation on soil organic matter content. Simultaneously, the soils were selected to represent a possible wide range of soil texture for examining the influence of soil texture upon soil organic matter contents.
Mechanical composition was determined by the standard sedimentation method using natrium pyrophosphate as
dispersing agent after H2O2treatment. For this purpose, the international system of particle size limits was adopted. Organic C content was determined by modified Walkley-Black dichromate method (Walkley and Walkley-Black 1934).
RESULTS AND DISCUSSION
Soil texture variation at MoL
Soil texture is the relative ratio between percentage of sand, silt, and clay in a soil mass. Generally, soil textures are classified into 12 classes but then simplified into 5 types, i.e. very fine, fine, moderate, coarse and very coarse (Hardjowigeno 2003). Based on these, soils of MoL were studied by dividing into four different texture types; very fine, fine, moderate and coarse. Furthermore, soils of OL were divided into two different texture types; very fine and fine. Compared with the OL, soil texture of MoL was found to be more various (Table 1).
Soil textures of MoL was more coarse than the OL at the top 30 cm depth because of the amount of clay content were accidentally lost due to land clearing activities and/or during transportation from mining pit to the top of soils stockpiles.
Distribution of soil mineral particles of MoL
In general, soil mineral particles classified into different soil particle sizes, because of its different properties. LEGEND
Sambarata Mining Operation (SMO)
Binungan Mining Operation (BMO) Lati Mining Operation (LMO) District capital of Berau
surface area of the particles in a soil is quite important in determining the soil water holding capacity. This is due to much of water in soil is held as films on surfaces of the individual soil particles. Finer-textured soils will have larger amount of surface area and will hold larger amounts of water (Sopher and Baird 1998).
The highest average of sand content is found at BMO followed by SMO and the smallest is LMO. Furthermore, sand content sharply increases in the MoL than OL of LMO (Table 2).The highest silt content of MoL is found at SMO followed by LMO and the lowest is at BMO. In general, the more clayey soil, the higher silt content throughout the soil profile (Ohta et al. 1992). However, in the MoL the relationship could not be judged clearly. Silt content in the MoL of LMO is lower than in OL and reverse in LMO. Silt content at BMO is similar between MoL and OL. In the MoL, silt content decreased following the deeper of soil profile.
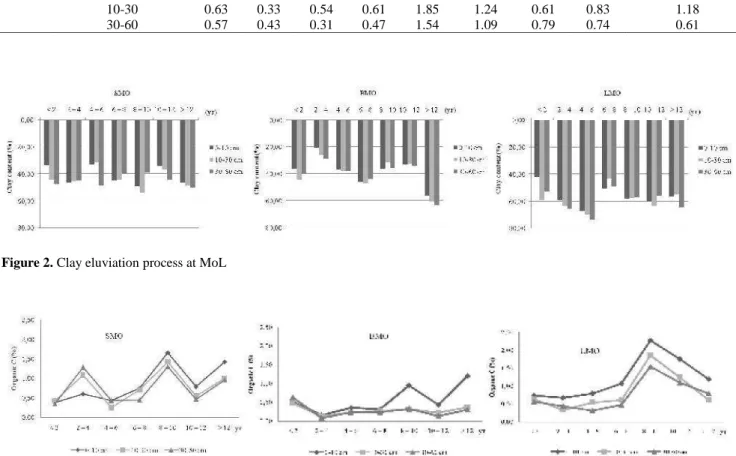
The highest clay content on MoL is at LMO followed by SMO and the lowest is at BMO. Based on clay content, soil texture at study areas are classified into moderately fine (35-40% clay) to fine (40-50% clay) and very fine (>50% clay) for BMO, SMO and LMO sites, respectively. Clay particle in the soil has specific properties that are different from other soil mineral particles. Small size particle allows a greater soil water holding capacity. Specifically, in the form of colloidal soil particles will be negatively charged so that it can adsorb nutrients which are generally in the form of cations (Sopher and Baird 1998). Similarly, in observing the process of pedogenic differences of clay contents between topsoil and subsoil can be used as an indicator of the improvement of soil structure and/or the initial pedogenic process. Soil clay eluviations were found in both of SMO (8 years old) and BMO (>12 years old) revegetation but not at LMO (Figure 2). The improved soil structure tends to be responsible element for the larger clay translocation vertically or clay eluviation in the upper sola of the moderately fine soil (SMO).
Potential content of soil organic matter in MoL
Soil organic matter is expressed by the content of soil organic C. Soil organic C contents itself ranged from very low (<1%) to low (1-2%) in the MoL and this situation is not much different from its OL. Table 3 shows that increasing age of the plant revegetation in MoL is not always followed by an increase in organic C content.
The ranging of fine (SMO) up to very fine (LMO) of soil textures of MoL showed the similar pattern, ie at each layer of soil examined levels of organic C content reaches a maximum when the plant revegetation 8-10 years old. The very fine soil texture decreased organic C content >10 years old revegetation, reverse by the fine soil texture. Furthermore, in the moderately fine soil texture (BMO) organic C content reaches a maximum magnitude when the plant revegetation >12 years old (Figure 3).
Most plant species used for mined-out land revegetation is Paraserianthes falcataria (L) Nielsen which is a kind of fast growing species. The growth of P falcataria follows a
able to accumulate energy for rapid terminal growth, but as the size and foliage of the tree increases, more energy becomes available for the terminal shoot to grow. This increase in energy accumulation potential results in accelerated height growth (1-5 years) that continues until the tree reaches its highest growth rate (6 years). After this peak (6-8 years), the growth rate slows down as the stress created by extreme height, exposure or crown size limit the expansion of the terminal growth (Oliver and Larson 1996; Riyanto and Pamungkas 2010).
In both of MoL and OL, the highest organic C content was found at LMO followed by SMO and the lowest at BMO. Finer-textured soils would enrich the surface with nutrients (Drees 1993). Vertically, organic C content decreased with increasing its soil depth. This fact shows that the accumulation of soil organic matter is largely originated from the vegetation litter fall.Each site shows a different time in the accumulation of organic matter, ie SMO was 4-6 years old, 2-4 years old vegetation at BMO and < 2 years old vegetation at SMO.
Table 1. Variation of soil texture in the MoL and OL
Soil type Site
Soil depth
(cm)
Land
type Very
fine Fine
Mode-rate Coarse
SMO 0-10 MoL c cl, scl sil
-OL sc scl -
-10-30 MoL c, sc cl, sicl sil
-OL sc - -
-30-60 MoL c, sc cl, scl sil
OL c cl -
-BMO 0-10 MoL c, sc cl, scl l ls
OL c, sc cl -
-10-30 MoL c, sc cl, scl -
-OL c, sc cl -
-30-60 MoL c, sc scl sil
-OL c, sc - -
-LMO 0-10 MoL c, sic cl, sicl -
-OL - cl l
-10-30 MoL c, sic cl -
-OL - cl -
-30-60 MoL c, sic sicl -
-OL c cl -
-Note: c: clay, cl: clay loam, scl: sandy clay loam, sil: silty loam, sc: sandy clay, l: loam, ls: loamy sand
Table 2. Distribution of soil particles on MoL and OL
Sand (%) Silt (%) Clay (%)
Site Soil depth
(cm)
MoL OL MoL OL MoL OL
SMO 0-10 31.76 48.69 27.16 15.35 41.07 35.96
10-30 30.82 48.60 25.66 10.52 43.51 40.89 30-60 33.86 41.65 21.11 16.47 45.03 41.88
BMO 0-10 47.50 45.14 14.60 15.65 37.91 39.21
10-30 46.81 45.88 13.17 13.40 40.02 40.71 30-60 47.59 44.15 11.92 9.59 40.48 46.27
LMO 0-10 19.61 39.59 24.00 33.45 56.38 26.96
N U S A N T A R A B I O S C I E N C E 8 (1): 83-88, May 2016
86
Table 3. C organic soil content (%) in MoL and OL
Revegetation age of MoL (yr)
Site Soil depth (cm)
<2 2-4 4-6 6-8 8-10 10-12 >12 Avg. Original land
SMO 0-10 0.38 0.60 0.43 0.75 1.66 0.79 1.43 0.86 1.65
10-30 0.42 1.09 0.25 0.71 1.43 0.55 1.00 0.78 0.98
30-60 0.34 1.29 0.43 0.44 1.30 0.46 0.96 0.74 0.56
BMO 0-10 0.51 0.15 0.36 0.31 0.95 0.43 1.19 0.56 1.57
10-30 0.47 0.13 0.21 0.27 0.31 0.22 0.37 0.28 0.61
30-60 0.63 0.07 0.24 0.24 0.32 0.13 0.30 0.28 0.43
LMO 0-10 0.74 0.67 0.78 1.06 2.27 1.75 1.19 1.21 1.50
10-30 0.63 0.33 0.54 0.61 1.85 1.24 0.61 0.83 1.18
30-60 0.57 0.43 0.31 0.47 1.54 1.09 0.79 0.74 0.61
Figure 2. Clay eluviation process at MoL
Figure 3. The dynamics of soil organic C content by increase of revegetation age
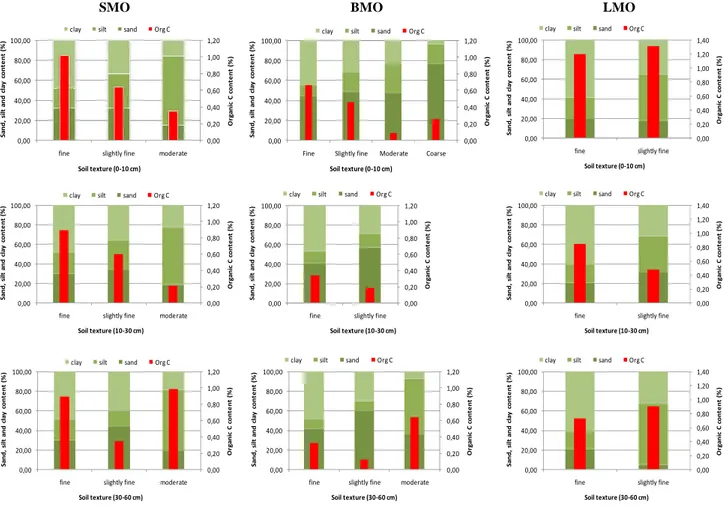
Relationship of soil texture and soil organic C content Soil organic matter content gradually increases in line with the clay content increase of the moderately fine to fine soils (BMO and SMO) on the top of 30 cm depth of MoL (Kumar et al. 2013; Fontaine et al. 2007; Rumpel and Kögel-Knabner 2010). Conversely the relationship is unclear for the > 30 cm soil depth. It is believed that it would be related to the source of organic matter that accumulates on the top layer of soil (Sanchez 1976; Ohta et al. 1992). The obtained results showed no clear consistent regularities of the soil organic C content on very fine soil (LMO). In the OL this tendency was the most obvious figure for the top 10 cm depth and unclear in the deeper layers (Figure 4).
Based on the average of clay content (> 40%) in MoL, the clay contents of diverse shows the control of different organic matter content. Correlation analysis between the clay content and the organic C content in MoL is shown in Figure 5. The organic C content in BMO and SMO
primarily for the top 30 cm depth was correlated with clay content (r = 0.51 and r = 0.43). It means that for the soils with 35-50% clay contents (SMO and BMO), the top 30 cm depth soil organic matter content is to some extent controlled by the soil clay contents. For this reason, the application of soil amendment is required to increase soil organic matter content and eventually enhancing soil function recovery. For the soils at LMO with >50% clay contents is not closely related (r = 0.10) between the two parameters.
Figure 4. The dynamics of organic matter content at the various levels of fineness soil texture
SMO BMO LMO
Depth
(cm) Equation R
2
Equation R2 Equation R2
0-10 Y = 0.023x-0.103 0.186 Y = 0.016x-0.074 0.261 Y = 0.007x + 1.634 0.011
10-30 Y = 0.019x-0.059 0.157 Y = 0.006x+ 0.025 0.274 Y = 0.006x + 1.227 0.011
30-60 Y = 0.014x + 0.1 0.040 Y = 0.002x + 0.158 0.041 Y = 0.005x + 1.052 0.007
Figure 5. A relationship between clay content (%) and soil organic C content (%) at MoL
influences several soil physical processes, such as water infiltrationand soil erosion (Amézketa 1999; Le Bissonnais et al. 2007). Specifically, aggregate stability determines the movement and storage of water in soils, soil aeration, soil erosion, biological activity, and crop growth (Zhang and Miller 1996). The very fine soil texture doest not show clay eluviation process until >12 years old revegetation even
though having the highest organic C content and had reached its maximum content level at 8-10 years old revegetation.
In general, pedogenic process as of soil clay eluviations in MoL were found in both of SMO (8 years old vegetation) and BMO (>12 years old vegetation) sites with 35-50% clay but not in LMO site with >50% clay when
0,00 0,20 0,40 0,60 0,80 1,00 1,20 0,00 20,00 40,00 60,00 80,00 100,00
fine slightly fine moderate
O rg a ni c C c o nt e nt ( % ) S a nd, s il t a nd cl a y c o nt e nt ( % )
Soil texture (0-10 cm) clay silt sand Org C
0,00 0,20 0,40 0,60 0,80 1,00 1,20 0,00 20,00 40,00 60,00 80,00 100,00
fine slightly fine moderate
O rg a n ic C c o n te n t (% ) S a n d , si lt a n d c la y c o n te n t (% )
Soil texture (10-30 cm) clay silt sand Org C
0,00 0,20 0,40 0,60 0,80 1,00 1,20 0,00 20,00 40,00 60,00 80,00 100,00
fine slightly fine moderate
O rg a n ic C c o n te n t (% ) S a n d , si lt a n d c la y c o n te n t (% )
Soil texture (30-60 cm) clay silt sand Org C
0,00 0,20 0,40 0,60 0,80 1,00 1,20 0,00 20,00 40,00 60,00 80,00 100,00
Fine Slightly fine Moderate Coarse
O rg a n ic C c o n te n t (% ) S a n d , si lt a n d c la y c o n te n t (% )
Soil texture (0-10 cm) clay silt sand Org C
0,00 0,20 0,40 0,60 0,80 1,00 1,20 0,00 20,00 40,00 60,00 80,00 100,00
fine slightly fine
O rg a n ic C c o n te n t (% ) S a n d , si lt a n d c la y c o n te n t (% )
Soil texture (10-30 cm) clay silt sand Org C
0,00 0,20 0,40 0,60 0,80 1,00 1,20 0,00 20,00 40,00 60,00 80,00 100,00
fine slightly fine moderate
O rg a n ic C c o n te n t (% ) S a n d , si lt a n d c la y c o n te n t (% )
Soil texture (30-60 cm) clay silt sand Org C
0,00 0,20 0,40 0,60 0,80 1,00 1,20 1,40 0,00 20,00 40,00 60,00 80,00 100,00
fine slightly fine
O rg a n ic C c o n te n t (% ) S a n d , si lt a n d c la y c o n te n t (% )
Soil texture (0-10 cm) clay silt sand Org C
0,00 0,20 0,40 0,60 0,80 1,00 1,20 1,40 0,00 20,00 40,00 60,00 80,00 100,00
fine slightly fine
O rg a n ic C c o n te n t (% ) S a n d , si lt a n d c la y c o n te n t (% )
Soil texture (10-30 cm) clay silt sand Org C
0,00 0,20 0,40 0,60 0,80 1,00 1,20 1,40 0,00 20,00 40,00 60,00 80,00 100,00
fine slightly fine
O rg a n ic C c o n te n t (% ) S a n d , si lt a n d c la y c o n te n t (% )
N U S A N T A R A B I O S C I E N C E 8 (1): 83-88, May 2016
88
organic matter content reaches its maximum. Soil organic matter content in MoL ranged from very low (<1%) to low (1-2%) and the content gradually increase in line with the increase of clay content of the soils. Maximum content of C-organic was found at the 8-10 years old vegetation site. In the MoL for the soils with 35-50% clay contents (SMO and BMO sites), the top 30 cm depth soil organic matter content is to some extent controlled by soil clay contents, and therefore the application of soil amendment is required to increase soil organic matter content and eventually enhancing soil function recovery.
ACKNOWLEDGEMENTS
Sincere thanks are expressed to PT Berau Coal, East Kalimantan, Indonesia for facilitating this research. Special thanks are due to all peoples who kindly help carrying out fieldworks and the laboratory analysis. The authors would also like to acknowledge Professor Kukuh Murtilaksono from Bogor Agriculture University Indonesia and other reviewers for critical review of the manuscript.
REFERENCES
Amézketa E. 1999. Soil aggregate stability: a review. J Sustain Agric 14 (2-3): 83-151.
Bronick CJ, Lal R. 2005. Soil structure and management: a review. Geoderma 124: 3-22.
Drees LR. 1993. Characteristics of aeolian dusts in Niger, West Africa. Geoderma 59: 213-233.
Fan JF, Wang XL. 2009. Application of waste mushroom on land reclamation in the refuse dump of Haizhou Open-pit Mines. J Coal Sci Eng 15 (1): 72-75.
Fontaine S, Barot S, Barre P, Bdioui N, Mary B, Rumpel C. 2007. Stability of organic carbon in deep soil layers controlled by fresh carbon supply. Nature 450: 277-281.
Hardjowigeno S. 1987. Soil Science. Revised ed. PT. Mediyatama Sarana Perkasa, Jakarta. [Indonesian]
Hartati W. 2013. The dynamic of soil fertility on coal mined out land PT Berau Coal, Berau, East Kalimantan. Proc. Silviculture, Makassar South Sulawesi.
Kainthola A, Verma D, Gupte SS, Singh TN. 2011. A coal mine dump stability analysis = a case study. Geomaterials 1: 1-13
Kumar P, Sharma LK, Pandey PC, Sinha S, Nathawat MS. 2013. Geospatial strategy for tropical forest-wildlife reserve biomass estimation. IEEE J Sel Top Appl Earth Obs Remote Sens 6: 917-923. Le Bissonnais Y, Blavet D, De Noni G, Laurent J.Y, Asseline J, Chenu C.
2007. Erodibility of Mediterranean vineyard soils: relevant aggregate stability methods and significant soil variables. European Journal of Soil Science 58: 188-195.
Ohta S, Effendi S, Tanaka N, Miura S. 1992. Characteristic of major soils under lowland dipterocarp forest in East Kalimantan, Indonesia. PUSREHUT Special Publication No. 2. Tropical Rain Forest Research Project JTA-9(a)-137. JICA and Directorate General of Higher Education Ministry of Education and Culture Republic of Indonesia.
Oliver, C.D. and Larson, B.C. 1996. Forest Stand Dynamics. John Wiley & Sons, Inc.p.520.
Peng XH, Horn R, Zhang B, Zhao QG. 2004. Mechanisms of soil vulnerability to compaction of homogenized and recompacted Ultisols. Soil Till Res 76 (2): 125-137.
Riyanto HD, Pamungkas BP. 2010. Growth model of Sengon stand plantation for forest management. Tekno Hutan Tanaman J 3: 113 -120
Rumpel C, Kögel-Knabner I. 2010. Deep soil organic matter—a key but poorly understood component of terrestrial C cycle. Plant Soil 338: 143-158. http://dx.doi.org/10.1007/s11104-010-0391-5.
Sanchez PA. 1976. Properties and management of soils in the tropics. John Willey and Sons, New York.
Shan SA Darboux F, Cheng M. 2013. Revegetation as an efficient means of increasing soil aggregate stability on the loess plateau (China). Geoderma J 2009-2010 (2013): 75-85
Singh AN, Raghubanshi AS, Singh JS. 2002. Plantations as a tool for mine spoil restoration. Curr Sci 82: 1436-1441.
Sopher CD, Baird JV. 1978. Soils and management A Prentice Hall Company, Reston.
Sudarmadji T, Hartati W, Syafrudin M. 2013. Monitoring the dynamic of microclimate, soil fertility and erosion potensial on mined out land revegetation in PT Berau Coal. PT Berau Coal and Faculty of Forestry Mulawarman University, Samarinda, Indonesia.
Walkey A, Black IA. 1934. An examination of DEGTJAREFF method for determining soil organic matter and a proposed modification of the chromic acid titration method. Soil Sci 37: 29-37.
Wang JM, Jiao ZZ, Bai ZK. 2014. Changes in carbon sink value based on RS and GIS in Heidaegou opencast coal mine. Environ Earth Sci 71: 863-871.
Zhang XC, Miller WP. 1996. Physical and chemical crusting processes affecting runoff and erosion in furrows. Soil Sci Soc Amer J 60: 860-865.