Pesq. agropec. bras., Brasília, v.48, n.11, p.1489-1497, nov. 2013 DOI: 10.1590/S0100-204X2013001100010 José Maria Barbat Parfitt(1), Luís Carlos Timm(2), Klaus Reichardt(3), Luiz Fernando Spinelli Pinto(4),
Eloy Antonio Pauletto(4) and Danilo Dufech Castilhos(4)
(1)Embrapa Clima Temperado, BR 392, Km 78, CEP 96001‑970 Pelotas, RS, Brazil. E‑mail: [email protected] (2)Universidade Federal de Pelotas, Departamento de Engenharia Rural, Campus Universitário, s/no, Caixa Postal 354, CEP 96010‑900 Pelotas, RS, Brazil. E‑mail: [email protected] (3)Universidade de São Paulo, Centro de Energia Nuclear na Agricultura, Laboratório de Física do Solo, Caixa Postal 96, CEP 13418‑900 Piracicaba, SP, Brazil. E‑mail: [email protected] (4)Universidade Federal de Pelotas, Departamento de Ciência do Solo, Campus Universitário, s/no, Caixa Postal 354, CEP 96010‑900 Pelotas, RS, Brazil. E‑mail: [email protected], [email protected], [email protected]
Abstract – The objective of this work was to evaluate the relationship between soil chemical and biological attributes and the magnitude of cuts and fills after the land leveling process of a lowland soil. Soil samples were collected from the 0–0.20 m layer, before and after leveling, on a 100 point grid established in the experimental area, to evaluate chemical attributes and soil microbial biomass carbon (MBC). Leveling operations altered the magnitude of soil chemical and biological attributes. Values of Ca, Mg, S, cation exchange capacity, Mn, P, Zn, and soil organic matter (SOM) decreased in the soil profile, whereas Al, K, and MBC increased after leveling. Land leveling decreased in 20% SOM average content in the 0–0.20 m layer. The great majority of the chemical attributes did not show relations between their values and the magnitude of cuts and fills. The relation was quadratic for SOM, P, and total N, and was linear for K, showing a positive slope and indicating increase in the magnitude of these attributes in cut areas and stability in fill areas. The relationships between these chemical attributes and the magnitude of cuts and fills indicate that the land leveling map may be a useful tool for degraded soil recuperation through amendments and organic fertilizers.
Index terms: flooded rice, soil biological attributes, soil chemical attributes, soil management, soil movement.
Atributos químicos e biológicos de um solo de várzea afetados pela
sistematização do terreno
Resumo – O objetivo deste trabalho foi avaliar a relação entre os atributos químicos e biológicos do solo e as magnitudes de cortes e aterros após sistematização de um solo de várzea. Foram coletadas amostras de solo na camada de 0–0,20 m, antes e depois da sistematização, em uma malha de 100 pontos estabelecida na área experimental, para avaliar os atributos químicos do solo e o carbono da biomassa microbiana (CBM). A sistematização alterou a magnitude dos atributos químicos e biológicos do solo. Valores de Ca, Mg, S, capacidade de troca catiônica, Mn, P, Zn e matéria orgânica do solo (MOS) diminuíram no perfil do solo, enquanto os de Al, K e CBM aumentaram após a sistematização. A sistematização reduziu em 20% o conteúdo médio de MOS na camada de 0–0,20 m. A maior parte dos atributos químicos não apresentou relação com as magnitudes de corte e aterro. A relação foi quadrática para MOS, P e N total, e linear para K, mostrando inclinação positiva e aumento das magnitudes destes atributos em áreas de corte e estabilidade em áreas de aterro. As relações entre estes atributos químicos e as magnitudes de cortes e aterro indicam que o mapa de sistematização pode ser uma ferramenta útil para a recuperação de solos degradados por meio da aplicação de corretivos e fertilizantes orgânicos.
Termos para indexação: arroz irrigado, atributos biológicos do solo, atributos químicos do solo, manejo do solo, movimento do solo.
Introduction
Land leveling is used to flatten the soil surface to facilitate the distribution of irrigation and also to improve land conditions for several agricultural practices that are best performed on leveled soil.
lowland area of this state (Pinto et al., 2004). However, not all lowland areas are potentially leveled because some of them show irregular microtopography despite being classified as flat areas.
Due to cuts made at higher elevations, leveling can cause a significant decrease in the A horizon thickness with possible exposure of subsoil layers. Examining the effects of land leveling on the yield of vineyards in the Penedès region, Northeastern Spain, Ramos & Martínez‑Casasnovas (2010) found positive differences in yield of 28% between leveled and non‑leveled areas under similar management practices. Still in the Penedès region, Martínez‑Casasnovas & Ramos (2009) also analyzed the changes in soil properties caused by erosion, deep ploughing, and land leveling. They concluded that land leveling and the resultant increase in erosion altered soil properties and could contribute to global warming by depleting the soil of organic matter. In Arkansas, USA, Brye (2006) characterized land leveling impacts on the magnitude, variance, and spatial distributions of chemical soil properties of a Sharkey clay soil (very fine, smectitic, thermic Chromic Epiaquert) used for irrigated rice (Oryza sativa L.) and soybean [Glycine max (L.) Merr.] crops. The author found that land leveling affected the magnitude of all evaluated properties. Soil pH, electrical conductivity, extractable potassium, calcium, magnesium, sodium, sulfur, iron, and copper increased in the 0–0.10 m layer, whereas soil organic matter (OM) content, soil total nitrogen (TN) concentration, C/N ratio, extractable phosphorus, and manganese contents decreased after leveling. Brye (2006) also reported that the variance associated with soil pH and Mehlich‑3 extractable P, K, Na, S, Mn, Cu, and Zn contents decreased with land leveling, which also changed the spatial distribution of all chemical properties. Reichert et al. (2008), in a study carried out in Brazil, verified that land leveling increased the spatial variability of soil chemical attributes of a Planossolo Hidromórfico Distrófico típico (Typic Albaqualf), which was reflected in the productivity of a soybean crop. However, the authors did not point out which of the attributes were the most affected by the leveling practice.
Other studies have been carried out to evaluate leveling effects on the magnitude and spatial distribution of soil attributes (Brye et al., 2004; Ramos & Martínez‑Casasnovas, 2006). Many benefits are associated with the land leveling practice (Ramos et al., 2007); however, studies have also pointed to some disadvantages due to severe soil disturbance, indicating
that there is some controversy regarding the positive and negative effects of leveling (Walker et al., 2003; Brye et al., 2005; Cay & Cattle, 2005). Therefore, new studies are necessary to investigate the subject, establishing parameters that may help farmers when planning land leveling, in the sense of foreseeing changes that will occur in the area. Published reports do not associate changes in soil characteristics on cut areas, because the soil from these areas will cover the fill areas and those will be exposed at the surface after the leveling operation. No association has been made between the changes in soil attributes and the magnitude of cuts and fills in order to evaluate which soil attributes are most affected by the leveling process.
The objective of this work was to evaluate the relationship between soil chemical and biological attributes and the magnitude of cuts and fills after the land leveling process of a lowland soil.
Materials and Methods
The study was carried out on a 0.81 ha area of the municipality of Capão do Leão, state of Rio Grande do Sul, Brazil (31º49'13"S, 52º27'59"W), using a grid of 100 georeferenced points spaced 10 m apart in orthogonal directions for sampling. The climate in the region is of the Cfa type, according to Köppen classification (Köppen, 1931), and the specific area is representative of a subtropical marine environment with a sub‑humid summer and humid or super‑humid remaining seasons.
Pesq. agropec. bras., Brasília, v.48, n.11, p.1489‑1497, nov. 2013 DOI: 10.1590/S0100‑204X2013001100010
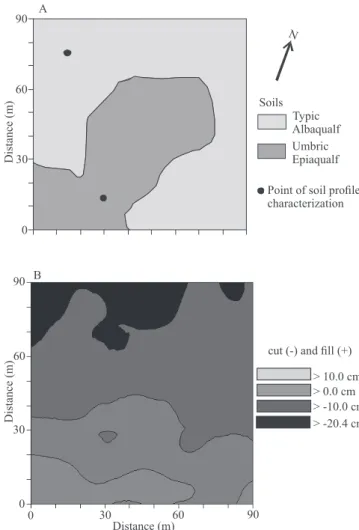
The two soils do not present a sharp interface within the area. This situation is common in the rice growing lowland areas of the state of Rio Grande do Sul, Brazil. Before the start of the experiment, the area was cultivated twice with flood irrigated rice and lastly with grain sorghum, all under conventional tillage, which included plowing operations to the depth of about 0.20 m. First, grid samples were collected after sorghum harvest, prior to land leveling, which occurred at the beginning of 2008 and was carried out with a laser ray controlled scraper, using a plano‑altimetric survey and minimum squares approximation as described in Parfitt et al. (2004). The maximum cut was 0.21 m and the maximum fill was 0.17 m (Figure 1 B). The final average
slope was 0.15 m 100 m‑1 or 0.15%. The approximate soil displacement was 519 m3 ha‑1, with about half of the area being cut and the other half being filled.
The land leveling operation (Figure 1 B) consisted of cuts predominantly on the Typic Albaqualf and fills predominantly on the Umbric Epiaqualf. In other words, after leveling most of the collected soil samples from the 0–0.20 m layer were from the Albaqualf, including some material of the original E and B horizons (cut areas) and some of the A horizon (fill areas), since this soil was placed on top of the Epiaqualf (Figures 1 A and B). The characterization of the soil chemical attributes of the Typic Albaqualf soil profile before leveling is presented in Table 1.
The period between samplings before and after land leveling was three months. At each of the 100 georeferenced points, the mean values of clay, silt, and sand contents were determined according to Gee & Bauder (1986) before and after leveling: 144 and 154 g kg‑1 clay; 398 and 375 g kg‑1 silt; and 458 and 471 g kg‑1 sand, respectively, referring in both cases to a loam texture.
The following soil chemical attributes were evaluated according to the methodologies described in Tedesco et al. (1995): pH in water; the Shoemaker‑MacLean‑Pratt (SMP) index; potential acidity (H + Al) extracted with 0.5 mol L‑1 calcium acetate solution; total soil N (TN) by the Kjeldahl method; available P, and exchangeable Na and K extracted with HCl 0.05 mol L‑1 + H2SO4 0.0125 mol L‑1 solution (Mehlich‑1); exchangeable Ca, Mg, and Al, and available Mn extracted with KCl 1 mol L‑1 solution; available S extracted with monocalcium phosphate [Ca(H2PO4)2] solution (500 mg L‑1 P); available B extracted with hot water (55±3oC); oxalate‑extractable Fe (ammonium oxalate 0.2 mol L‑1, pH 3.0); available Cu and Zn extracted with HCl 0.1 mol L‑1 solution; sum of bases (S) calculated by the sum of exchangeable Ca + Mg + K + Na; and cation exchange capacity (CEC at pH 7.0) calculated by the sum of S + H + Al. Soil organic matter content (SOM) was calculated from soil organic carbon, which was determined by the Walkley‑Black method (Claessen, 1997).
For the determination of the soil microbial biomass carbon (MBC), samples were collected with a screw auger in the same layer. The extracted soil was stored in a freezer until analysis. The MBC was determined according to the methodology described by Vance et al.
Figure 1. Spatial distribution of the soil in the experimental
(1987), in which chloroform is replaced by a microwave oven (for 4 min) to eliminate microorganisms and release cell components, as recommended by Ferreira et al. (1999).
All data were subjected to descriptive statistical analysis and analyzed to confirm normality through the non‑parametric Kolmogorov‑Smirnov test, at 5% probability, using the maximum distance D according to Webster & Oliver (2007). To determine the overall effect of land leveling on all data sets, paired t tests were performed. For normal data distributions, the hypothesis of the applied test was parametric (t statistics) and for non‑normal distributions, the test was non‑parametric (Wilcoxon test) as in Ferreira (2005). To evaluate the effect of land leveling on the sampling variability of each attribute, the homogeneity of variance test (Ferreira, 2005) was applied using the methodology of Levene (1960) modified by Brown & Forsythe (1974). The analyses of linear regression were made using SAS, version 8.2 (SAS Institute, Cary, NC, USA).
Results and Discussion
According to Manual de adubação e de calagem para os Estados do Rio Grande do Sul e Santa Catarina (2004), the range and average values of all soil chemical attribute data before leveling are classified as follows: low to very low pH in water (Table 2); the range of SMP index values indicate lime amounts of 1.1 and 5.4 t ha‑1 (100% PRNT) for soybean as an example; low average value of SOM (21.0 g kg‑1) in the 0–0.20 m layer, which is important because it indicates nitrogen availability in the soil; CEC average value
of 9.7 cmolc dm‑3 within the middle range, classifying the range of exchangeable K contents (between 17 and 92 mg dm‑3) from very low to medium, respectively; minimum and maximum values of 4.5 to 26.1 mg dm‑3, respectively, for available P contents interpreted from medium to very high for irrigated rice crop; exchangeable Ca contents of 1.6 to 4.5 mg dm‑3 from low to high; exchangeable Mg contents of 0.8 to 2.5 cmolc dm‑3 and available S contents ranging from 8.7 to 35.2 mg dm‑3, which are considered high values.
The average values of Mn, B, Cu, and Zn are considered high, whereas the average value of Fe (1,379 mg dm‑3) is within the low crystallinity range (995 to 1,737 mg dm‑3), which is considered adequate. The average value of MBC was 297 mg kg‑1 and is similar to that determined by Santos et al. (2004) in a crop rotation system experiment carried out with the same soil type.
The intense soil disturbance and transport during the leveling operation altered the majority of the soil chemical and biological attributes (Table 2). Only the mean values of pH (H2O), B, and Na were not altered by the leveling operation in the paired comparison test, at 5% probability. The intense soil disturbance and transport during the leveling operation decreased significantly the average values of H+Al, SOM, TN, P, Ca, Mg, CEC, S, Fe, Mn, and Zn. Therefore, land leveling negatively affected soil fertility in the top 0.20 m layer, which can cause potentially negative effects on future crop productivity. Similar results were reported by Brye (2006) in a soil classified as Sharkey clay used for irrigated soybean and rice production in the Mississippi Delta region of northeast Arkansas, USA, where the contents of SOM, TN, P, and Mn
Table 1. Soil chemical attributes of the Planossolo Háplico Eutrófico gleissólico (Typic Albaqualf) soil profile in the
experimental area before leveling(1).
Soil Soil depth pH Ca Mg S Al H+Al CEC K Na Mn P SOM
horizon (H2O) ‑‑‑‑‑‑‑‑‑‑‑‑‑‑‑‑‑‑‑‑‑‑‑‑(cmolc kg‑1)‑‑‑‑‑‑‑‑‑‑‑‑‑‑‑‑‑‑‑‑‑‑‑‑‑‑‑‑ ‑‑‑‑‑‑‑‑‑‑‑‑‑‑‑(mg kg‑1)‑‑‑‑‑‑‑‑‑‑‑‑‑‑‑ (g kg‑1)
A 0–20/33 4.9 2.9 1.5 4.7 0.7 4.0 8.7 55 27 19.1 15.0 21.0
AE 20/33–30/40 4.6 1.2 1.0 2.4 1.5 3.4 5.8 16 41 4.8 2.4 6.1
E 30/40–60/75 4.8 1.5 1.4 3.2 1.3 3.0 6.2 16 61 1.2 0.9 2.9
BE/E 60/75–70/90 4.8 3.6 3.5 7.7 2.1 4.3 12.1 35 130 1.8 1.4 5.0
B1 70/90–103/118 4.9 4.7 4.8 10.3 1.7 4.0 14.2 47 151 1.2 1.4 3.8
B2 103/118–120/140 5.1 4.8 4.8 10.4 1.1 3.1 13.5 51 153 3.3 1.2 2.1
BC 20/140–160/170 5.3 4.8 4.8 10.4 0.7 2.7 13.1 47 141 3.6 1.5 1.6
C 160/170 cm+ 5.4 5.2 5.0 10.9 0.6 2.1 13.0 47 138 7.3 1.9 0.5
(1)Ca, exchangeable calcium; Mg, exchangeable magnesium; S, available sulfur; Al, exchangeable aluminum; H+Al, potential acidity; CEC, cation exchange
Pesq. agropec. bras., Brasília, v.48, n.11, p.1489‑1497, nov. 2013 DOI: 10.1590/S0100‑204X2013001100010
decreased and the contents of K and Cu increased as a result of the leveling operation. However, the means of Ca, Mg, Na, S, and Fe contents (Brye, 2006) changed in opposite directions as those observed in the present study.
In general, except for the average K content, these results can be explained by the fact that in cut areas there was an exposure of the Typic Albaqualf subsoil layers, which have a somewhat different chemical composition than the surface layer (Table 1). The exposure of these layers caused a decrease in the average contents of Ca, Mg, Mn, and SOM, and an increase in the average Al content. Assuming that the characterized soil profile adequately represents the general vertical and horizontal soil composition in the cut area, a change in the soil attributes after leveling should be expected (Table 2). Therefore, it is possible to foresee the behavior trend of the average content of the chemical attributes after leveling if the cut soil profile is previously known. Values of Ca, Mg, S, CEC, Mn, P, and SOM decreased in the soil profile, whereas Al increased; the same trend was observed with the average content after leveling.
The average MBC increased from 297 to 510 mg kg‑1 as a result of the leveling operation, which can be attributed to the breakdown of larger aggregates caused by the severe disturbance of the soil, which, in turn, may have increased the soil microorganism population. However, land leveling resulted in 20% average decrease in SOM in the 0–0.20 m layer, which can represent a substantial loss of potential native soil fertility for crop production (Ramos & Martínez‑Casasnovas, 2006) and could contribute to global warming by depleting soil organic matter (Martínez‑Casasnovas & Ramos, 2009).
The average K content was the only attribute that did not behave as expected since it increased from 31 mg dm‑3 before leveling to 38 mg dm‑3 after leveling. Potassium can be present in larger contents in the soil due to the application of inorganic K fertilizers and, since potassium is a mobile cation in the soil, K would be expected to leach from the surface and accumulate in the subsoil. However, such behavior was not observed in the present study (Table 1). Brye et al. (2004) characterized the short‑term impact of land leveling on the magnitude
Table 2. Descriptive statistics, Kolmogorov‑Sminorv and variance homogeneity tests for chemical and biological attributes
measured before and after land leveling operation with cuts predominantly on Typic Albaqualf and fills predominantly on Umbric Epiaqualf.
Attribute(1) Mean Minimum value Maximum value Variance D(2)
Before After Before After Before After Before After Before After
pH (H2O) 4.9 4.9ns 4.5 4.5 5.4 5.6 0.03 0.03ns 0.05N 0.07N
SMP index 6.1 6.2*** 5.6 5.6 6.5 6.6 0.03 0.02ns 0.07N 0.13NN
H+Al (cmolc dm‑3) 4.6 4.1*** 3.0 3.1 6.3 5.1 0.49 0.16** 0.04N 0.1NN
SOM (g kg‑1) 21 17*** 17 9 26 21 3.0 7.7** 0.8N 1.3NN
TN (mg dm‑3) 1.4 1.3*** 1.1 0.6 2.0 1.8 0.03 0.06** 0.08N 0.1NN
P (mg dm‑3) 12.5 8.3*** 4.5 0.5 26.1 16.3 26.8 14.6ns 0.1NN 0.06N
Ca (cmolc dm‑3) 3.2 2.7*** 1.6 1.5 4.5 3.7 0.36 0.26** 0.14NN 0.08N
K (mg dm‑3) 31 38*** 17 18 92 64 179 144ns 0.15NN 0.13NN
Al (cmolc dm‑3) 0.6 0.8*** 0.1 0.3 1.5 1.8 0.10 0.07ns 0.16NN 0.12NN
Mg (cmolc dm‑3) 1.6 1.1*** 0.8 0.3 2.5 1.7 0.12 0.08ns 0.12NN 0.1NN
CEC (cmolc dm‑3) 9.7 8.2*** 7.2 6.1 11.7 9.7 1.00 0.61ns 0.08N 0.08NN
S (mg dm‑3) 15.8 11.8*** 8.7 5.8 35.2 17.1 17.89 6.55ns 0.13NN 0.07N
Fe (mg dm‑3) 1,379 1,242*** 995 617 1,737 1,818 20.11 35.01ns 0.1NN 0.08N
Mn (mg dm‑3) 12.2 8.9*** 4.9 1.8 21.6 18.0 14.67 8.94* 0.05N 0.11NN
B (mg dm‑3) 0.9 0.9ns 0.7 0.4 1.1 1.8 0.01 0.08** 0.08N 0.06N
Cu (mg dm‑3) 1.3 1.3ns 0.8 0.7 1.8 3.7 0.05 0.23ns 0.14NN 0.23NN
Zn (mg dm‑3) 1.1 0.7*** 0.3 0.1 2.7 2.0 0.28 0.10** 0.13NN 0.12NN
Na (mg dm‑3) 52 50ns 21 30 90 113 224 147* 0.08N 0.15NN
MBC (mg kg‑1) 297 510*** 118 290 527 802 6,841 14,857** 0.11NN 0.06N
(1)TN, total nitrogen; CEC, cation exchange capacity; MBC, microbial biomass carbon. (2)Value of the Kolmogorov‑Smirnov statistical test. NNormal
distributed data set at 5% probability. NNNo normal distributed data set at 5% probability. nsNonsignificant. *, ** and ***Significant by the t test, at 5, 1, and
of soil chemical attributes in an Albaqualtic Hapludalf in eastern Arkansas, USA, and also verified an increase in the K+ content after leveling. The authors attributed this behavior to the presence of certain clay minerals, such as illite, particularly in subsoil with an argillic horizon. A similar effect could also be attributed to the soils in the present study since Castilhos & Meurer (2002) found micas in the clay fraction of the argillic horizon of a similar Albaqualf collected in the same region.
The variance parity test of Levene (1960), modified by Brown & Forsythe (1974), applied to the variable sets before and after leveling, showed that the variances for pH (H2O), SMP index, P, K, Al, Mg, CEC, S, Fe, and Cu did not change significantly (Table 2). However, land leveling significantly changed the variance values for the other nine soil properties evaluated.
The great majority of the chemical attributes did not show relations between their values and the magnitude
Figure 2. Regressions between cut (‑) and fill (+) depths and pH (H2O), SMP index, soil organic matter (SOM), calcium (Ca),
magnesium (Mg), aluminum (Al), manganese (Mn), potassium (K), sodium (Na), potential acidity (H+Al), cation exchange capacity (CEC), and phosphorus (P), as well as equations and respective coefficients of determination. nsNonsignificant. * and
Pesq. agropec. bras., Brasília, v.48, n.11, p.1489‑1497, nov. 2013 DOI: 10.1590/S0100‑204X2013001100010
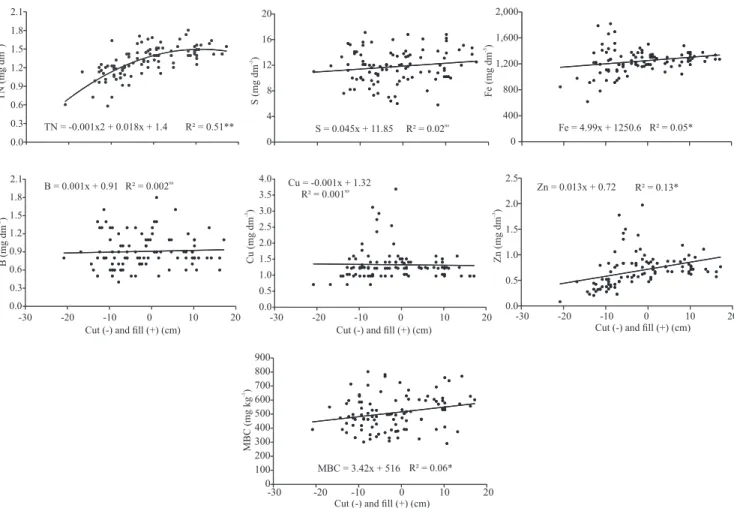
of cuts and fills (Figures 2 and 3). This can be observed by the low coefficients of determination (R2), although significant. The significant values of the regressions are related to the large number of samples, since, according to Charnet et al. (1999), increments in sample number increase the possibility of significance of the R2, even without a satisfactory relation between the variables. However, the R2 values, besides significant, were greater than 0.5 for SOM, K, P (Figure 2), and TN (Figure 3). The relation was quadratic for SOM, P, and TN, indicating increase of these attributes in cut areas and stability in fill areas.
Statistically significant relationships between soil chemical attributes and the magnitude of cuts and fills after leveling have potential to be used as a basis for future soil management projects. They open the possibility to improve soil fertility by applying
inorganic and organic fertilizers in a more rational way to obtain higher productivity of crops to be introduced in recently leveled land. The correlations between these attributes and the depths of cuts and fills suggest that the cut and fill map (Figure 1 B) could be used by farmers as a practical tool for the production system, i.e., in the case of potassium (Figure 2), the greater the cut depth, the greater the need of a supplementation of this nutrient. For SOM (Figure 2), the application of N would be homogeneous in the fill areas. In this way, the application of a given nutrient could be made taking into account the homogeneity of the cut zones. The linear regression for MBC and the magnitude of cuts and fills (Figure 3) show a positive slope that indicates lower MBC in cut areas. In other words, there was an increase in soil microorganism populations in filled areas after leveling.
Figure 3. Regressions between cut (‑) and fill (+) depths and soil total nitrogen (TN), sulfur (S), iron (Fe), boron (B), copper
(Cu), zinc (Zn), and soil microbial biomass carbon (MBC), as well as equations and respective coefficients of determination.
Conclusions
1. Land leveling operations alter the magnitude of soil chemical and biological attributes.
2. The changes in the values of soil chemical attributes are related to the characteristics of the soil profile of cut areas.
3. The relationships between chemical attributes and the magnitudes of cuts and fills indicate that land leveling map may be a useful tool for degraded soil recuperation through amendments and organic fertilizers.
Acknowledgments
To Embrapa Clima Temperado, for field support; to Conselho Nacional de Desenvolvimento Científico e Tecnológico (CNPq) and to Coordenação de Aperfeiçoamento de Pessoal de Nível Superior (Capes), for funding and scholarships granted.
References
BROWN, M.B.; FORSYTHE, A.B. Robust tests for equality of variances. Journal of the American Statistical Association, v.69,
p.364‑367, 1974. DOI: 10.1080/01621459.1974.10482955. BRYE, K.R. Soil biochemical properties as affected by land leveling in a Clayey Aquert. Soil Science Society of America
Journal, v.70, p.1129‑1139, 2006. DOI: 10.2136/sssaj2005.0348.
BRYE, K.R.; SLATON, N.A.; MOZAFFARI, M.; SAVIN, M.C.; NORMAN, R.J.; MILLER, D.M. Short‑term effects of land
leveling on soil chemical properties and their relationships with
microbial biomass. Soil Science Society of America Journal,
v.68, p.924‑934, 2004. DOI: 10.2136/sssaj2004.0924.
BRYE, K.R.; SLATON, N.A.; NORMAN, R.J. Penetration resistance as affected by shallow‑cut land leveling and cropping.
Soil and Tillage Research, v.81, p.1‑13, 2005. DOI: 10.1016/j.
still.2004.03.019.
CASTILHOS, R.M.V.; MEURER, E.J. Suprimento de potássio de solos do Rio Grande do Sul para arroz irrigado por alagamento.
Revista Brasileira de Ciência do Solo, v.26, p.977‑982, 2002.
CAY, E.R.; CATTLE, S.R. The effects of landforming on soil profile characteristics of an irrigated cotton‑producing area of southeastern Australia. Soil and Tillage Research, v.84, p.76‑86,
2005. DOI: 10.1016/j.still.2004.09.019.
CENSO da lavoura de arroz irrigado do Rio Grande do Sul – safra 2004/05. Porto Alegre: IRGA, 2006. 122p.
CHARNET, R.; BONVINO, H.; FREIRE, C.A. de L.; CHARNET, E.M.R. Análise de modelos de regressão linear: com aplicações.
Campinas: Unicamp, 1999. 354p.
CLAESSEN, M.E.C. (Org.). Manual de métodos de análise de solo. 2.ed. rev. atual. Rio de Janeiro: Embrapa‑CNPS, 1997. 212p.
(Embrapa‑CNPS. Documentos, 1).
FERREIRA, A.S.; CAMARGO, F.A.; VIDOR, C. Use of microwave radiation to evaluate soil microbial biomass. Revista
Brasileira de Ciência do Solo, v.23, p.991‑996, 1999.
FERREIRA, D.F. Estatística básica. Lavras: Ed. da UFLA, 2005.
664p.
GEE, G.W.; BAUDER, J.W. Particles size analysis. In: KLUTE, A. (Ed.). Methods of soil analysis. Part 1. Physical and mineralogical methods. 2nd ed. Madison: American Society of
Agronomy: Soil Science Society of America, 1986. p.383‑411. KÖPPEN, W. Grundriss der Klimakunde. Leipzig: Walter de
Gruyter, 1931. 388p.
LEVENE, H. Robust test for equality of variances. In: OLKIN, I.; GHURYE, S.G.; HOEFFDING, W.; MADOW, W.G.; MANN, H.B. (Ed.). Contribution to probability and statistics. Stanford:
Stanford University, 1960. p.278‑292.
MANUAL de adubação e de calagem para os Estados do Rio Grande do Sul e Santa Catarina. 10.ed. Porto Alegre: Sociedade Brasileira de Ciência do Solo ‑ Núcleo Regional Sul ‑ Comissão de Química e Fertilidade do Solo, 2004. 400p.
MARTÍNEZ‑CASASNOVAS, J.A.; RAMOS, M.C. Soil alteration due to erosion, ploughing and levelling of vineyards in North east Spain. Soil Use and Management, v.25, p.183‑192, 2009. DOI:
10.1111/j.1475‑2743.2009.00215.x.
PARFITT, J.M.B.; SILVA, C.A.S.; PETRINI, J.A. Estruturação e sistematização da lavoura de arroz irrigado. In: GOMES, A. da S.; MAGALHÃES JUNIOR, A.M. (Ed.). Arroz irrigado no Sul
do Brasil. Pelotas: Embrapa Clima Temperado; Brasília: Embrapa
Informação Tecnológica, 2004. p.237‑257.
PINTO, L.F.S.; LAUS NETO, J.A.; PAULETTO, E.A. Solos de várzea do Sul do Brasil cultivados com arroz irrigado. In: GOMES, A. da S.; MAGALHÃES JUNIOR, A.M. de (Ed.). Arroz irrigado
no Sul do Brasil. Pelotas: Embrapa Clima Temperado; Brasília:
Embrapa Informação Tecnológica, 2004. p.75‑95.
RAMOS, M.C.; COTS‑FOLCH, R.; MARTÍNEZ‑CASASNOVAS, J.A. Effects of land terracing on soil properties in the Priorat region in Northeastern Spain: a multivariate analysis. Geoderma, v.142,
p.251‑261, 2007. DOI: 10.1016/j.geoderma.2007.08.005.
RAMOS, M.C.; MARTÍNEZ‑CASASNOVAS, J.A. Impact of land leveling on soil moisture and runoff variability in vineyards under different rainfall distributions in a Mediterranean climate and its influence on crop productivity. Journal of Hydrology, v.321,
p.131‑146, 2006. DOI: 10.1016/j.jhydrol.2005.07.055.
RAMOS, M.C.; MARTÍNEZ‑CASASNOVAS, J.A. Soil water balance in rainfed vineyards of the Penedès region (Northeastern Spain) affected by rainfall characteristics and land leveling: influence on grape yield. Plant and Soil, v.333, p.375‑389, 2010.
DOI: 10.1007/s11104‑010‑0353‑y.
Pesq. agropec. bras., Brasília, v.48, n.11, p.1489‑1497, nov. 2013 DOI: 10.1590/S0100‑204X2013001100010 regressão. Ciência Rural, v.38, p.981‑988, 2008. DOI: 10.1590/
S0103‑84782008000400012.
SANTOS, H.G. dos; JACOMINE, P.K.T.; ANJOS, L.H.C. dos; OLIVEIRA, V.A. de; OLIVEIRA, J.B. de; COELHO, M.R.; LUMBRERAS, J.F.; CUNHA, T.J.F. (Ed.). Sistema brasileiro de
classificação de solos. 2.ed. Rio de Janeiro: Embrapa Solos, 2006.
306p.
SANTOS, V.B. dos; CASTILHOS, D.D.; CASTILHOS, R.M.V.; PAULETTO, E.A.; GOMES, A. da S.; SILVA, D.G. da. Biomassa, atividade microbiana e teores de carbono e nitrogênio totais de um Planossolo sob diferentes sistemas de manejo. Revista Brasileira de Agrociência, v.10, p.333‑338, 2004.
TEDESCO, M.J.; GIANELLO, C.; BISSANI, C.A.; BOHMEN, H.; VOLKWEISS, S.J. Análises de solo, plantas e outros materiais.
2.ed. Porto Alegre: UFRGS, 1995. 174p.
UNITED STATES DEPARTMENT OF AGRICULTURE. Natural Resources Conservation Service. Keys to soil taxonomy. 11th ed.
2010. Washington: USDA, 2010. 346p.
VANCE, E.D.; BROOKES, P.C.; JENKINSON, D.S. An extraction method for measuring soil microbial biomass C.
Soil Biology and Biochemistry, v.19, p.703‑707, 1987. DOI:
10.1016/0038‑0717(87)90052‑6.
WALKER, T.W.; KINGERY, W.L.; STREET, J.E.; COX, M.S.; OLDHAM, J.L.; GERARD, P.D.; HAN, F.X. Rice yield and soil chemical properties as affected by precision land leveling in Alluvial soils. Agronomy Journal, v.95, p.1483‑1488, 2003. DOI:
10.2134/agronj2003.1483.
WEBSTER, R.; OLIVER, M.A. Geostatistics for environmental scientists. 2nd ed. Chichester: J. Wiley, 2007. 325p. DOI:
10.1002/9780470517277.