Pesq. agropec. bras., Brasília, v.52, n.4, p.215-227, abr. 2017
DOI: 10.1590/S0100-204X2017000400001
Global radiation by simplified models for
the state of Mato Grosso, Brazil
Adilson Pacheco de Souza
(1), Andréa Carvalho da Silva
(1), Adriana Aki Tanaka
(1), Eduardo Morgan Uliana
(1),
Frederico Terra de Almeida
(1), Antonio Evaldo Klar
(2)and Anthony Wellington Almeida Gomes
(3)(1)
Universidade Federal de Mato Grosso, Campus Sinop, Instituto de Ciências Agrárias e Ambientais, Avenida Alexandre Ferronato,
n
o1.200, Setor Industrial, CEP 78557-267 Sinop, MT, Brazil. E-mail: [email protected], [email protected], [email protected],
[email protected], [email protected]
(2)Universidade Estadual Paulista Júlio de Mesquita Filho, Faculdade de Ciências
Agronômicas de Botucatu, Departamento de Engenharia Rural, Fazenda Lageado, Rua José Barbosa de Barros, n
o1.780, CEP 18610-307
Botucatu, SP, Brazil. E-mail: [email protected]
(3)Universidade Federal Rural do Pernambuco, Unidade Acadêmica de Garanhuns, Avenida
Bom Pastor, s/n
o, Boa Vista, CEP 55292-270 Garanhuns, PE, Brazil. E-mail: [email protected]
Abstract – The objective of this work was to estimate the global radiation by simplified models for the state
of Mato Grosso, Brazil. The parameterized coefficients of 15 simplified models were regionally calibrated
to estimate the daily global radiation, based only on air temperature, using data from 28 automatic weather
stations (AWS) of the network of the Brazilian Meteorology Institute, distributed throughout the different
biomes of the state of Mato Grosso. The simplified models are mostly derived from the Hargreaves and
Bristow & Campbell methods, with different parameterized coefficients to be calibrated. The coefficient of
determination (R
2), the mean bias error (MBE), the root mean square error (RMSE), and Willmott’s d index
were used to evaluate statistical performance. For the recommendation of models per station and/or biome,
the models were rated numerically (position values) according to their specific performance in each statistical
indicator. The simplified models derived from Bristow & Campbell showed better statistical performances for
estimating daily global radiation. The values of the calibrated coefficients of the same model varied greatly
among the AWS and biomes. The R
2values ranged from 0.60 to 0.75, indicating a satisfactory result for the
obtained calibrations. The Bristow & Campbell model for the Amazon and the Cerrado and the Goodin
model for the Cerrado are recommended, with scattering varying between 1.52 and 4.33 MJ m
-2per day and
adjustments greater than 65%.
Index terms: air temperature, Amazon, Cerrado, parameterized coefficients, solar radiation.
Radiação global por modelos simplificados para o Estado de Mato Grosso
Resumo – O objetivo deste trabalho foi estimar a radiação global por modelos simplificados para o Estado
de Mato Grosso. Os coeficientes parametrizados de 15 modelos simplificados foram regionalmente
calibrados para estimativa da radiação global diária, com base apenas na temperatura do ar, a partir de
dados de 28 estações meteorológicas automáticas (EMAs) da rede do Instituto Nacional de Meteorologia,
distribuídas nos diferentes biomas do Estado de Mato Grosso. Os modelos simplificados avaliados foram
derivados principalmente dos métodos de Hargreaves e Bristow & Campbell, com diferentes coeficientes
parametrizados a serem calibrados. Para a avaliação do desempenho estatístico, foram empregados o
coeficiente de determinação (R
2), o erro absoluto médio (MBE), a raiz quadrada do erro quadrático médio
(RMSE) e o índice d de Willmott. Para a recomendação de modelos por estação e/ou bioma, os modelos foram
classificados numericamente (valores de posição), de acordo com o desempenho específico em cada indicativo
estatístico. Os modelos simplificados derivados de Bristow & Campbell apresentaram melhores desempenhos
estatísticos para estimativa da radiação global diária. Os valores dos coeficientes calibrados de um mesmo
modelo variaram grandemente entre as EMAs e os biomas. Os valores do R
2variaram de 0,60 a 0,75, o que
indica resultados satisfatórios nas calibrações obtidas. São indicados o modelo de Bristow & Campbell para a
Amazônia e o Cerrado e o de Goodin para o Cerrado, com espalhamentos que variam entre 1,52 e 4,33 MJ m
-2por dia e ajustamentos superiores a 65%.
Termos para indexação: temperatura do ar, Amazônia, Cerrado, coeficientes parametrizados, radiação solar.
Introduction
There is a rising interest in the research field of solar
irradiation due to its many applications in the physical,
216
A.P. de Souza et al.
Pesq. agropec. bras., Brasília, v.52, n.4, p.215-227, abr. 2017
DOI: 10.1590/S0100-204X2017000400001
studies on evapotranspiration, optimization of water
demand in irrigation, crop forecasting, agricultural
planning, climate change, development of energy
technology systems (thermal and photovoltaic), food
preservation, buildings and ambiance, among others
(Antonanzas-Torres et al., 2013; Dumas et al., 2015;
Huber et al., 2016).
Geographic, astronomical, meteorological,
geometric, and biophysical factors – such as the
dispersion of air molecules, water vapor content in the
atmosphere, dust scattering, and other atmospheric
constituents, including O
2, CO
2, and N
2– affect the
amount of solar radiation that reaches Earth’s surface
and are typically used as the basis of empirical models
(Badescu, 2013; Teke et al., 2015; Huber et al., 2016).
In Brazilian meteorological researches, after the
diffusion of automatic weather stations (AWS), there has
been a significant increase in the routine measurements
of solar radiation. However, in some regions, such
as in the state of Mato Grosso, there is a low spatial
distribution of AWS that measure solar radiation. In
general, the routine monitoring of solar radiation is
carried out by Instituto Brasileiro de Meteorologia
(Inmet), universities, and research institutes, depending
on the costs involved in acquiring and/or maintaining
the instruments. For hydro-agricultural applications,
the use of long-time databases is essential; however,
when these are dependent on solar radiation, they
can only be obtained by estimates of and applications
on historical series of conventional weather stations
(normal climatology).
In this context, the high cost of measuring solar
irradiation with a pyranometer and the scarcity of long,
reliable datasets for specific locations has encouraged
the use of simplified estimators, including models
based on air temperature, air humidity, precipitation,
sky cover (clouds), sunshine fraction, linear regression,
geostationary satellite data, stochastic models, artificial
neural networks, among others (Gueymard & Myers,
2009; Antonanzas-Torres et al., 2013; Bojanowski et
al., 2013; Veeraboina & Guduri, 2014; Yacef et al.,
2014; Dumas et al., 2015; Teke et al., 2015).
Air temperature, sunshine fraction, and
precipitation are the meteorological parameters
with greater abundance and spatial distribution in
databases; therefore, they are the most commonly
adopted in the simplified models used to estimate
global radiation for different climatic regions and/or
temporal scales (Besharat et al., 2013; Bojanowski et
al., 2013; Veeraboina & Guduri, 2014; Yacef et al.,
2014; Dumas et al., 2015). However, the accuracy
of these models may vary when applied in different
locations, requiring local/regional calibrations of the
parameterized coefficients (Teke et al., 2015; Huber et
al., 2016).
The objective of this work was to estimate the global
radiation by simplified models for the state of Mato
Grosso, Brazil.
Materials and Methods
The data used were obtained from the AWS of
Inmet located in 28 municipalities of the state of Mato
Grosso, Brazil (Table 1). The installation, operation,
and maintenance of the AWS, as well as the availability
of their databases, are described by Moura et al. (2011).
It should be noted that, although the network of stations
in Mato Grosso is formed by 35 AWS, some of them
were disregarded in the present study due to flaws and
to the lack of data, which were related to equipment
failures and/or calibration, to the lack of maintenance,
or to the fact they were closed. Since the stations began
operating on different dates in each municipality, the
periods of data collection varied. Of the daily database,
70 and 30% were used for calibration and validation,
respectively.
The state of Mato Grosso is located in the Midwestern
region of Brazil (06°00'S, 19°45'S and 50°06'W,
62°45'W), totaling 903,357.908 km
2, which represent
56.23% of the region and 10.61% of the entire Brazilian
territory. The state stands out for its large territorial
extension and insertion into the natural landscape of
three major biomes: Amazon rainforest, Cerrado, and
Pantanal (Figure 1), which provide a wide range of
ecological, social, economic, cultural, and production/
agro-industrial development situations.
Two well-defined seasons occur in the state of Mato
Grosso: rainy, from October to April; and dry, from
May to September. The average annual temperatures
range between 23 and 26.84°C and total annual rainfall
varies from 1,200 to 2,000 mm, with higher levels in
the north and east-north of the state and in regions with
altitudes close to 800 m. The climate is classified as
Aw (tropical savanna climate) and as Cwa (tropical
climate), according to Köppen (Souza et al., 2013).
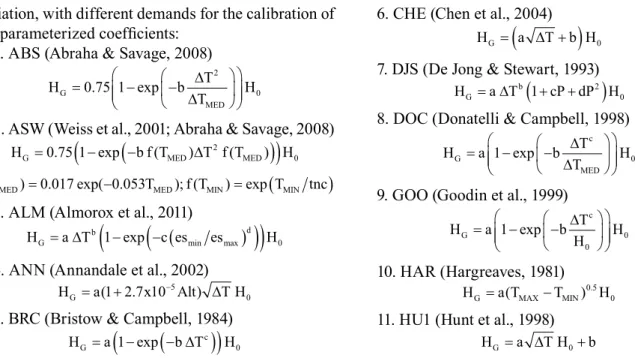
The following 15 simplified models, mostly derived
from those proposed by Hargreaves (1981) and Bristow
Estimates of global radiation by simplified models
217
Pesq. agropec. bras., Brasília, v.52, n.4, p.215-227, abr. 2017
DOI: 10.1590/S0100-204X2017000400001
radiation, with different demands for the calibration of
the parameterized coefficients:
1. ABS (Abraha & Savage, 2008)
H
b
T
T
H
G MED=
−
−
∆
∆
0 75 1
2
0
.
exp
2. ASW (Weiss et al., 2001; Abraha & Savage, 2008)
H
G=
0 75 1
(
−
(
−
b
f T
MED∆
T f T
2 MED)
)
H
0
.
exp
(
)
(
)
f T
(
MED)
=
0 017
.
exp(
−
0 053
.
T
MED); (
f T
MIN)
=
exp
(
T
MINtnc
)
3. ALM (Almorox et al., 2011)
H
Ga
T
bc es
es
dH
=
∆
(
1
−
exp
(
−
(
min max)
)
)
04. ANN (Annandale et al., 2002)
H
G=
a
+
x
Alt
∆
T H
−
(
1 2 7 10
.
5)
05. BRC (Bristow & Campbell, 1984)
H
Ga
b T
H
c
=
(
1
−
(
− ∆
)
)
0
exp
6. CHE (Chen et al., 2004)
H
G=
(
a
∆
T
+
b H
)
07. DJS (De Jong & Stewart, 1993)
H
a
T
c
P
dP
H
G
b
=
∆
(
1
+
+
2)
08. DOC (Donatelli & Campbell, 1998)
H
a
b
T
T
H
G c MED=
−
−
∆
∆
1
exp
09. GOO (Goodin et al., 1999)
H
a
b
T
H
H
G c=
−
−
∆
1
0 0exp
10. HAR (Hargreaves, 1981)
H
G=
a
(
T
MAX−
T
MIN)
0 5.H
0
11. HU1 (Hunt et al., 1998)
H
G=
a
∆
T H
0+
b
Table 1.
Automatic weather stations of the network of Instituto Nacional de Meteorologia (Inmet), from where the data used
to estimate daily global radiation were collected, located in the state of Mato Grosso, Brazil.
Code
Station name
Latitude
Longitude Altitude (m) Data collection period Number of data Effective data Losses (%)
Amazon biome and transitions
A-924 1. Alta Floresta
-10.0672
-56.7522
294
9/2011
–
1/2013
519
422
18.69
A-910 2. Apiacás
-9.5639
-57.3936
220
10/2006–1/2013
2,315
1,364
41.08
A-926 3. Carlinda
-9.9703
-55.8272
300
4/2008–1/2013
1,768
1,517
14.20
A-906 4. Guarantã do Norte
-9.95
-54.8833
320
5/2007–1/2013
2,102
1,338
36.35
A-919 5. Cotriguaçu
-9.9061
-58.5719
261
1/2008–1/2013
1,858
1,564
15.82
A-914 6. Juara
-11.2803
-57.5267
260
11/2006–2/2012
1,947
1,265
35.03
A-920 7. Juína
-11.375
-58.775
374
10/2007–1/2013
1,949
1,259
35.40
A-928 8. Nova Maringá
-13.0386
-57.0922
353
4/2008–1/2013
1,768
975
44.85
A-917 9. Sinop
-11.9822
-55.5658
371
11/2006–6/2012
2,284
930
59.28
A-904 10. Sorriso
-12.5452
-55.7113
380
1/2009–1/2013
1,493
958
35.83
A-917 11. Pontes de Lacerda
-15.2511
-59.3467
256
1/2008–1/2013
1,858
1,301
29.98
A-935 12. Porto Estrela
-15.3247
-57.2264
145
2/2008–1/2013
1,827
767
58.02
A-936 13. Salto do Céu
-15.1247
-58.1275
303
1/2008–1/2013
1,858
1,462
21.31
A-922 14. Vila Bela da Santíssima Trindade
-15.0628
-59.8729
222
1/2008–1/2013
1,858
1,404
24.43
Cerrado biome and transitions
A-929
15. Nova Ubiratã
-13.4111
-54.7522
518
4/2008–1/2013
1,768
1,168
33.94
A-912 16. Campo Verde
-15.3139
-55.0808
749
1/2008–1/2013
1,858
898
51.67
A-907 17. Rondonópolis
-16.45
-54.5666
284
1/2008–1/2013
1,858
1,377
25.89
A-932 18. Guiratinga
-16.3417
-53.7661
526
1/2008–1/2013
1,858
1,201
35.36
A-933 19. Itiquira
-17.175
-54.5014
585
8/2008–1/2013
1,646
981
40.4
A-913 20. Comodoro
-13.4231
-59.4546
591
1/2008–1/2013
1,858
1,511
18.68
A-927 21. Novo Mundo
-12.5219
-58.2314
431
3/2008–1/2013
1,798
1,373
23.64
A-905 22. Campo Novo dos Parecis
-13.7833
-57.8333
570
6/2010–1/2013
976
505
48.26
A-931 23. Santo Antônio do Leste
-14.9278
-53.8836
648
8/2008–1/2013
1,646
1,238
24.79
A-930 24. Gaúcha do Norte
-13.1847
-53.2575
379
8/2008–1/2013
1,646
1,376
16.40
A-908 25. Água Boa
-14.0161
-52.2122
432
1/2008–1/2013
1,858
1,631
12.22
A-918 26. Confresa
-10.6539
-51.5668
237
6/2008–1/2013
1,707
1,278
25.13
A-921 27. São Félix do Araguaia
-11.6189
-50.7278
218
8/2011–1/2013
550
456
17.09
Pantanal biome
218
A.P. de Souza et al.
Pesq. agropec. bras., Brasília, v.52, n.4, p.215-227, abr. 2017
DOI: 10.1590/S0100-204X2017000400001
12. HU2 (Hunt et al., 1998)
H
G=
a
∆
T H
0+
bT
MAX+
cP
+
dP
2+
e
13. MAH (Mahmood & Hubbard, 2002)
H
G=
a
∆
T
0 69H
0 0 91
. .
14. MEV (Meza & Varas, 2000)
H
G=
0 75 1
(
−
(
− ∆
b
T
2)
)
H
0
.
exp
15. THR (Thornton & Running, 1999)
HG
=
H
0(
−
(
− ∆
b T
)
)
1 5
1 0 9
. exp
.in which ∆T is the thermal amplitude; T
medis the
average air temperature; T
minis the minimum air
temperature; T
maxis the maximum air temperature;
es
minis the minimum vapor saturation pressure; es
maxis the maximum vapor saturation pressure; Alt is
the local altitude; P is precipitation; tnc is the factor
temperature of summer nights; H
0is the daily global
solar radiation on the horizontal surface (MJ m
-2per
day); and a, b, and c are the parameterized coefficients
to be calibrated regionally.
The coefficients of the equations were adjusted using
the solver optimization tool of Microsoft Excel, based
on the maximization of the coefficient of determination
(R
2). To assess the performance of the equations for
daily estimates on sloping and horizontal surfaces, the
statistical indicators R
2, mean bias error (MBE), root
mean square error (RMSE), and Willmott’s adjustment
d index were employed, as recommended by Souza et
al. (2011), Badescu (2013), and Teke et al. (2015), using
the following equations:
MBE
P
O
N
RMSE
P
O
N
d
P
O
i i
i N
i i
i N
i i
=
−
−
=
−
=
−
−
=
∑
∑
(
)
;
(
)
;
(
)
. 1
2
1
0 5
1
2 2
1
2
i N
i i
P
O
O
O
=
∑
∑
−
+
−
(
)
;
in which P
iare the estimated values; O
iare the
measured values; N is the number of observations; |P
i|
is the absolute value of the difference (P
i- O
i); and |O
i|
Estimates of global radiation by simplified models
219
Pesq. agropec. bras., Brasília, v.52, n.4, p.215-227, abr. 2017
DOI: 10.1590/S0100-204X2017000400001
is the absolute value of the difference (P
i- O
i). In these
cases, i ranges from 1 to N.
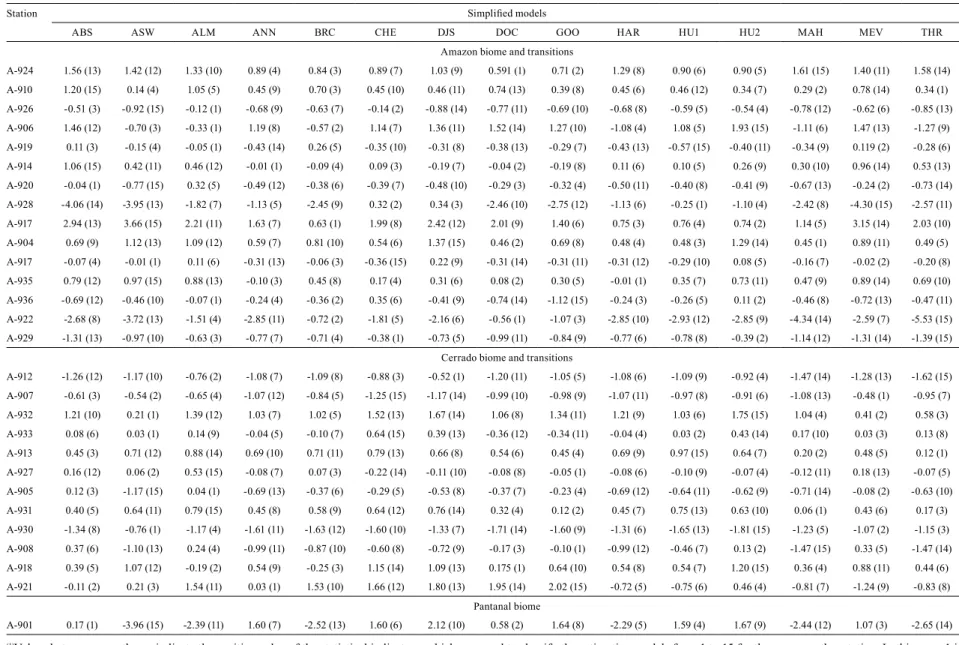
Then, the position values (Vp) of the statistical
indicators (R
2, MBE, RMSE, and Willmott’s adjustment
d index), based on their assigned weights, were used
to classify and to define the best model for estimating
global radiation. The models were classified from 1 to
15 for each weather station, according to the Vp of the
indicators. In this case, 1 represents the best model and
15 the worst one; consequently, the best model is the
one with the lowest sum of assigned weights, i.e., with
lower Vp accumulated for all statistical indicators.
Results and Discussion
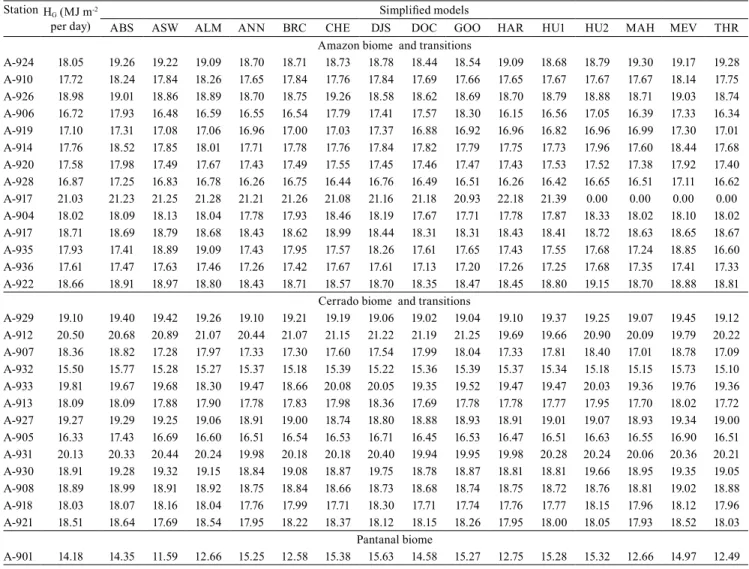
Due to the geographical location and rainfall
behavior of the state of Mato Grosso, the global radiation
measured in the Amazon and Cerrado biomes showed
similar averages, i.e., 18.05±1.08 and 18.57±1.41 MJ m
-2per day, respectively (Table 2). According to Souza et
al. (2013), seasonal changes in cloudiness and latitude
are the main factors that determine the variation of
solar radiation in the state. The averages obtained
for the periods in which the data from the AWS were
analyzed are in alignment with those of other studies
carried out in the evaluated biomes (Tiba, 2000); this
includes the lower global radiation values observed
at the weather station located in the municipality of
Cuiabá (14.18 MJ m
-2per day), when compared with
those of the other regions (Gomes et al., 2012).
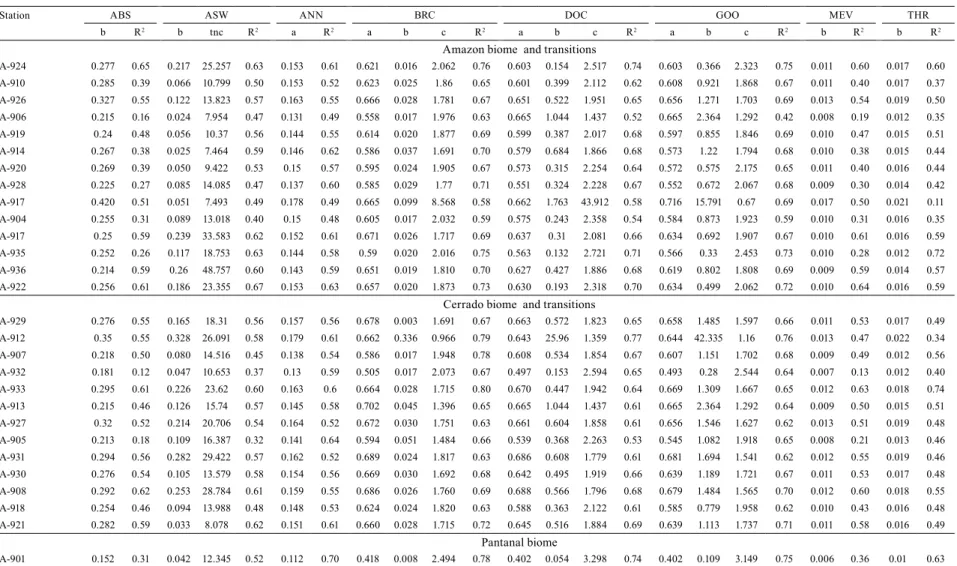
Overall, the values of the calibrated coefficients of
the same model varied greatly among the AWS and
biomes (Table 3). In this case, the R2 also shows the
high adjustment variability of the models within the
same biome, resulting from changes in air temperature,
which varies temporally and spatially due to energy
balance, local weather and environment (configuration
of surface exposure, land use and occupation, among
others).
These results, including discrepancies, are in
alignment with those found in the literature for regional
models with different calibrations. According to Meza
& Varas (2000), these differences indicate that the local
calibration for some simplified models can be crucial
for their performance; however, most of the proposed
coefficients in the literature did not correctly estimate
the historical averages in each location. Weiss et al.
(2001) pointed out that adjustments or calibrations
of the coefficients of the empirical models for each
municipality allow finding a specific coefficient that
best fits the environmental conditions of the site, which
reduces the average error of the differences between
the estimated and measured values of solar radiation.
The R
2is one of the first indicators of the statistical
performance of estimation models, but requires other
valuation parameters (Teke et al., 2015). According to
Souza et al. (2011), the combined use of the statistical
indicators MBE, RMSE, and the adjustment d index
provides an adequate alternative for the validation of
statistical models with the simultaneous analysis of
deviations from the mean, identifying the occurrence
of under- or overestimation, spreading, and model
adjustment in relation to the measured values.
In general, the R
2values ranging from 0.60 to 0.75
indicate satisfactory results for calibration proposals,
as found by Borges et al. (2010) for the municipality
of Cruz das Almas, in the state of Bahia, Brazil.
However, these results were lower than those reported
by Silva et al. (2012) for different regions of the state
of Minas Gerais, also in Brazil, and for the original
models evaluated.
Good performances are normally expected when
databases from regions climatically similar to those of
the original models are used. It should also be noted
that the size of the database affects the obtained results,
since calibrations and/or performance reviews carried
out with data obtained during years of air maximum
and minimum temperatures can occur in atypical
years, with effects from other external phenomena of
the region.
The ALM, DJS, and HU2 models with calibration
coefficients for rainfall dependence showed that this
variable made it difficult to estimate solar radiation
due to the low R
2values, as observed by Liu et al.
(2009) and Silva et al. (2012). This could be attributed
to measurement errors in the rainfall monitoring
equipment and/or to errors in bug fixes, particularly for
regions with high temporal and spatial variability in
rainfall events of convective origin (Souza et al., 2013).
220
A.P. de Souza et al.
Pesq. agropec. bras., Brasília, v.52, n.4, p.215-227, abr. 2017
DOI: 10.1590/S0100-204X2017000400001
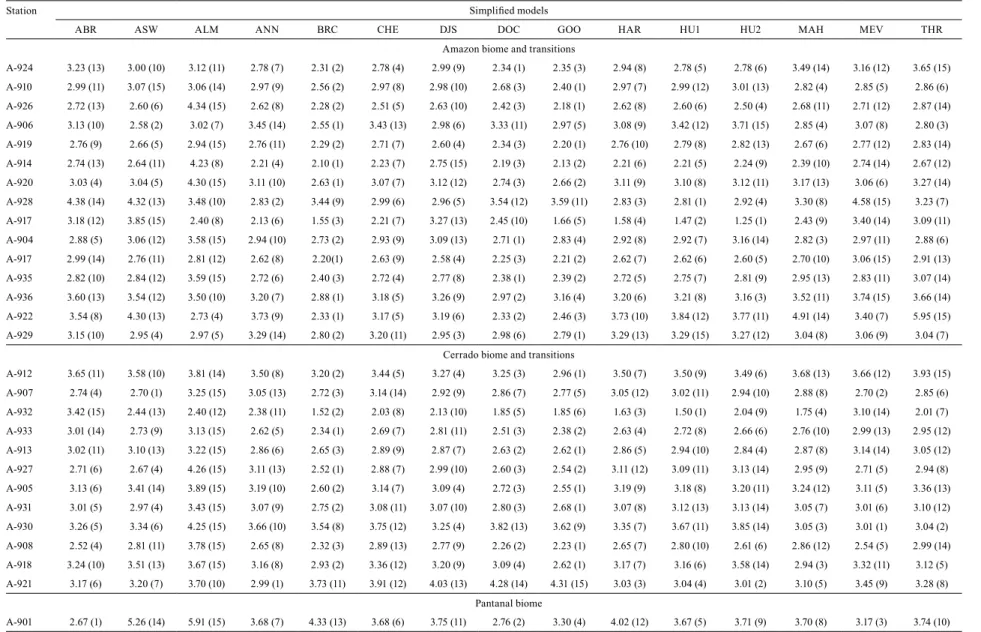
Table 2.
Daily global radiation (HG) measured and estimated by 15 simplified models using data from 28 automatic weather
stations located in the state of Mato Grosso, Brazil
(1).
Station
H
G(MJ m
-2per day)
Simplified models
ABS
ASW
ALM
ANN
BRC
CHE
DJS
DOC
GOO
HAR
HU1
HU2
MAH
MEV
THR
Amazon biome and transitions
A-924
18.05
19.26
19.22
19.09
18.70
18.71
18.73
18.78
18.44
18.54
19.09
18.68
18.79
19.30
19.17
19.28
A-910
17.72
18.24
17.84
18.26
17.65
17.84
17.76
17.84
17.69
17.66
17.65
17.67
17.67
17.67
18.14
17.75
A-926
18.98
19.01
18.86
18.89
18.70
18.75
19.26
18.58
18.62
18.69
18.70
18.79
18.88
18.71
19.03
18.74
A-906
16.72
17.93
16.48
16.59
16.55
16.54
17.79
17.41
17.57
18.30
16.15
16.56
17.05
16.39
17.33
16.34
A-919
17.10
17.31
17.08
17.06
16.96
17.00
17.03
17.37
16.88
16.92
16.96
16.82
16.96
16.99
17.30
17.01
A-914
17.76
18.52
17.85
18.01
17.71
17.78
17.76
17.84
17.82
17.79
17.75
17.73
17.96
17.60
18.44
17.68
A-920
17.58
17.98
17.49
17.67
17.43
17.49
17.55
17.45
17.46
17.47
17.43
17.53
17.52
17.38
17.92
17.40
A-928
16.87
17.25
16.83
16.78
16.26
16.75
16.44
16.76
16.49
16.51
16.26
16.42
16.65
16.51
17.11
16.62
A-917
21.03
21.23
21.25
21.28
21.21
21.26
21.08
21.16
21.18
20.93
22.18
21.39
0.00
0.00
0.00
0.00
A-904
18.02
18.09
18.13
18.04
17.78
17.93
18.46
18.19
17.67
17.71
17.78
17.87
18.33
18.02
18.10
18.02
A-917
18.71
18.69
18.79
18.68
18.43
18.62
18.99
18.44
18.31
18.31
18.43
18.41
18.72
18.63
18.65
18.67
A-935
17.93
17.41
18.89
19.09
17.43
17.95
17.57
18.26
17.61
17.65
17.43
17.55
17.68
17.24
18.85
16.60
A-936
17.61
17.47
17.63
17.46
17.26
17.42
17.67
17.61
17.13
17.20
17.26
17.25
17.68
17.35
17.41
17.33
A-922
18.66
18.91
18.97
18.80
18.43
18.71
18.57
18.70
18.35
18.47
18.45
18.80
19.15
18.70
18.88
18.81
Cerrado biome and transitions
A-929
19.10
19.40
19.42
19.26
19.10
19.21
19.19
19.06
19.02
19.04
19.10
19.37
19.25
19.07
19.45
19.12
A-912
20.50
20.68
20.89
21.07
20.44
21.07
21.15
21.22
21.19
21.25
19.69
19.66
20.90
20.09
19.79
20.22
A-907
18.36
18.82
17.28
17.97
17.33
17.30
17.60
17.54
17.99
18.04
17.33
17.81
18.40
17.01
18.78
17.09
A-932
15.50
15.77
15.28
15.27
15.37
15.18
15.39
15.22
15.36
15.39
15.37
15.34
15.18
15.15
15.73
15.10
A-933
19.81
19.67
19.68
18.30
19.47
18.66
20.08
20.05
19.35
19.52
19.47
19.47
20.03
19.36
19.76
19.36
A-913
18.09
18.09
17.88
17.90
17.78
17.83
17.98
18.36
17.69
17.78
17.78
17.77
17.95
17.70
18.02
17.72
A-927
19.27
19.29
19.25
19.06
18.91
19.00
18.74
18.80
18.88
18.93
18.91
19.01
19.07
18.93
19.34
19.00
A-905
16.33
17.43
16.69
16.60
16.51
16.54
16.53
16.71
16.45
16.53
16.47
16.51
16.63
16.55
16.90
16.51
A-931
20.13
20.33
20.44
20.24
19.98
20.18
20.18
20.40
19.94
19.95
19.98
20.28
20.24
20.06
20.36
20.21
A-930
18.91
19.28
19.32
19.15
18.84
19.08
18.87
19.75
18.78
18.87
18.81
18.81
19.66
18.95
19.35
19.05
A-908
18.89
18.99
18.91
18.92
18.75
18.84
18.66
18.73
18.68
18.74
18.75
18.72
18.76
18.81
19.02
18.88
A-918
18.03
18.07
18.16
18.04
17.76
17.99
17.71
18.30
17.71
17.74
17.76
17.77
18.15
17.96
18.12
17.96
A-921
18.51
18.64
17.69
18.54
17.95
18.22
18.37
18.12
18.15
18.26
17.95
18.00
18.05
17.93
18.52
18.03
Pantanal biome
A-901
14.18
14.35
11.59
12.66
15.25
12.58
15.38
15.63
14.58
15.27
12.75
15.28
15.32
12.66
14.97
12.49
(1)
The periods of data collection are shown in Table 1. Models: ABS, Abraha & Savage (2008); ASW, Weiss et al. (
2001
) and Abraha & Savage (2008);
ALM, Almorox et al. (2011); ANN, Annandale et al. (2002); BRC, Bristow & Campbell (1984); CHE, Chen et al. (2004); DJS, De Jong & Stewart (1993);
DOC, Donatelli & Campbell (1998); GOO, Goodin et al. (1999); HAR, Hargreaves (1981); HU1, Hunt et al. (1998); HU2, Hunt et al. (1998); MAH, Mah
-mood & Hubbard (2002); MEV, Meza & Varas (2000); and THR, Thornton & Running (1999).
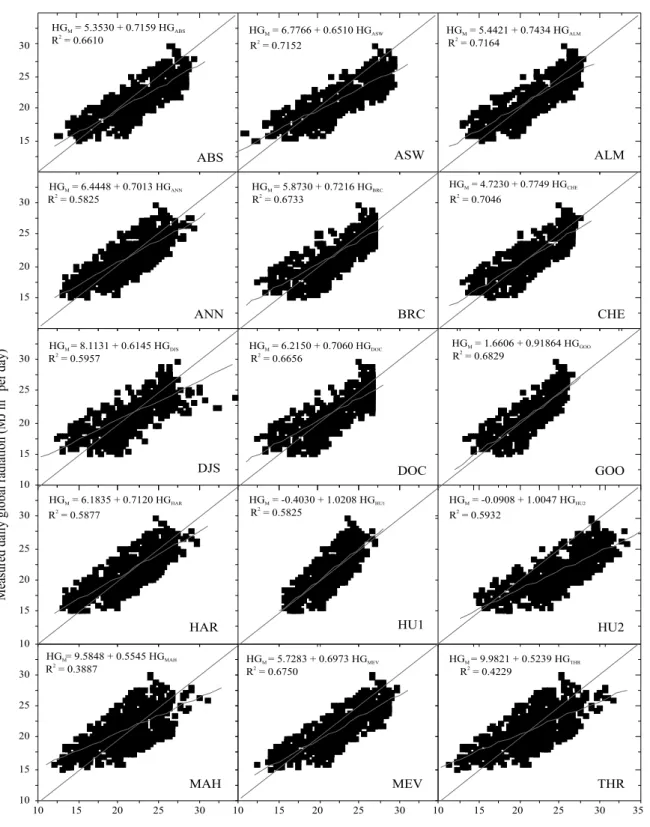
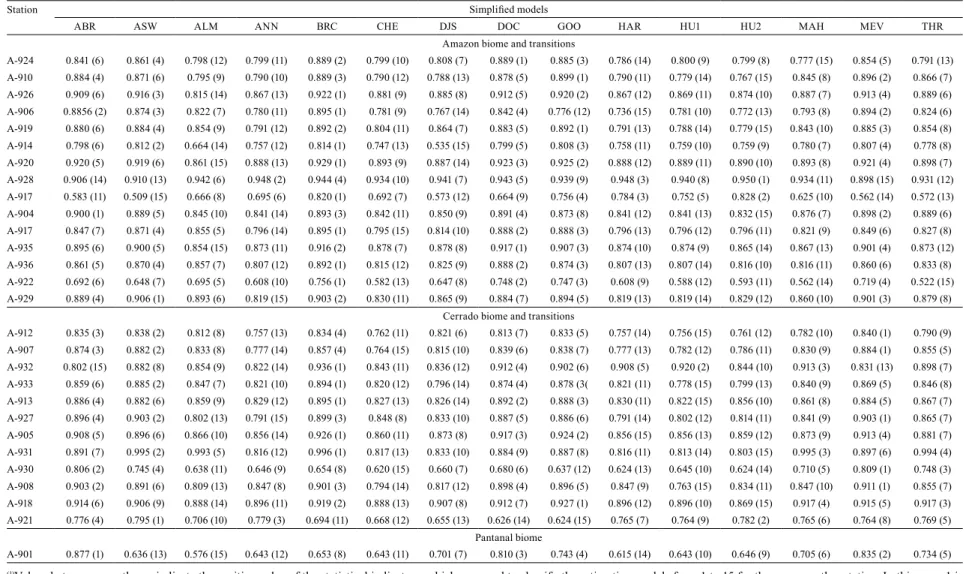
The scattering between the measured and estimated
values (RMSE) ranged from 1.52 to 4.58 MJ m-2 per
day (Table 5), with best results obtained with the BRC
and GOO models. Figure 2 shows the correlation
behavior of these two models at the weather station of
the municipality of Sinop. In this case, due to temporal
partition, these values were lower than those found
by Goodin (1999) in the United States and by Silva et
al. (2012) under the climatic conditions of the state of
Minas Gerais, but were similar to those reported by
Liu et al. (2009) and Almorox et al. (2011) under the
climatic conditions of China and Spain, respectively.
Willmott’s d index shows the accuracy degree of
the measured and estimated values, for which most
models (ASW, ALM, ANN, BRC, CHE, DJS, DOC,
GOO, HAR, HU1, and HU2) obtained satisfactory
results, with adjustment values ranging from 0.80 to
0.90 (Table 6). These results are in alignment with
those found by Silva et al. (2012) in the northwest of
Minas Gerais.
Es
tim
ate
s o
f g
lob
al r
ad
iat
ion b
y s
im
pli
fie
d m
od
els
221
Pesq. agropec. bras., Brasília, v
.52, n.4, p.215-227, abr
. 2017
DOI: 10.1590/S0100-204X2017000400001
Table 3.
Calibrated coefficients, with the best statistical performances, of the simplified models used to estimate daily global radiation (MJ m
-2per day) using
data from 28 automatic weather stations located in the state of Mato Grosso, Brazil
(1).
Station ABS ASW ANN BRC DOC GOO MEV THR
b R2 b tnc R2 a R2 a b c R2 a b c R2 a b c R2 b R2 b R2
Amazon biome and transitions
A-924 0.277 0.65 0.217 25.257 0.63 0.153 0.61 0.621 0.016 2.062 0.76 0.603 0.154 2.517 0.74 0.603 0.366 2.323 0.75 0.011 0.60 0.017 0.60 A-910 0.285 0.39 0.066 10.799 0.50 0.153 0.52 0.623 0.025 1.86 0.65 0.601 0.399 2.112 0.62 0.608 0.921 1.868 0.67 0.011 0.40 0.017 0.37 A-926 0.327 0.55 0.122 13.823 0.57 0.163 0.55 0.666 0.028 1.781 0.67 0.651 0.522 1.951 0.65 0.656 1.271 1.703 0.69 0.013 0.54 0.019 0.50 A-906 0.215 0.16 0.024 7.954 0.47 0.131 0.49 0.558 0.017 1.976 0.63 0.665 1.044 1.437 0.52 0.665 2.364 1.292 0.42 0.008 0.19 0.012 0.35 A-919 0.24 0.48 0.056 10.37 0.56 0.144 0.55 0.614 0.020 1.877 0.69 0.599 0.387 2.017 0.68 0.597 0.855 1.846 0.69 0.010 0.47 0.015 0.51 A-914 0.267 0.38 0.025 7.464 0.59 0.146 0.62 0.586 0.037 1.691 0.70 0.579 0.684 1.866 0.68 0.573 1.22 1.794 0.68 0.010 0.38 0.015 0.44 A-920 0.269 0.39 0.050 9.422 0.53 0.15 0.57 0.595 0.024 1.905 0.67 0.573 0.315 2.254 0.64 0.572 0.575 2.175 0.65 0.011 0.40 0.016 0.44 A-928 0.225 0.27 0.085 14.085 0.47 0.137 0.60 0.585 0.029 1.77 0.71 0.551 0.324 2.228 0.67 0.552 0.672 2.067 0.68 0.009 0.30 0.014 0.42 A-917 0.420 0.51 0.051 7.493 0.49 0.178 0.49 0.665 0.099 8.568 0.58 0.662 1.763 43.912 0.58 0.716 15.791 0.67 0.69 0.017 0.50 0.021 0.11 A-904 0.255 0.31 0.089 13.018 0.40 0.15 0.48 0.605 0.017 2.032 0.59 0.575 0.243 2.358 0.54 0.584 0.873 1.923 0.59 0.010 0.31 0.016 0.35 A-917 0.25 0.59 0.239 33.583 0.62 0.152 0.61 0.671 0.026 1.717 0.69 0.637 0.31 2.081 0.66 0.634 0.692 1.907 0.67 0.010 0.61 0.016 0.59 A-935 0.252 0.26 0.117 18.753 0.63 0.144 0.58 0.59 0.020 2.016 0.75 0.563 0.132 2.721 0.71 0.566 0.33 2.453 0.73 0.010 0.28 0.012 0.72 A-936 0.214 0.59 0.26 48.757 0.60 0.143 0.59 0.651 0.019 1.810 0.70 0.627 0.427 1.886 0.68 0.619 0.802 1.808 0.69 0.009 0.59 0.014 0.57 A-922 0.256 0.61 0.186 23.355 0.67 0.153 0.63 0.657 0.020 1.873 0.73 0.630 0.193 2.318 0.70 0.634 0.499 2.062 0.72 0.010 0.64 0.016 0.59
Cerrado biome and transitions
A-929 0.276 0.55 0.165 18.31 0.56 0.157 0.56 0.678 0.003 1.691 0.67 0.663 0.572 1.823 0.65 0.658 1.485 1.597 0.66 0.011 0.53 0.017 0.49 A-912 0.35 0.55 0.328 26.091 0.58 0.179 0.61 0.662 0.336 0.966 0.79 0.643 25.96 1.359 0.77 0.644 42.335 1.16 0.76 0.013 0.47 0.022 0.34 A-907 0.218 0.50 0.080 14.516 0.45 0.138 0.54 0.586 0.017 1.948 0.78 0.608 0.534 1.854 0.67 0.607 1.151 1.702 0.68 0.009 0.49 0.012 0.56 A-932 0.181 0.12 0.047 10.653 0.37 0.13 0.59 0.505 0.017 2.073 0.67 0.497 0.153 2.594 0.65 0.493 0.28 2.544 0.64 0.007 0.13 0.012 0.40 A-933 0.295 0.61 0.226 23.62 0.60 0.163 0.6 0.664 0.028 1.715 0.80 0.670 0.447 1.942 0.64 0.669 1.309 1.667 0.65 0.012 0.63 0.018 0.74 A-913 0.215 0.46 0.126 15.74 0.57 0.145 0.58 0.702 0.045 1.396 0.65 0.665 1.044 1.437 0.61 0.665 2.364 1.292 0.64 0.009 0.50 0.015 0.51 A-927 0.32 0.52 0.214 20.706 0.54 0.164 0.52 0.672 0.030 1.751 0.63 0.661 0.604 1.858 0.61 0.656 1.546 1.627 0.62 0.013 0.51 0.019 0.48 A-905 0.213 0.18 0.109 16.387 0.32 0.141 0.64 0.594 0.051 1.484 0.66 0.539 0.368 2.263 0.53 0.545 1.082 1.918 0.65 0.008 0.21 0.013 0.46 A-931 0.294 0.56 0.282 29.422 0.57 0.162 0.52 0.689 0.024 1.817 0.63 0.686 0.608 1.779 0.61 0.681 1.694 1.541 0.62 0.012 0.55 0.019 0.46 A-930 0.276 0.54 0.105 13.579 0.58 0.154 0.56 0.669 0.030 1.692 0.68 0.642 0.495 1.919 0.66 0.639 1.189 1.721 0.67 0.011 0.53 0.017 0.48 A-908 0.292 0.62 0.253 28.784 0.61 0.159 0.55 0.686 0.026 1.760 0.69 0.688 0.566 1.796 0.68 0.679 1.484 1.565 0.70 0.012 0.60 0.018 0.55 A-918 0.254 0.46 0.094 13.988 0.48 0.148 0.53 0.624 0.024 1.820 0.63 0.588 0.363 2.122 0.61 0.585 0.779 1.958 0.62 0.010 0.43 0.016 0.48 A-921 0.282 0.59 0.033 8.078 0.62 0.151 0.61 0.660 0.028 1.715 0.72 0.645 0.516 1.884 0.69 0.639 1.113 1.737 0.71 0.011 0.58 0.016 0.49
Pantanal biome
A-901 0.152 0.31 0.042 12.345 0.52 0.112 0.70 0.418 0.008 2.494 0.78 0.402 0.054 3.298 0.74 0.402 0.109 3.149 0.75 0.006 0.36 0.01 0.63
(1)
Models: ABS, Abraha & Savage (2008); ASW, Weiss et al. (2001) and Abraha & Savage (2008); ANN, Annandale et al. (2002); BRC, Bristow & Campbell (1984); DOC, Donatelli & Campbell
(1998); GOO, Goodin et al. (1999); MEV, Meza & Varas (2000); and THR, Thornton & Running (1999). a, b, and c, parametrized coefficients to be calibrated regionally; R
2, coefficient of determi
222
A
.P
. d
e S
o
u
z
a e
t a
l.
Pesq. agropec. bras., Brasília, v
.52, n.4, p.215-227, abr
. 2017
DOI: 10.1590/S0100-204X2017000400001
Table 4.
Mean bias error (MJ m
-2per day) of the daily global radiation estimated by simplified models using data from automatic weather stations located in
the state of Mato Grosso, Brazil
(1).
Station Simplified models
ABS ASW ALM ANN BRC CHE DJS DOC GOO HAR HU1 HU2 MAH MEV THR
Amazon biome and transitions
A-924 1.56 (13) 1.42 (12) 1.33 (10) 0.89 (4) 0.84 (3) 0.89 (7) 1.03 (9) 0.591 (1) 0.71 (2) 1.29 (8) 0.90 (6) 0.90 (5) 1.61 (15) 1.40 (11) 1.58 (14)
A-910 1.20 (15) 0.14 (4) 1.05 (5) 0.45 (9) 0.70 (3) 0.45 (10) 0.46 (11) 0.74 (13) 0.39 (8) 0.45 (6) 0.46 (12) 0.34 (7) 0.29 (2) 0.78 (14) 0.34 (1)
A-926 -0.51 (3) -0.92 (15) -0.12 (1) -0.68 (9) -0.63 (7) -0.14 (2) -0.88 (14) -0.77 (11) -0.69 (10) -0.68 (8) -0.59 (5) -0.54 (4) -0.78 (12) -0.62 (6) -0.85 (13)
A-906 1.46 (12) -0.70 (3) -0.33 (1) 1.19 (8) -0.57 (2) 1.14 (7) 1.36 (11) 1.52 (14) 1.27 (10) -1.08 (4) 1.08 (5) 1.93 (15) -1.11 (6) 1.47 (13) -1.27 (9)
A-919 0.11 (3) -0.15 (4) -0.05 (1) -0.43 (14) 0.26 (5) -0.35 (10) -0.31 (8) -0.38 (13) -0.29 (7) -0.43 (13) -0.57 (15) -0.40 (11) -0.34 (9) 0.119 (2) -0.28 (6)
A-914 1.06 (15) 0.42 (11) 0.46 (12) -0.01 (1) -0.09 (4) 0.09 (3) -0.19 (7) -0.04 (2) -0.19 (8) 0.11 (6) 0.10 (5) 0.26 (9) 0.30 (10) 0.96 (14) 0.53 (13)
A-920 -0.04 (1) -0.77 (15) 0.32 (5) -0.49 (12) -0.38 (6) -0.39 (7) -0.48 (10) -0.29 (3) -0.32 (4) -0.50 (11) -0.40 (8) -0.41 (9) -0.67 (13) -0.24 (2) -0.73 (14)
A-928 -4.06 (14) -3.95 (13) -1.82 (7) -1.13 (5) -2.45 (9) 0.32 (2) 0.34 (3) -2.46 (10) -2.75 (12) -1.13 (6) -0.25 (1) -1.10 (4) -2.42 (8) -4.30 (15) -2.57 (11)
A-917 2.94 (13) 3.66 (15) 2.21 (11) 1.63 (7) 0.63 (1) 1.99 (8) 2.42 (12) 2.01 (9) 1.40 (6) 0.75 (3) 0.76 (4) 0.74 (2) 1.14 (5) 3.15 (14) 2.03 (10)
A-904 0.69 (9) 1.12 (13) 1.09 (12) 0.59 (7) 0.81 (10) 0.54 (6) 1.37 (15) 0.46 (2) 0.69 (8) 0.48 (4) 0.48 (3) 1.29 (14) 0.45 (1) 0.89 (11) 0.49 (5)
A-917 -0.07 (4) -0.01 (1) 0.11 (6) -0.31 (13) -0.06 (3) -0.36 (15) 0.22 (9) -0.31 (14) -0.31 (11) -0.31 (12) -0.29 (10) 0.08 (5) -0.16 (7) -0.02 (2) -0.20 (8)
A-935 0.79 (12) 0.97 (15) 0.88 (13) -0.10 (3) 0.45 (8) 0.17 (4) 0.31 (6) 0.08 (2) 0.30 (5) -0.01 (1) 0.35 (7) 0.73 (11) 0.47 (9) 0.89 (14) 0.69 (10)
A-936 -0.69 (12) -0.46 (10) -0.07 (1) -0.24 (4) -0.36 (2) 0.35 (6) -0.41 (9) -0.74 (14) -1.12 (15) -0.24 (3) -0.26 (5) 0.11 (2) -0.46 (8) -0.72 (13) -0.47 (11)
A-922 -2.68 (8) -3.72 (13) -1.51 (4) -2.85 (11) -0.72 (2) -1.81 (5) -2.16 (6) -0.56 (1) -1.07 (3) -2.85 (10) -2.93 (12) -2.85 (9) -4.34 (14) -2.59 (7) -5.53 (15)
A-929 -1.31 (13) -0.97 (10) -0.63 (3) -0.77 (7) -0.71 (4) -0.38 (1) -0.73 (5) -0.99 (11) -0.84 (9) -0.77 (6) -0.78 (8) -0.39 (2) -1.14 (12) -1.31 (14) -1.39 (15)
Cerrado biome and transitions
A-912 -1.26 (12) -1.17 (10) -0.76 (2) -1.08 (7) -1.09 (8) -0.88 (3) -0.52 (1) -1.20 (11) -1.05 (5) -1.08 (6) -1.09 (9) -0.92 (4) -1.47 (14) -1.28 (13) -1.62 (15)
A-907 -0.61 (3) -0.54 (2) -0.65 (4) -1.07 (12) -0.84 (5) -1.25 (15) -1.17 (14) -0.99 (10) -0.98 (9) -1.07 (11) -0.97 (8) -0.91 (6) -1.08 (13) -0.48 (1) -0.95 (7)
A-932 1.21 (10) 0.21 (1) 1.39 (12) 1.03 (7) 1.02 (5) 1.52 (13) 1.67 (14) 1.06 (8) 1.34 (11) 1.21 (9) 1.03 (6) 1.75 (15) 1.04 (4) 0.41 (2) 0.58 (3)
A-933 0.08 (6) 0.03 (1) 0.14 (9) -0.04 (5) -0.10 (7) 0.64 (15) 0.39 (13) -0.36 (12) -0.34 (11) -0.04 (4) 0.03 (2) 0.43 (14) 0.17 (10) 0.03 (3) 0.13 (8)
A-913 0.45 (3) 0.71 (12) 0.88 (14) 0.69 (10) 0.71 (11) 0.79 (13) 0.66 (8) 0.54 (6) 0.45 (4) 0.69 (9) 0.97 (15) 0.64 (7) 0.20 (2) 0.48 (5) 0.12 (1)
A-927 0.16 (12) 0.06 (2) 0.53 (15) -0.08 (7) 0.07 (3) -0.22 (14) -0.11 (10) -0.08 (8) -0.05 (1) -0.08 (6) -0.10 (9) -0.07 (4) -0.12 (11) 0.18 (13) -0.07 (5)
A-905 0.12 (3) -1.17 (15) 0.04 (1) -0.69 (13) -0.37 (6) -0.29 (5) -0.53 (8) -0.37 (7) -0.23 (4) -0.69 (12) -0.64 (11) -0.62 (9) -0.71 (14) -0.08 (2) -0.63 (10)
A-931 0.40 (5) 0.64 (11) 0.79 (15) 0.45 (8) 0.58 (9) 0.64 (12) 0.76 (14) 0.32 (4) 0.12 (2) 0.45 (7) 0.75 (13) 0.63 (10) 0.06 (1) 0.43 (6) 0.17 (3)
A-930 -1.34 (8) -0.76 (1) -1.17 (4) -1.61 (11) -1.63 (12) -1.60 (10) -1.33 (7) -1.71 (14) -1.60 (9) -1.31 (6) -1.65 (13) -1.81 (15) -1.23 (5) -1.07 (2) -1.15 (3)
A-908 0.37 (6) -1.10 (13) 0.24 (4) -0.99 (11) -0.87 (10) -0.60 (8) -0.72 (9) -0.17 (3) -0.10 (1) -0.99 (12) -0.46 (7) 0.13 (2) -1.47 (15) 0.33 (5) -1.47 (14)
A-918 0.39 (5) 1.07 (12) -0.19 (2) 0.54 (9) -0.25 (3) 1.15 (14) 1.09 (13) 0.175 (1) 0.64 (10) 0.54 (8) 0.54 (7) 1.20 (15) 0.36 (4) 0.88 (11) 0.44 (6)
A-921 -0.11 (2) 0.21 (3) 1.54 (11) 0.03 (1) 1.53 (10) 1.66 (12) 1.80 (13) 1.95 (14) 2.02 (15) -0.72 (5) -0.75 (6) 0.46 (4) -0.81 (7) -1.24 (9) -0.83 (8)
Pantanal biome
A-901 0.17 (1) -3.96 (15) -2.39 (11) 1.60 (7) -2.52 (13) 1.60 (6) 2.12 (10) 0.58 (2) 1.64 (8) -2.29 (5) 1.59 (4) 1.67 (9) -2.44 (12) 1.07 (3) -2.65 (14)
(1)
Values between parentheses indicate the position value of the statistical indicators, which was used to classify the estimation models from 1 to 15 for the same weather station. In this case, 1 is
Es
tim
ate
s o
f g
lob
al r
ad
iat
ion b
y s
im
pli
fie
d m
od
els
223
Pesq. agropec. bras., Brasília, v
.52, n.4, p.215-227, abr
. 2017
DOI: 10.1590/S0100-204X2017000400001
Table 5.
Root mean square error (MJ m
-2per day) of the daily global radiation estimated by simplified models using data from automatic weather stations
located in the state of Mato Grosso, Brazil
(1).
Station Simplified models
ABR ASW ALM ANN BRC CHE DJS DOC GOO HAR HU1 HU2 MAH MEV THR
Amazon biome and transitions
A-924 3.23 (13) 3.00 (10) 3.12 (11) 2.78 (7) 2.31 (2) 2.78 (4) 2.99 (9) 2.34 (1) 2.35 (3) 2.94 (8) 2.78 (5) 2.78 (6) 3.49 (14) 3.16 (12) 3.65 (15)
A-910 2.99 (11) 3.07 (15) 3.06 (14) 2.97 (9) 2.56 (2) 2.97 (8) 2.98 (10) 2.68 (3) 2.40 (1) 2.97 (7) 2.99 (12) 3.01 (13) 2.82 (4) 2.85 (5) 2.86 (6)
A-926 2.72 (13) 2.60 (6) 4.34 (15) 2.62 (8) 2.28 (2) 2.51 (5) 2.63 (10) 2.42 (3) 2.18 (1) 2.62 (8) 2.60 (6) 2.50 (4) 2.68 (11) 2.71 (12) 2.87 (14)
A-906 3.13 (10) 2.58 (2) 3.02 (7) 3.45 (14) 2.55 (1) 3.43 (13) 2.98 (6) 3.33 (11) 2.97 (5) 3.08 (9) 3.42 (12) 3.71 (15) 2.85 (4) 3.07 (8) 2.80 (3)
A-919 2.76 (9) 2.66 (5) 2.94 (15) 2.76 (11) 2.29 (2) 2.71 (7) 2.60 (4) 2.34 (3) 2.20 (1) 2.76 (10) 2.79 (8) 2.82 (13) 2.67 (6) 2.77 (12) 2.83 (14)
A-914 2.74 (13) 2.64 (11) 4.23 (8) 2.21 (4) 2.10 (1) 2.23 (7) 2.75 (15) 2.19 (3) 2.13 (2) 2.21 (6) 2.21 (5) 2.24 (9) 2.39 (10) 2.74 (14) 2.67 (12)
A-920 3.03 (4) 3.04 (5) 4.30 (15) 3.11 (10) 2.63 (1) 3.07 (7) 3.12 (12) 2.74 (3) 2.66 (2) 3.11 (9) 3.10 (8) 3.12 (11) 3.17 (13) 3.06 (6) 3.27 (14)
A-928 4.38 (14) 4.32 (13) 3.48 (10) 2.83 (2) 3.44 (9) 2.99 (6) 2.96 (5) 3.54 (12) 3.59 (11) 2.83 (3) 2.81 (1) 2.92 (4) 3.30 (8) 4.58 (15) 3.23 (7)
A-917 3.18 (12) 3.85 (15) 2.40 (8) 2.13 (6) 1.55 (3) 2.21 (7) 3.27 (13) 2.45 (10) 1.66 (5) 1.58 (4) 1.47 (2) 1.25 (1) 2.43 (9) 3.40 (14) 3.09 (11)
A-904 2.88 (5) 3.06 (12) 3.58 (15) 2.94 (10) 2.73 (2) 2.93 (9) 3.09 (13) 2.71 (1) 2.83 (4) 2.92 (8) 2.92 (7) 3.16 (14) 2.82 (3) 2.97 (11) 2.88 (6)
A-917 2.99 (14) 2.76 (11) 2.81 (12) 2.62 (8) 2.20(1) 2.63 (9) 2.58 (4) 2.25 (3) 2.21 (2) 2.62 (7) 2.62 (6) 2.60 (5) 2.70 (10) 3.06 (15) 2.91 (13)
A-935 2.82 (10) 2.84 (12) 3.59 (15) 2.72 (6) 2.40 (3) 2.72 (4) 2.77 (8) 2.38 (1) 2.39 (2) 2.72 (5) 2.75 (7) 2.81 (9) 2.95 (13) 2.83 (11) 3.07 (14)
A-936 3.60 (13) 3.54 (12) 3.50 (10) 3.20 (7) 2.88 (1) 3.18 (5) 3.26 (9) 2.97 (2) 3.16 (4) 3.20 (6) 3.21 (8) 3.16 (3) 3.52 (11) 3.74 (15) 3.66 (14)
A-922 3.54 (8) 4.30 (13) 2.73 (4) 3.73 (9) 2.33 (1) 3.17 (5) 3.19 (6) 2.33 (2) 2.46 (3) 3.73 (10) 3.84 (12) 3.77 (11) 4.91 (14) 3.40 (7) 5.95 (15)
A-929 3.15 (10) 2.95 (4) 2.97 (5) 3.29 (14) 2.80 (2) 3.20 (11) 2.95 (3) 2.98 (6) 2.79 (1) 3.29 (13) 3.29 (15) 3.27 (12) 3.04 (8) 3.06 (9) 3.04 (7)
Cerrado biome and transitions
A-912 3.65 (11) 3.58 (10) 3.81 (14) 3.50 (8) 3.20 (2) 3.44 (5) 3.27 (4) 3.25 (3) 2.96 (1) 3.50 (7) 3.50 (9) 3.49 (6) 3.68 (13) 3.66 (12) 3.93 (15)
A-907 2.74 (4) 2.70 (1) 3.25 (15) 3.05 (13) 2.72 (3) 3.14 (14) 2.92 (9) 2.86 (7) 2.77 (5) 3.05 (12) 3.02 (11) 2.94 (10) 2.88 (8) 2.70 (2) 2.85 (6)
A-932 3.42 (15) 2.44 (13) 2.40 (12) 2.38 (11) 1.52 (2) 2.03 (8) 2.13 (10) 1.85 (5) 1.85 (6) 1.63 (3) 1.50 (1) 2.04 (9) 1.75 (4) 3.10 (14) 2.01 (7)
A-933 3.01 (14) 2.73 (9) 3.13 (15) 2.62 (5) 2.34 (1) 2.69 (7) 2.81 (11) 2.51 (3) 2.38 (2) 2.63 (4) 2.72 (8) 2.66 (6) 2.76 (10) 2.99 (13) 2.95 (12)
A-913 3.02 (11) 3.10 (13) 3.22 (15) 2.86 (6) 2.65 (3) 2.89 (9) 2.87 (7) 2.63 (2) 2.62 (1) 2.86 (5) 2.94 (10) 2.84 (4) 2.87 (8) 3.14 (14) 3.05 (12)
A-927 2.71 (6) 2.67 (4) 4.26 (15) 3.11 (13) 2.52 (1) 2.88 (7) 2.99 (10) 2.60 (3) 2.54 (2) 3.11 (12) 3.09 (11) 3.13 (14) 2.95 (9) 2.71 (5) 2.94 (8)
A-905 3.13 (6) 3.41 (14) 3.89 (15) 3.19 (10) 2.60 (2) 3.14 (7) 3.09 (4) 2.72 (3) 2.55 (1) 3.19 (9) 3.18 (8) 3.20 (11) 3.24 (12) 3.11 (5) 3.36 (13)
A-931 3.01 (5) 2.97 (4) 3.43 (15) 3.07 (9) 2.75 (2) 3.08 (11) 3.07 (10) 2.80 (3) 2.68 (1) 3.07 (8) 3.12 (13) 3.13 (14) 3.05 (7) 3.01 (6) 3.10 (12)
A-930 3.26 (5) 3.34 (6) 4.25 (15) 3.66 (10) 3.54 (8) 3.75 (12) 3.25 (4) 3.82 (13) 3.62 (9) 3.35 (7) 3.67 (11) 3.85 (14) 3.05 (3) 3.01 (1) 3.04 (2)
A-908 2.52 (4) 2.81 (11) 3.78 (15) 2.65 (8) 2.32 (3) 2.89 (13) 2.77 (9) 2.26 (2) 2.23 (1) 2.65 (7) 2.80 (10) 2.61 (6) 2.86 (12) 2.54 (5) 2.99 (14)
A-918 3.24 (10) 3.51 (13) 3.67 (15) 3.16 (8) 2.93 (2) 3.36 (12) 3.20 (9) 3.09 (4) 2.62 (1) 3.17 (7) 3.16 (6) 3.58 (14) 2.94 (3) 3.32 (11) 3.12 (5)
A-921 3.17 (6) 3.20 (7) 3.70 (10) 2.99 (1) 3.73 (11) 3.91 (12) 4.03 (13) 4.28 (14) 4.31 (15) 3.03 (3) 3.04 (4) 3.01 (2) 3.10 (5) 3.45 (9) 3.28 (8)
Pantanal biome
A-901 2.67 (1) 5.26 (14) 5.91 (15) 3.68 (7) 4.33 (13) 3.68 (6) 3.75 (11) 2.76 (2) 3.30 (4) 4.02 (12) 3.67 (5) 3.71 (9) 3.70 (8) 3.17 (3) 3.74 (10)
(1)
Values between parentheses indicate the position value of the statistical indicators, which was used to classify the estimation models from 1 to 15 for the same weather station. In this case, 1 is
224
A.P. de Souza et al.
Pesq. agropec. bras., Brasília, v.52, n.4, p.215-227, abr. 2017
DOI: 10.1590/S0100-204X2017000400001
Figure 2.
Correlations between the daily global radiation (HG) measured and estimated by simplified models using data
from the automatic weather station A-917 of the municipality of Sinop, located in the Amazon biome, in the state of Mato
Grosso, Brazil. Models: ABS, Abraha & Savage (2008); ASW, Weiss et al. (2001) and Abraha & Savage (2008); ALM,
Almorox et al. (2011); ANN, Annandale et al. (2002); BRC, Bristow & Campbell (1984); CHE, Chen et al. (2004); DJS, De
Jong & Stewart (1993); DOC, Donatelli & Campbell (1998); GOO, Goodin et al. (1999); HAR, Hargreaves (1981); HU1,
Hunt et al. (1998); HU2, Hunt et al. (1998); MAH, Mahmood & Hubbard (2002); MEV, Meza & Varas (2000); and THR,
Thornton & Running (1999).
15 20 25 30
15 20 25 30
10 15 20 25 30
10 15 20 25 30
10 15 20 25 30 10
15 20 25 30
10 15 20 25 30 10 15 20 25 30 35
HG = 5.3530 + 0.7159 HGM ABS
R = 0.66102
ABS
HG = 6.7766 + 0.6510 HM GASW
R = 0.71522
ASW
HG = 5.4421 + 0.7434 HGM ALM
R = 0.71642
ALM
HG = 6.4448 + 0.7013M HGANN
R = 0.58252
ANN
HGM= 5.8730 + 0.7216HGBRC
R = 0.67332
BRC
HG = 4.7230 + 0.7749 HGM CHE
R = 0.70462
CHE
HGM= 8.1131 + 0.6145 HGDJS
R = 0.59572
DJS
HG = 6.2150 + 0.7060M HGDOC
R = 0.66562
DOC
HG = 1.6606 + 0.91864M HGGOO
R = 0.68292
GOO
HG = 6.1835 + 0.7120M HGHAR
R = 0.58772
HAR
Measured daily global radiation (MJ
m
per day)
-2
HG = -0.4030 + 1.0208 HM GHU1
R = 0.58252
HU1
HG = -0.0908 + 1.0047 HGM HU2
R = 0.59322
HU2
HGM= 9.5848 + 0.5545 HGMAH
R = 0.38872
MAH
HGM= 5.7283 + 0.6973 HGMEV
R = 0.67502
Estimated daily global radiation (MJ m per day)
-2MEV
HGM= 9.9821 + 0.5239 HGTHR
R = 0.42292
Es
tim
ate
s o
f g
lob
al r
ad
iat
ion b
y s
im
pli
fie
d m
od
els
225
Pesq. agropec. bras., Brasília, v
.52, n.4, p.215-227, abr
. 2017
DOI: 10.1590/S0100-204X2017000400001
Table 6.
Adjustment index (d) of the daily global radiation estimated by simplified models using data from automatic weather stations located in the state of
Mato Grosso, Brazil
(1).
Station Simplified models
ABR ASW ALM ANN BRC CHE DJS DOC GOO HAR HU1 HU2 MAH MEV THR
Amazon biome and transitions
A-924 0.841 (6) 0.861 (4) 0.798 (12) 0.799 (11) 0.889 (2) 0.799 (10) 0.808 (7) 0.889 (1) 0.885 (3) 0.786 (14) 0.800 (9) 0.799 (8) 0.777 (15) 0.854 (5) 0.791 (13) A-910 0.884 (4) 0.871 (6) 0.795 (9) 0.790 (10) 0.889 (3) 0.790 (12) 0.788 (13) 0.878 (5) 0.899 (1) 0.790 (11) 0.779 (14) 0.767 (15) 0.845 (8) 0.896 (2) 0.866 (7) A-926 0.909 (6) 0.916 (3) 0.815 (14) 0.867 (13) 0.922 (1) 0.881 (9) 0.885 (8) 0.912 (5) 0.920 (2) 0.867 (12) 0.869 (11) 0.874 (10) 0.887 (7) 0.913 (4) 0.889 (6) A-906 0.8856 (2) 0.874 (3) 0.822 (7) 0.780 (11) 0.895 (1) 0.781 (9) 0.767 (14) 0.842 (4) 0.776 (12) 0.736 (15) 0.781 (10) 0.772 (13) 0.793 (8) 0.894 (2) 0.824 (6) A-919 0.880 (6) 0.884 (4) 0.854 (9) 0.791 (12) 0.892 (2) 0.804 (11) 0.864 (7) 0.883 (5) 0.892 (1) 0.791 (13) 0.788 (14) 0.779 (15) 0.843 (10) 0.885 (3) 0.854 (8) A-914 0.798 (6) 0.812 (2) 0.664 (14) 0.757 (12) 0.814 (1) 0.747 (13) 0.535 (15) 0.799 (5) 0.808 (3) 0.758 (11) 0.759 (10) 0.759 (9) 0.780 (7) 0.807 (4) 0.778 (8) A-920 0.920 (5) 0.919 (6) 0.861 (15) 0.888 (13) 0.929 (1) 0.893 (9) 0.887 (14) 0.923 (3) 0.925 (2) 0.888 (12) 0.889 (11) 0.890 (10) 0.893 (8) 0.921 (4) 0.898 (7) A-928 0.906 (14) 0.910 (13) 0.942 (6) 0.948 (2) 0.944 (4) 0.934 (10) 0.941 (7) 0.943 (5) 0.939 (9) 0.948 (3) 0.940 (8) 0.950 (1) 0.934 (11) 0.898 (15) 0.931 (12) A-917 0.583 (11) 0.509 (15) 0.666 (8) 0.695 (6) 0.820 (1) 0.692 (7) 0.573 (12) 0.664 (9) 0.756 (4) 0.784 (3) 0.752 (5) 0.828 (2) 0.625 (10) 0.562 (14) 0.572 (13) A-904 0.900 (1) 0.889 (5) 0.845 (10) 0.841 (14) 0.893 (3) 0.842 (11) 0.850 (9) 0.891 (4) 0.873 (8) 0.841 (12) 0.841 (13) 0.832 (15) 0.876 (7) 0.898 (2) 0.889 (6) A-917 0.847 (7) 0.871 (4) 0.855 (5) 0.796 (14) 0.895 (1) 0.795 (15) 0.814 (10) 0.888 (2) 0.888 (3) 0.796 (13) 0.796 (12) 0.796 (11) 0.821 (9) 0.849 (6) 0.827 (8) A-935 0.895 (6) 0.900 (5) 0.854 (15) 0.873 (11) 0.916 (2) 0.878 (7) 0.878 (8) 0.917 (1) 0.907 (3) 0.874 (10) 0.874 (9) 0.865 (14) 0.867 (13) 0.901 (4) 0.873 (12) A-936 0.861 (5) 0.870 (4) 0.857 (7) 0.807 (12) 0.892 (1) 0.815 (12) 0.825 (9) 0.888 (2) 0.874 (3) 0.807 (13) 0.807 (14) 0.816 (10) 0.816 (11) 0.860 (6) 0.833 (8) A-922 0.692 (6) 0.648 (7) 0.695 (5) 0.608 (10) 0.756 (1) 0.582 (13) 0.647 (8) 0.748 (2) 0.747 (3) 0.608 (9) 0.588 (12) 0.593 (11) 0.562 (14) 0.719 (4) 0.522 (15) A-929 0.889 (4) 0.906 (1) 0.893 (6) 0.819 (15) 0.903 (2) 0.830 (11) 0.865 (9) 0.884 (7) 0.894 (5) 0.819 (13) 0.819 (14) 0.829 (12) 0.860 (10) 0.901 (3) 0.879 (8)
Cerrado biome and transitions
A-912 0.835 (3) 0.838 (2) 0.812 (8) 0.757 (13) 0.834 (4) 0.762 (11) 0.821 (6) 0.813 (7) 0.833 (5) 0.757 (14) 0.756 (15) 0.761 (12) 0.782 (10) 0.840 (1) 0.790 (9) A-907 0.874 (3) 0.882 (2) 0.833 (8) 0.777 (14) 0.857 (4) 0.764 (15) 0.815 (10) 0.839 (6) 0.838 (7) 0.777 (13) 0.782 (12) 0.786 (11) 0.830 (9) 0.884 (1) 0.855 (5) A-932 0.802 (15) 0.882 (8) 0.854 (9) 0.822 (14) 0.936 (1) 0.843 (11) 0.836 (12) 0.912 (4) 0.902 (6) 0.908 (5) 0.920 (2) 0.844 (10) 0.913 (3) 0.831 (13) 0.898 (7) A-933 0.859 (6) 0.885 (2) 0.847 (7) 0.821 (10) 0.894 (1) 0.820 (12) 0.796 (14) 0.874 (4) 0.878 (3( 0.821 (11) 0.778 (15) 0.799 (13) 0.840 (9) 0.869 (5) 0.846 (8) A-913 0.886 (4) 0.882 (6) 0.859 (9) 0.829 (12) 0.895 (1) 0.827 (13) 0.826 (14) 0.892 (2) 0.888 (3) 0.830 (11) 0.822 (15) 0.856 (10) 0.861 (8) 0.884 (5) 0.867 (7) A-927 0.896 (4) 0.903 (2) 0.802 (13) 0.791 (15) 0.899 (3) 0.848 (8) 0.833 (10) 0.887 (5) 0.886 (6) 0.791 (14) 0.802 (12) 0.814 (11) 0.841 (9) 0.903 (1) 0.865 (7) A-905 0.908 (5) 0.896 (6) 0.866 (10) 0.856 (14) 0.926 (1) 0.860 (11) 0.873 (8) 0.917 (3) 0.924 (2) 0.856 (15) 0.856 (13) 0.859 (12) 0.873 (9) 0.913 (4) 0.881 (7) A-931 0.891 (7) 0.995 (2) 0.993 (5) 0.816 (12) 0.996 (1) 0.817 (13) 0.833 (10) 0.884 (9) 0.887 (8) 0.816 (11) 0.813 (14) 0.803 (15) 0.995 (3) 0.897 (6) 0.994 (4) A-930 0.806 (2) 0.745 (4) 0.638 (11) 0.646 (9) 0.654 (8) 0.620 (15) 0.660 (7) 0.680 (6) 0.637 (12) 0.624 (13) 0.645 (10) 0.624 (14) 0.710 (5) 0.809 (1) 0.748 (3) A-908 0.903 (2) 0.891 (6) 0.809 (13) 0.847 (8) 0.901 (3) 0.794 (14) 0.817 (12) 0.898 (4) 0.896 (5) 0.847 (9) 0.763 (15) 0.834 (11) 0.847 (10) 0.911 (1) 0.855 (7) A-918 0.914 (6) 0.906 (9) 0.888 (14) 0.896 (11) 0.919 (2) 0.888 (13) 0.907 (8) 0.912 (7) 0.927 (1) 0.896 (12) 0.896 (10) 0.869 (15) 0.917 (4) 0.915 (5) 0.917 (3) A-921 0.776 (4) 0.795 (1) 0.706 (10) 0.779 (3) 0.694 (11) 0.668 (12) 0.655 (13) 0.626 (14) 0.624 (15) 0.765 (7) 0.764 (9) 0.782 (2) 0.765 (6) 0.764 (8) 0.769 (5)
Pantanal biome
A-901 0.877 (1) 0.636 (13) 0.576 (15) 0.643 (12) 0.653 (8) 0.643 (11) 0.701 (7) 0.810 (3) 0.743 (4) 0.615 (14) 0.643 (10) 0.646 (9) 0.705 (6) 0.835 (2) 0.734 (5)
(1)