Segmentation of the buffalo meat consumer market in Belém, Pará, Brazil
Cristiane Soares Simon Marques1, Ricardo Pedroso Oaigen2, Carina Martins de Moraes3, Marcos Antônio Souza dos Santos4, José de Brito Lourenço Júnior1, Isis Abel3 1 Universidade Federal do Pará, Programa de Pós-graduação em Ciência Animal, Belém, PA, Brazil.
2 Universidade Federal do Pampa, Uruguaiana, RS, Brazil.
3 Universidade Federal do Pará, Programa de Pós-graduação em Saúde Animal na Amazônia, Castanhal, PA, Brazil. 4 Universidade Federal Rural da Amazonas, Instituto Socioambiental e dos Recursos Hídricos, Belém, PA, Brazil.
ABSTRACT - The objective of this study was to identify different market segments for buffalo meat with target groups defined in the city of Belém, Pará, Brazil. Paired samples of beef and buffalo meat were given to 447 volunteers, and a sensory analysis of the products was conducted. After the tasting, a questionnaire was administered to obtain demographic (age, educational level, marital status) and economic (household income) data as well as information on the habits of respondents and preferences regarding buffalo meat. The factors were estimated using the principal components method and the factors with characteristic roots greater than one were extracted. To check the suitability of the factorial model, Bartlett’s sphericity test and the Kaiser-Meyer-Olkin (KMO) test were used. A factor analysis was performed, identifying five factors with common variability dimensions. The study has helped identify four distinct market segments which, combined with a targeted marketing strategy, can be used to leverage the productive chain: I - Young and interested, II - Mixed and indifferent, III - Graduates and successful, and IV - Healthy women. All had positive responses to buffalo meat; clusters I and III stood out with regard to several indicators, especially those related to the preference for buffalo meat and the predisposition to purchase and include it in meals. The sensory analysis indicated that consumers showed a greater acceptance of buffalo meat based on the characteristics of flavour, colour, succulence and tenderness. The study helps to identify market segments with distinct features that, combined with a targeted marketing strategy, can be used to leverage the supply chain
Key Words: buffalo meat, cluster analysis, consumers
ISSN 1806-9290
www.sbz.org.br R. Bras. Zootec., 45(6):336-344, 2016
Received October 16, 2015 and accepted March 28, 2016. Corresponding author: [email protected] http://dx.doi.org/10.1590/S1806-92902016000600008
Copyright © 2016 Sociedade Brasileira de Zootecnia. This is an Open Access article distributed under the terms of the Creative Commons Attribution License (http://creativecommons.org/licenses/by/4.0/), which permits unrestricted use, distribution, and reproduction in any medium, provided the original work is properly cited.
Introduction
Buffalo farming is a traditional activity in the state of Pará, which currently contains approximately 36% of the total buffalo population in Brazil, representing the largest herd in the country. The main purpose of this activity is the production of meat, which is becoming an important alternative source of animal protein for the population (Bernardes, 2007).
Buffalo meat has excellent sensory quality and acknowledged nutritional and functional characteristics. However, failure to identify the potential uses of this product has limited the ability of farmers to transform these advantages into greater profitability; in some regions, this contributes to a slower pace of expansion of this activity despite the existing market potential (Silva and Nardi Junior, 2014).
The development of this activity has also been hampered by information asymmetries among the links that make up the production chain because statistics on buffalo meat consumption are scarce and usually consolidated with data on beef (Bernardes, 2007).
According to Bernués et al. (2012) and Trienekens et al. (2012), understanding consumer behaviour has become an important strategic consideration. Knowledge about what consumers want and their opinions about a product and the subsequent dissemination of this information along the chain represents a competitive advantage for agribusiness systems because it allows for production coordination and the ability to offer retail consumers exactly what they expect. Market segmentation is a tool used to study the differences among consumers to stratify the market into meaningful homogeneous groups (segments or niches). Marketing analyses currently combine many variables in an attempt to identify the target groups that are most representative of consumers. Thus, market segmentation is essential for marketing policies, guiding the choice of well-defined segments to design competitive strategies (Bernués et al., 2012; Onwezen et al., 2012).
defined starting the characteristics of consumers and potential consumers in the city of Belem, state of Pará, Brazil.
Material and Methods
This study was previously submitted to and approved by the Ethics Committee of Universidade Federal do Pará, according to Resolution No. 196/96 of the National Health Council (Conselho Nacional de Saúde), through the Ethics Committee for Research with Humans. The study was certified under CAAE protocol no. 12593313.4.0000.0018 and review no. 354.570.
An exploratory and descriptive survey was conducted (Hill and Hill, 2012; Malhotra, 2012) in Belém, Pará, in the Brazilian Amazon. Sensory analysis was conducted, followed by interviews with randomly selected individuals, including consumers and non-consumers of buffalo meat. The tests were conducted in four different districts of the city, at supermarket entrances. Supermarkets were chosen because, as described by Behrens et al. (2010), they are the places where red meat is most frequently purchased.
To ensure sample representativeness and distribution homogeneity, the sample size was defined by estimating proportions of the population with a sample degree of confidence of 95% (Z = standard deviation of 1.96) and a margin of error of 5%, according to equation n = (Z2
α/2.p.q)/E2, in which Z2
α/2 is the desired degree of confidence, p is the proportion of the population belonging to the category under study, q is the proportion of the population not belonging to the category of interest in the study (q = 1 − p), n is the number of individuals in the sample, and E is the margin of error or maximum estimation error (Malhotra, 2012).
Based on the current population of the city of Belém, Pará, the calculation of the sample size showed that the minimum number of samples to be collected should be 383 questionnaires. A total of 447 questionnaires were administered to ensure the necessary safety margin for the taste tests. The sample included both consumers of buffalo meat and potential consumers (people who do not yet consume this product).
The affective sensory method was used to obtain data relating to the acceptance of buffalo meat based on a paired comparison test between beef and buffalo (Minin, 2012). The following meat cuts were used: lower round, sirloin, and tenderloin, all of which were acquired at a slaughterhouse licensed by the Brazilian Federal Inspection Service (Serviço de Inspeção Federal do Brasil - SIF). The slaughtered animals (cattle and buffalo) were approximately 25 months old, as measured by the Animal
Transit Guide (Guia de Trânsito Animal - GTA) and the dental records of the animals, which were raised in similar production systems, with access to Brachiaria brizantha
and Panicum maximum pastures. Half of the carcasses were
kept in chambers refrigerated to approximately 5 °C for 24 h; after boning, the sample cuts were stored at approximately −12 °C (Jo et al., 2014; Lee et al., 2015).
The meat cuts were required to obtain a negative result in a microbiological test for Salmonella prior to the start of the activities. The cuts were thawed 24 h prior to the planned test administration date. For the tastings, the sections were portioned into pieces approximately 0.6 cm in height and weighing 25 g and seasoned with salt at a ratio of 10 g/kg. These samples were then cooked at 230 °C for seven minutes (3.5 min for each side) on two independent electrical grills, one for each type of meat. This equipment had a thermostat for temperature control.
The sensory analysis was conducted in the second half of 2013, from 9.00 to 11.00 h and 14.00 to 17.00 h. The two samples were randomly offered to consumers and identified using only three non-sequential numbers: 254 for buffalo and 681 for beef. Participants were given a glass of water to drink in the interval between the first and second tastings (Minin, 2012).
After the tasting, the respondent answered a questionnaire about their perceptions of the sensory attributes of flavour, colour, tenderness, and succulence, as well as their willingness to purchase the evaluated meats (Hill and Hill, 2012; Minin, 2012). Consumers had not been previously trained. For this reason, the questionnaire was designed with a five-point Hedonic scale for each attribute (1 - Liked a lot; 2 - Liked moderately; 3 - Neither liked nor disliked; 4 - Disliked moderately; and 5 - Disliked a lot). At the end of each tasting, a questionnaire was administered to evaluate purchase intention using five options (1 - Would certainly buy; 2 - Would possibly buy; 3 - May or may not buy; 4 - Possibly would not buy; and 5 - Certainly would not buy).
based on gender, age, household income, educational level, marital status, and smoking status. The remaining questions were directed to individuals with and without the habit of consuming buffalo meat (consumers and potential consumers) and covered the following aspects: a) behaviour of buffalo meat consumers and potential consumers with regard to their consumption preferences and habits; b) cultural and social characteristics; c) demographic factors and their influence on consumption; and d) knowledge of, appreciation of, and factors limiting buffalo meat consumption.
The questions were objective and multiple-choice, with some being semi-open (Hill and Hill, 2012). A pre-test was conducted with students at Universidade Federal do Pará, in Castanhal, state of Pará, to check the understanding of the questionnaire.
Data were analysed using two multivariate analysis techniques. Initially, factor analysis was conducted to identify common dimensions of variability between variables. This technique assumes that correlations between variables arise because they are related to the same factor. The objective is to identify factors that are not directly observable based on the correlation between a set of variables that are observable and subject to measurement (Malhotra, 2012).
The factors were estimated using the principal components method and the factors with characteristic roots greater than one were extracted. To check the suitability of the factorial model, Bartlett’s sphericity test and the Kaiser-Meyer-Olkin (KMO) test were used. The former tests the hypothesis that the correlation matrix is an identity matrix,
i.e., its determinant is equal to one and all other values are zero (this means that there is no correlation between the variables). The latter evaluates the input value of the variables in the model, which can vary between zero and one (Johnson and Wichern, 2007).
Cluster analysis was also used to classify objects or cases into relatively homogeneous groups, with the objects in each cluster being similar to each other but different to the objects in the other clusters (Malhotra, 2012). To define the clusters, we used the scores obtained in the factor analysis, using the Ward method based on the square of the Euclidean distance. All statistical procedures were performed on IBM SPSS© version 20.0.
Results and Discussion
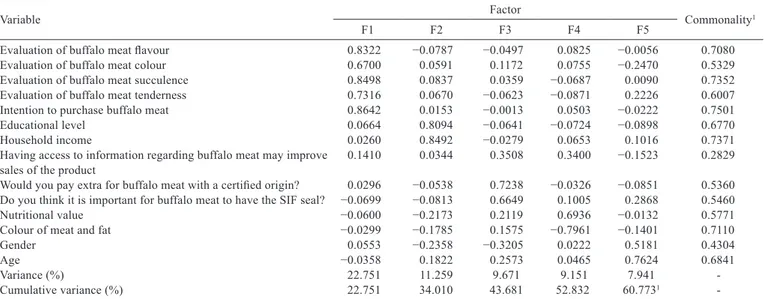
The use of factor analysis enabled the estimation of five factors with characteristic roots greater than one, which explained 60.77% of the total variance of the data. Bartlett’s test was significant at 1%, rejecting the null hypothesis that the correlation matrix is an identity matrix. The KMO test showed a value of 0.760, indicating that the sample data are suitable for factor analysis (Table 1) (F1: Sensory association of buffalo meat; F2: Educational level and household income; F3: Access to information, origin, and quality control of meat; F4: Nutritional value and colour of the meat and fat; and F5: Gender and age).
Factor 1, sensory association of buffalo meat, explained the greatest portion of the total variance (22.75%) and is positively associated with the variables related to consumer
Table 1 - Factor loadings after orthogonal rotation and corresponding commonalities
Variable Factor Commonality1
F1 F2 F3 F4 F5
Evaluation of buffalo meat flavour 0.8322 −0.0787 −0.0497 0.0825 −0.0056 0.7080
Evaluation of buffalo meat colour 0.6700 0.0591 0.1172 0.0755 −0.2470 0.5329
Evaluation of buffalo meat succulence 0.8498 0.0837 0.0359 −0.0687 0.0090 0.7352
Evaluation of buffalo meat tenderness 0.7316 0.0670 −0.0623 −0.0871 0.2226 0.6007
Intention to purchase buffalo meat 0.8642 0.0153 −0.0013 0.0503 −0.0222 0.7501
Educational level 0.0664 0.8094 −0.0641 −0.0724 −0.0898 0.6770
Household income 0.0260 0.8492 −0.0279 0.0653 0.1016 0.7371
Having access to information regarding buffalo meat may improve 0.1410 0.0344 0.3508 0.3400 −0.1523 0.2829 sales of the product
Would you pay extra for buffalo meat with a certified origin? 0.0296 −0.0538 0.7238 −0.0326 −0.0851 0.5360 Do you think it is important for buffalo meat to have the SIF seal? −0.0699 −0.0813 0.6649 0.1005 0.2868 0.5460
Nutritional value −0.0600 −0.2173 0.2119 0.6936 −0.0132 0.5771
Colour of meat and fat −0.0299 −0.1785 0.1575 −0.7961 −0.1401 0.7110
Gender 0.0553 −0.2358 −0.3205 0.0222 0.5181 0.4304
Age −0.0358 0.1822 0.2573 0.0465 0.7624 0.6841
Variance (%) 22.751 11.259 9.671 9.151 7.941
-Cumulative variance (%) 22.751 34.010 43.681 52.832 60.7731
-Factors with the greatest loadings per variable are in bold. Bartlett’s sphericity test = 1,277.866 (P<0.01) and KMO = 0.760.
F1 - sensory association of buffalo meat; F2 - educational level and household income; F3 - access to information, origin and quality control of meat; F4 - nutritional value and colour of the meat and fat; F5 - gender and age; SIF - Brazilian Federal Inspection Service.
satisfaction with meat attributes, such as X1 (assessment of flavour), X2 (assessment of colour), X3 (assessment of succulence), X4 (assessment of tenderness), and X5 (intention to purchase buffalo meat). According to Iannario et al. (2012), sensory analysis of food products is important because it provides fundamental guidelines for their production and marketing with regard to consumer preferences and demands.
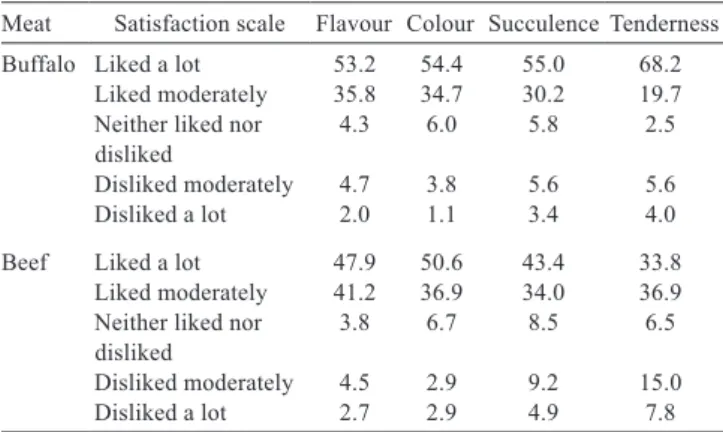
The association of these variables with a single factor is justified by the fact that they are perceptible and fundamental characteristics in determining the sensory quality of food (Banovic et al., 2009; Verbeke et al., 2010). The outcome of the sensory analysis based on the Hedonic Scale showed that most consumers chose “Liked a lot” for buffalo meat and “Liked moderately” for beef; however, there was no central tendency among opinions, which is indicative of the potential to include buffalo meat in the market as a substitute for beef (Table 2).
The second factor, educational level and household income, accounted for 11.25% of the total variance and is related to the variables X6 (educational level) and X7 (household income). Educational level and household income are important demographic characteristics that affect the acquisition and acceptance of foods (Banovic et al., 2012). Banovic et al. (2012) observed that as the educational levels of consumers increase, the frequency of beef consumption decreases significantly. In turn, Brisola and Castro (2005) found that consumer demands increase with educational level because better-educated consumers select their preferred cuts and purchasing locations and are generally predisposed to pay more for the products they purchase.
The third factor, access to information on the origin and quality control of meat, explained 9.67% of the total variance. This factor is positively related to the following variables: X8 (access to information about buffalo meat
may favour the purchase of this product), X9 (willingness to pay more for buffalo meat with a certified origin), and X10 (consider it important for buffalo meat to have the SIF seal). These factors indicate the importance of information in purchase-related decision making because consumers often seek information stored in their memories as well as from the external environment (Rutsaert et al., 2005). According to McGloin et al. (2009), communication related to food must be clear and easy to understand to produce better results.
With regard to product certification, the data support the statements of Brandão et al. (2012) in their study on increased demand for products with certified geographical origins. According to these authors, consumers consider the geographical origin of meat to be an indicator of quality and are willing to pay more for meat possessing this differentiation. In addition to perceived quality, consumers believe that this type of certification confers greater security and confidence to the product.
The fourth factor, nutritional value and colour of the meat and fat, explained 9.15% of the total variance, relating to the variables X11 (nutritional value) and X12 (colour of the meat and fat). Consumer interest in issues related to health has increased in recent years, and demand for better quality of life, balanced diets and dieting have created a demand for foods that are lower in calories and more nutritious (Minin, 2012).
Buffalo meat fits this profile due to its nutritional and functional properties and its low total and marbled fat content, high content of hypocholesterolaemic fatty acids (fatty acids that help remove “bad”, LDL cholesterol from the bloodstream), lower atherogenicity and thrombogenicity (fats that are not deposited in the blood vessels), high content of omega-3/omega-6, higher protein content, and lower calorie content than other types of meat such as poultry, sheep, and zebu or taurine cattle (Lira et al., 2005; Giordano et al., 2010). Colours are visual elements that have the ability to stimulate consumer perceptions, emotions and attitudes when choosing meat; brighter colours are usually related to higher quality or fresher products (Banovic et al., 2012).
Regarding household income, Pinheiro et al. (2011) found that individuals with higher incomes consume leaner meats and in reduced amounts. This behaviour may favour the consumption of buffalo meat due to its nutritional properties and reduced amount of fat. The fifth factor, gender and age, explained 7.94% of the total variance, relating positively to the variables X13 (gender) and X14 (age). These variables are non-sensorial demographic characteristics linked to consumers that naturally exhibit different behaviours in the face of everyday situations. This Meat Satisfaction scale Flavour Colour Succulence Tenderness
Buffalo Liked a lot 53.2 54.4 55.0 68.2
Liked moderately 35.8 34.7 30.2 19.7
Neither liked nor 4.3 6.0 5.8 2.5
disliked
Disliked moderately 4.7 3.8 5.6 5.6
Disliked a lot 2.0 1.1 3.4 4.0
Beef Liked a lot 47.9 50.6 43.4 33.8
Liked moderately 41.2 36.9 34.0 36.9
Neither liked nor 3.8 6.7 8.5 6.5
disliked
Disliked moderately 4.5 2.9 9.2 15.0
Disliked a lot 2.7 2.9 4.9 7.8
information is important for use in market segmentation as the selection criteria of consumers are often different between specific age range (Minin, 2012).
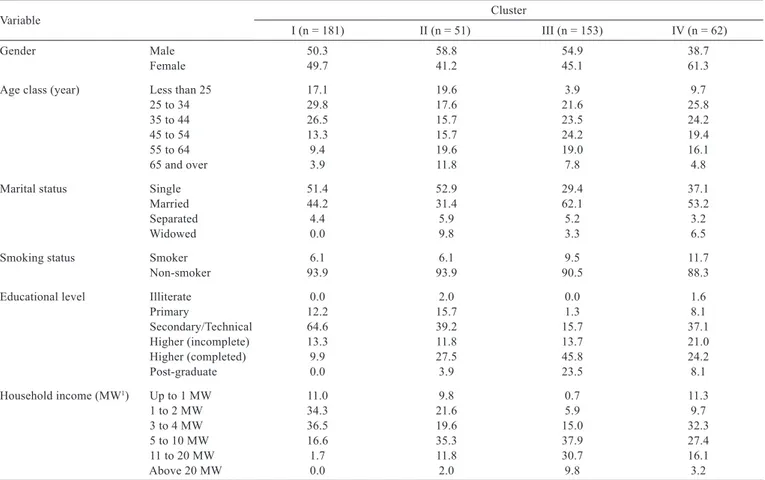
A cluster analysis was performed based on the scores of the five previously described factors. This analysis divided the sample into four groups of consumers (Tables 3, 4, 5, 6, and 7). The main variables used to differentiate among the groups were age, educational level, income, predisposition to consume buffalo meat, and purchase intention. According to Bernués et al. (2012) and Trienekens et al. (2012), establishing a differentiation strategy is essential for businesses to attract customers; segmentation facilitates an understanding of the market; and product positioning studies and consumer analysis assist in the making of pricing decisions and the effectiveness of the communication process.
Group I, Young and interested, was the largest group, with a total of 181 individuals (40% of the sample). This group liked buffalo meat and was also more predisposed to buy it. It is characterised by young people between the ages of 25 and 45; they predominantly have secondary/technical education and the lowest salary range, ranging between one and four times the minimum wage. Most group members are
unaware of the benefits of buffalo meat relative to the other groups; however, all stated that having access to information about the benefits of this food product may favour purchase, and they are willing to pay a higher price for meat with a certified origin and the SIF seal. According to Schnettler et al. (2009) and Banovic et al. (2012), the higher value that a consumer is willing to pay for certified meat is considered important, which shows that some consumer groups can be reached by guaranteeing quality demands.
Consumers of buffalo meat (14.4%) stood out within the group for exhibiting consumption habits that are more connected to family and friends; however, they consume this product less frequently (monthly or annually). For potential consumers (85.6%), the rationale for not consuming buffalo meat was product unavailability at the point of sale and lack of knowledge about its benefits; however, 97.3% are willing to include it in their diets.
The availability of buffalo meat in retail outlets is influenced by many factors, including the lack of joint effort between those involved in the production chain, placement in the market, ignorance of the consumer market, and possible fraud involving changing the label on the product to indicate that it is beef due to the similarity of the two
Table 3 - Demographic data and household income of interviewees (%)
Variable Cluster
I (n = 181) II (n = 51) III (n = 153) IV (n = 62)
Gender Male 50.3 58.8 54.9 38.7
Female 49.7 41.2 45.1 61.3
Age class (year) Less than 25 17.1 19.6 3.9 9.7
25 to 34 29.8 17.6 21.6 25.8
35 to 44 26.5 15.7 23.5 24.2
45 to 54 13.3 15.7 24.2 19.4
55 to 64 9.4 19.6 19.0 16.1
65 and over 3.9 11.8 7.8 4.8
Marital status Single 51.4 52.9 29.4 37.1
Married 44.2 31.4 62.1 53.2
Separated 4.4 5.9 5.2 3.2
Widowed 0.0 9.8 3.3 6.5
Smoking status Smoker 6.1 6.1 9.5 11.7
Non-smoker 93.9 93.9 90.5 88.3
Educational level Illiterate 0.0 2.0 0.0 1.6
Primary 12.2 15.7 1.3 8.1
Secondary/Technical 64.6 39.2 15.7 37.1
Higher (incomplete) 13.3 11.8 13.7 21.0
Higher (completed) 9.9 27.5 45.8 24.2
Post-graduate 0.0 3.9 23.5 8.1
Household income (MW1) Up to 1 MW 11.0 9.8 0.7 11.3
1 to 2 MW 34.3 21.6 5.9 9.7
3 to 4 MW 36.5 19.6 15.0 32.3
5 to 10 MW 16.6 35.3 37.9 27.4
11 to 20 MW 1.7 11.8 30.7 16.1
Above 20 MW 0.0 2.0 9.8 3.2
I - young and interested; II - mixed and indifferent; III - graduates and successful; IV- healthy women.
products (Karabasanavar et al., 2011; Mane et al., 2012; Sakaridis et al., 2013).
Group II may be classified as Mixed and indifferent, and is the smallest segment identified in this study, with 51 people (11% of the sample). It is a heterogeneous group, with large numbers of single people of various ages, educational levels varying between secondary/technical and higher education and household incomes between one and ten times the minimum wage.
Despite knowing the benefits of buffalo meat, this group believes that it should be more affordable (cheaper) than beef (56.9%) (Table 4). They are not willing to pay extra for buffalo meat with a certified origin. According to Insch and Jackson (2014), some consumers do not buy what they want for economic reasons. Among the analysed clusters, this group consumes the least buffalo meat (13.7%) and is less predisposed to include this food in meals more often than other groups.
The potential consumers (86.3%) in this group, in addition to citing the unavailability of the product at points of sale and their ignorance of its benefits, also considered buffalo meat to be tough and have a distinctive buffalo flavour (that differs from beef). This group was the least likely to include buffalo meat in meals relative to the other groups. Insch and Jackson (2014) and Miljkovic and Effertz (2010) report that consumers are influenced by factors involving food characteristics, but the context in which they operate or the society to which they belong can also influence their purchase decisions.
Group III, Graduates and successful, is the second-largest group, with 153 people (34% of the sample), most of whom are married and between the ages of 35 and 55. This segment includes people who are very willing to include buffalo meat in their meals. They have high educational levels and household income corresponding to five to twenty times the minimum wage. Consumers of buffalo
Table 4 - Profile of interviewed consumers and potential consumers (%)
Variable Cluster
I (n = 181) II (n = 51) III (n = 153) IV (n = 62)
Have heard of buffalo meat Yes 89.0 90.2 93.5 90.3
What is most important for consumers Origin of meat 40.3 33.3 47.1 35.5
at the time of purchase? Brand 8.3 13.7 7.2 6.5
Nutritional value 50.3 19.6 62.1 9.7
Price 31.5 29.4 30.1 29.0
Colour of meat and fat 2.8 27.5 15.0 100.0
Packaging 3.9 7.8 8.5 6.5
Would you pay more for buffalo meat Yes 100.0 23.5 98.7 100.0
with a certified origin?
Compared the price of beef, buffalo Cheaper 38.1 56.9 35.3 38.7
meat should be: Same price 50.8 33.3 49.7 56.5
More expensive 11.0 9.8 15.0 4.8
Do you think it is important for buffalo Yes 100.0 76.5 100.0 100.0
meat to have the SIF seal?
Where would you prefer to buy Direct from the producer 7.7 11.8 8.5 3.2
buffalo meat? Specialised supplier 35.9 33.3 41.8 46.8
Open-air market 17.7 13.7 13.1 14.5
Supermarket 86.2 76.5 88.2 85.5
Other 0.6 0.0 0.0 1.6
Having access to information regarding Yes 100.0 82.4 100.0 100.0
buffalo meat could improve your odds of purchasing the product.
I (n = 152) II (n = 32) III (n = 103) IV (n = 47)
Do you know the benefits of buffalo Yes 16.0 37.3 32.7 24.2
meat?
Most cited benefits Less fat 41.4 42.1 62.0 50.0
Description lacking details 3.4 10.5 6.0 14.3
No reply 10.3 21.1 4.0 0.0
Stronger 6.9 10.5 4.0 0.0
Healthy 13.8 10.5 12.0 21.4
More tender 3.4 5.3 8.0 0.0
More protein 20.7 0.0 4.0 14.3
Table 5 - Profile of interviewees who consume buffalo meat (%)
Variable Cluster
I (n = 26) II (n = 7) III (n = 33) IV (n = 17)
Consume buffalo meat Yes 14.4 13.7 21.6 27.4
How many times per month? Daily 15.4 28.6 3.0 11.8
Weekly 26.9 28.6 48.5 5.9
Biweekly 3.8 14.3 3.0 5.9
Monthly 23.1 14.3 24.2 47.1
Annually 30.8 14.3 21.2 29.4
Your habit of eating buffalo Family 46.2 42.9 30.3 29.4
meat comes from: Availability in restaurants 7.7 14.3 27.3 23.5
Relationship with family/friends who eat it 38.5 14.3 9.1 17.6
Information from newspapers, magazines and TV 3.8 28.6 24.2 17.6
Information from cooking lessons 3.8 0.0 9.1 11.8
You usually eat buffalo meat: At your home 69.2 71.4 78.8 58.8
At homes of family or friends 26.9 14.3 6.1 23.5
In restaurants 3.8 14.3 15.2 17.6
Consume buffalo meat and Yes 96.2 66.7 90.3 87.5
would include it in the diet more often
I - young and interested; II - mixed and indifferent; III - graduates and successful; IV- healthy women.
Table 6 - Reasons and justifications provided by interviewees who do not consume buffalo meat (%)
Variable Cluster
I (n = 153) II (n = 44) III (n = 122) IV (n = 45)
Reasons for not eating Characteristic flavour (buffalo) 1.3 9.1 1.6 0.0
buffalo meat1 Considered a tough meat 2.6 11.4 2.5 4.4
Not available at points of sale 48.4 34.1 67.2 48.9
Benefits of buffalo meat unknown 46.4 34.1 43.4 44.4
Related to the production system (dirty system with mud) 2.6 2.3 2.5 0.0
No specific reason 16.3 18.2 9.0 20.0
Do not consume, but would include buffalo meat in meals 97.3 74.4 95.7 97.8 I (n = 4) II (n = 11) III (n = 5) IV (n = 1)
Reasons for not including Benefits of buffalo meat unknown 25.0 36.4 60.0 0.0
buffalo meat in meals1 Never eaten before 50.0 27.3 0.0 0.0
Different flavour 0.0 27.3 0.0 0.0
Allergy 25.0 0.0 0.0 0.0
Dark colour 0.0 9.1 0.0 0.0
Tough meat 0.0 0.0 40.0 0.0
Bad smell 0.0 0.0 0.0 100.0
I - young and interested; II - mixed and indifferent; III - graduates and successful; IV- healthy women.
1 Here the interviewee was free to choose one or more alternatives.
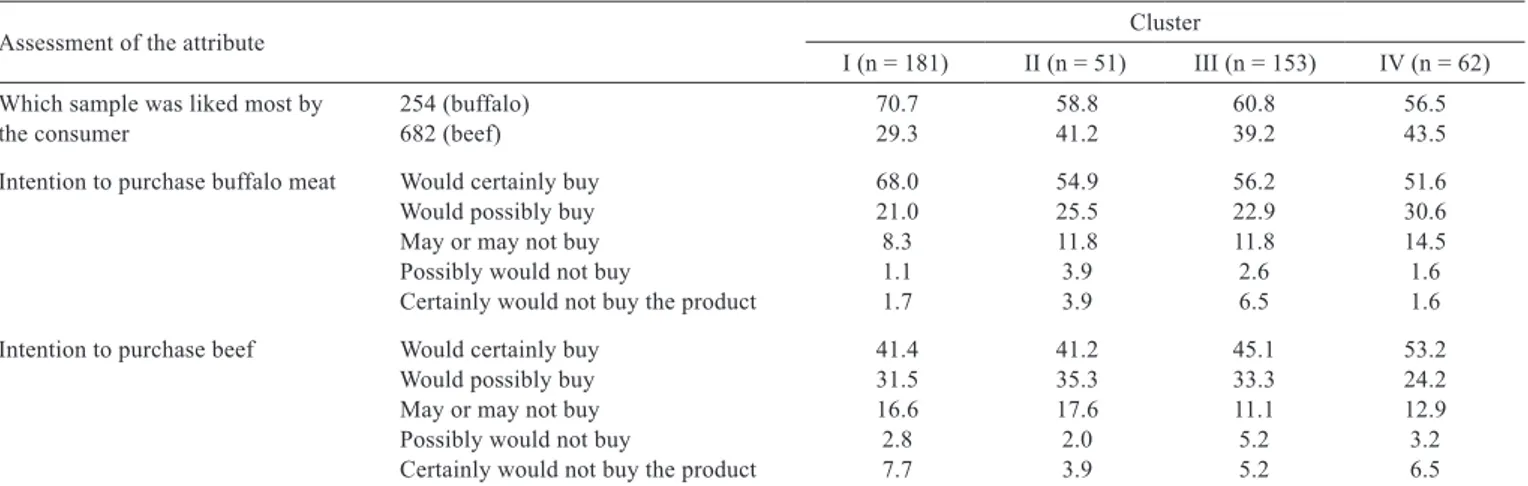
Table 7 - Sensory analysis outcomes with respect to the sample most liked by the consumer and purchase intention for the product (%)
Assessment of the attribute Cluster
I (n = 181) II (n = 51) III (n = 153) IV (n = 62)
Which sample was liked most by 254 (buffalo) 70.7 58.8 60.8 56.5
the consumer 682 (beef) 29.3 41.2 39.2 43.5
Intention to purchase buffalo meat Would certainly buy 68.0 54.9 56.2 51.6
Would possibly buy 21.0 25.5 22.9 30.6
May or may not buy 8.3 11.8 11.8 14.5
Possibly would not buy 1.1 3.9 2.6 1.6
Certainly would not buy the product 1.7 3.9 6.5 1.6
Intention to purchase beef Would certainly buy 41.4 41.2 45.1 53.2
Would possibly buy 31.5 35.3 33.3 24.2
May or may not buy 16.6 17.6 11.1 12.9
Possibly would not buy 2.8 2.0 5.2 3.2
Certainly would not buy the product 7.7 3.9 5.2 6.5
meat represent 21.6% of this group; their consumption habits are mostly based on family and restaurants; and they consume buffalo meat every week but are also willing to include it more often in meals. Among potential consumers (78.4%), failure to consume buffalo meat was explained by the unavailability of the product at points of sale and a lack of information regarding its benefits. These potential consumers feel that buffalo meat should be more expensive than beef, and this feature is considered favourable and may be related to their higher incomes. This type of income/ consumption relationship for meat is one of the factors with the highest impact on the acquisition and acceptance of foods, especially with respect to price and type of preferred meat. Some consumers seek more affordable products, while others associate price with quality, considering the most expensive products to have the best quality, or vice versa. This type of conflict can be solved through market segmentation (Bernués et al., 2012; Onwezen et al., 2012; Insch and Jackson, 2014).
Group IV, Healthy women, consists of 62 people (14% of the sample); they are mostly between the ages of 25 and 45, are married, and have secondary to higher levels of education and household incomes that are three to ten times the minimum wage. They stand out because they know about the benefits of buffalo meat, i.e., that it is healthier and has a lower fat content. In the sensorial test, 56.5% of participants in this group opted for buffalo meat, a lower proportion compared with other groups. However, most stated that they were willing to buy it. In this group, 100% consider the colour of meat and fat at the time of purchase and are willing to pay extra for buffalo meat with a certified origin.
This group has the highest number of buffalo meat consumers compared with the other groups (27.4%); however, their consumption frequency is low (monthly and annually). Their consumption habits are based on the family and restaurants. This group also consumes less meat at home, choosing to consume this type of food especially at houses of friends and restaurants. Potential consumers (72.6%) stated that they did not consume buffalo meat because of its unavailability in the market and their lack of knowledge regarding its benefits; however, they were the most interested in including buffalo meat in their diets. According to Vieira et al. (2010) and Carvalho and Alves (2012), in recent decades, significant changes in the compositions and sizes of families have changed gender relations, making women important consumers who are also demanding with regard to the nutritional quality of food, especially meat.
Verbeke and Ward (2006) report that women tend to place more importance on and pay greater attention to
specific indicators of food quality. According to Banovic et al. (2009), women are receptive to new products, tastings, and special offers, with the family being the main reason for their purchase of food. Siró et al. (2008) described the profile of the contemporary woman as someone who is constantly looking for new products and takes very special care of her physical and mental health, thus seeking healthy foods.
Regarding purchase intention during the sensory analysis, among the four studied clusters, it was observed that most people opted for buffalo meat and stated that they would certainly buy it (Table 7).
This finding shows that beef can be replaced by buffalo without affecting organoleptic characteristics. These indications are important both for the market, which can increase the value of buffalo meat (currently sold at 20% below the price of beef), and for the consumer, who can consume a healthier meat without losing sensory characteristics.
Conclusions
Consumers show a greater acceptance of buffalo meat based on the characteristics of flavour, colour, succulence, and tenderness. The study helps to identify market segments with distinct features that, combined with a targeted marketing strategy, can be used to leverage the supply chain.
Acknowledgments
The authors thank Pró-Reitoria de Pesquisa e Pós-Graduação (PROPESP) and Fundação de Amparo e Desenvolvimento da Pesquisa (FADESP).
References
Banovic, M.; Fontes, M. A. and Grunert, K. G. 2012. Impact of product familiarity on beef quality perception. Agribusiness 28:157-172. doi: 10.1002/agr.21290.
Banovic, M.; Grunert, K. G.; Barreira, M. M. and Fontes, M. A. 2009. Beef quality perception at the point of purchase: A study from Portugal. Food Quality and Preference, 20:335-342. doi: 10.1016/ j.foodqual.2009.02.009.
Bernardes, O. 2007. Bubalinocultura no Brasil: situação e importância econômica. Revista Brasileira de Reprodução Animal 31:293-298. Bernués, A.; Ripoll, G. and Panea, B. 2012. Consumer segmentation
based on convenience orientation and attitudes towards quality attributes of lamb meat. Food Quality and Preference 26:211-220. doi: 10.1016/j.foodqual.2012.04.008.
Brandão, F. S.; Ceolin, A. C.; Canozzi, M. E. A.; Révillion, J. P. P. and Barcellos J. O. J. 2012. Confiança e agregação de valor em carnes com indicação geográfica. Arquivo Brasileiro de Medicina Veterinária e Zootecnia 64:458-464. http://dx.doi.org/10.1590/ S0102-09352012000200028
Brisola, M. V. and Castro A. M. G. 2005. Preferências do consumidor de carne bovina no Distrito Federal pelo ponto de compra e pelo produto adquirido. Caderno de Pesquisas em Administração 12:81-99. Carvalho, A. A. and Alves, J. E. D. 2012. Explorando o consumo das
famílias brasileiras e sua interface com o ciclo de vida e gênero. Revista Brasileira de Economia Doméstica 23:6-29.
Giordano, G.; Guarini, P.; Ferrar, P.; Biondi-Zoccai, G.; Schiavone, B. I. P. and Giordano, A. 2010. Beneficial impact on cardiovascular risk profile of water buffalo meat consumption. European Journal of Clinical Nutrition 64:1000-1006. doi: 10.1038/ejcn.2010.108. Hair Jr., J. F.; Babin, B.; Money, A. H.; Samouel, P. 2007. Fundamentos
de métodos de pesquisa em administração. Bookman, Porto Alegre. Hill, M. M. and Hill, A. 2012. Investigação por questionário. Edições
Silabo, Lisboa.
Iannario, M.; Manisera, M.; Piccolo, D. and Zuccolotto, P. 2012. Sensory analysis in the food industry as a tool for marketing decisions. Advances in Data Analysis and Classification 6:303-321. doi: 10.1007/s11634-012-0120-4.
Insch, A. and Jackson, E. 2014. Consumer understanding and use of country-of-origin in food choice. British Food Journal 116:62-79. http://dx.doi.org/10.1108/BFJ-10-2011-0275
Jo, Y. J.; Jang, M. Y.; Jung, Y. K.; Kim, J. H.; Sim, J. B; Chun, J. Y.; Yoo, S. M.; Han, G. J.; and Min, S. G. 2014. Effect of novel quick freezing techniques combined with different thawing processes on beef quality. Korean Journal for Food Science of Animal Resources. 34:777-783. http://dx.doi.org/10.13050/foodengprog.2015.19.3.243 Johnson, R. A. and Wichern, D. W. 2007. Applied multivariate
statistical analysis. Upper Saddle River, NJ: Pearson. doi: 10.1007/ 978-3-540-72244-1.
Karabasanavar, N. S.; Singha S. P.; Umapathi V.; Kumarc, D.; Patil, G. and Shebannavare, S. N. 2011. A highly specific PCR assay for identification of raw and heat treated mutton (Ovis aries). Small Ruminant Research 100:153-158. doi: 10.1016/j.smallrumres.201 1.07.009.
Lee, S. Y.; Kim, K. L; Hwang, I. G.; Yu, S. M.; Min, S. G.; and Choi, M. J. 2015. Quality characteristics of frozen beef developed into home meal replacement products under various storage conditions. Food Engineering Progress19:243-249. http://dx.doi. org/10.13050/foodengprog.2015.19.3.243
Lira, G. M.; Mancini-Filho, J.; Torres, R. P.; Oliveira, A. C.; Vasconcelos, A. M. A.; Omena, C. M. B. and Almeida, M. C. S. 2005. Composição centesimal, valor calórico, teor de colesterol e perfil de ácidos graxos da carne de búfalo (Bubalis bubalis) da cidade de São Luiz do Quitunde-AL.Revista Instituto Adolfo Lutz 64:31-38. Malhotra, N. 2012. Pesquisa de marketing uma orientação aplicada.
Bookman, Porto Alegre.
Mane, B. G.; Mendiratta, S. K.; Tiwari, A. K. and Bhilegaokar, K. N. 2012. Detection of adulteration of meat and meat products with buffalo meat employing polymerase chain reaction assay in food
analytical methods. Food Analytical Methods 5:296-300. doi: 10.1007/s12161-011-9237-x.
McGloin, A.; Delaney, L.; Hudson, E. and Wall, P. 2009. Nutrition communication: The challenge of effective food risk communication. Proceedings of the Nutrition Society 68:135-141. doi: 10.1017/S0029665109001153.
Miljkovic, D. and Effertz, C. 2010. Consumer behavior in food consumption: Reference price approach. British Food Journal 112:32-43. http://dx.doi.org/10.1108/00070701011011182 Minin, V. P. R. 2012. Análise sensorial: Estudos com consumidores.
Editora UFV, Viçosa, MG.
Onwezen, M. C.; Reinders, M. J.; Van der Lans, I. A.; Sijtsema, S. J.; Jasiulewicz, A.; Guardia, M. D. and Guerrero, L. A. 2012. Cross-national consumer segmentation based on food benefits: The link with consumption situations and food perceptions. Food Quality and Preference 24:276-286. doi: 10.1016/j.foodqual.2011.11.002. Pinheiro, F. A.; Cardoso, W. S.; Chaves, K. F.; Oliveira, A. S. B. and
Rios S. A. 2011. Perfil de consumidores em relação à qualidade de alimentos e hábitos de compras. Revista Unopar Cientifica Ciências Biológicas e da Saúde 13:95-102.
Rutsaert, P.; Barnett, J.; Gaspar, R.; Marcu, A.; Pieniak, Z.; Seibt, B. and Verbeke, W. 2005. Beyond information seeking: Consumers’ online deliberation about the risks and benefits of red meat. Food Quality and Preference 39:191-201. doi: 10.1016/j.foodqual.2014.07.011 Sakaridis, I.; Ganopoulos, I.; Argiriou, A. and Tsaftaris, A. 2013.
A fast and accurate method for controlling the correct labeling of products containing buffalo meat using high resolution melting (HRM) analysis. Meat Science 94:84-88. doi: 10.1016/ j.meatsci.2012.12.017.
Schnettler, B.; Vidal, R.; Silva, R.; Vallejos, L. and Sepúlveda, N. 2009. Consumer willingness to pay for beef meat in a developing country: The effect of information regarding country of origin, price and animal handling prior to slaughter. Food Quality and Preference 20:156-165. doi: 10.1016/j.foodqual.2008.07.006 Silva, S. L. and Nardi Junior, G. 2014. Produção de derivados
bubalinos e mercado consumidor. Tekhne e Logos 5:15-30. Siró, I.; Kápolna, E.; Kápolna, B. and Lugasi, A. 2008. Functional
food. Product development, marketing and consumer acceptance -A review. -Appetite51:456-467. doi: 10.1016/j.appet.2008.05.060. Trienekens, J. H.; Wognuma, P. M.; Beulens, A. J. M. and Van der
Vorst, J. G. A. J. 2012. Transparency in complex dynamic food supply chains. Advanced Engineering Informatics 26:55-65. doi: 10.1016/j.aei.2011.07.007.
Verbeke, W.; Perez-Cueto, F. J. A.; Barcellos, M. D.; Krystallis, A. and Grunert, K. G. 2010. European citizen and consumer attitudes and preferences regarding beef and pork. Meat Science 84:284-292. doi: 10.1016/j.meatsci.2009.05.001.
Verbeke, W. and Ward, R. W. 2006. Consumer interest in information cues denoting quality, traceability and origin: An application of ordered probit models to beef labels. Food Quality and Preference 17:453-467. doi:10.1016/j.foodqual.2005.05.010.