1 (Trabalho 123-10). Recebido em: 11-05-2011. Aceito para publicação: 31-01-2011.
2Eng. Agr. MSc. Programa de Pós-Graduação em Agronomia. UTFPR, Campus Pato Branco. E-mails: moesesandrigo@yahoo.com.br; iosasso@ibest.com.br
3Eng. Agr. Dr. Professor Programa de Pós-Graduação em Agronomia. UTFPR, Campus Pato Branco. C.P. 571 – 85503-390, Via do Conhecimento, km 01, Pato Branco-PR, Brasil. E-mail: idemir@utfpr.edu.br
4Eng. Agr. Mestrando. Programa de Pós-Graduação em Agronomia. UTFPR, Campus Pato Branco. E-mail: silviascariotto@yahoo.com.br 5Eng. Agr. Dr. Professor Programa de Pós-Graduação em Agronomia. UTFPR, Campus Pato Branco. E-mail: benin@utfpr.edu.br
GENETIC DISSIMILARITY AMONG JABUTICABA TREES
NATIVE TO SOUTHWESTERN PARANÁ, BRAZIL
1MOESES ANDRIGO DANNER2, IDEMIR CITADIN3,
SIMONE APARECIDA ZOLET SASSO2, SILVIA SCARIOT4, GIOVANI BENIN5
ABSTRACT - Knowledge on the genetic diversity within and between genotype groups is of great im-portance for breeding programs. The purpose of this study was to estimate the genetic dissimilarity among 36 native jabuticaba trees (Plinia cauliflora) from five sites in the southwestern region of Paraná, Brazil. Sixteen fruit traits were analyzed, based on multivariate techniques (canonical variables, Tocher and UP-GMA), using Mahalanobis´ distance as dissimilarity measure. By the techniques of clustering and graphic dispersion, together with the comparison of means, the genetic diversity among native jabuticaba trees was efficiently identified, indicating a high potential of these genotypes for breeding programs. The traits of greatest importance for dissimilarity were percentage of pulp and of skin, which are easily measured. The clustering structure is related to the collection sites and for breeding programs, genotypes from different sites should be crossed to generate progenies to be tested. Genotypes ‘CV5’ and ‘VT3’ should be conserved in genebanks, due to its important agronomic traits.
Index terms: Plinia sp., phenotypic traits, germplasm.
DISSIMILARIDADE GENÉTICA ENTRE JABUTICABEIRAS
NATIVAS DO SUDOESTE DO PARANÁ
Rev. Bras. Frutic., Jaboticabal - SP, v. 33, n. 2, p. 517-525, Junho 2011 518
INTRODUCTION
The Jabuticaba tree (Plinia sp.) belongs to the Myrtaceae family and is native to Central and Southeastern Brazil (MATTOS, 1983). Its production potential, however, is great, due to the organoleptic fruit characteristics (BARROS et al., 1996). Also, is interesting to food and pharmaceutical industries due to high leaf concentrations of essential oils (APEL et al., 2006) and anthocyanins in the fruit skin (TEIX-EIRA et al., 2008). However, commercial orchards of this fruit tree are still scarce.
In the Southwestern region of Paraná, Brazil, there are forest remnants of the Forest with Arau-caria, with a natural occurrence of P. cauliflora, one of the jabuticaba tree species. Nevertheless, the anthropogenic pressure in these areas is strong and, consequently, there is the risk of genetic erosion of the remaining populations.
In this sense, the estimation of genetic dis-similarity of native jabuticaba trees can be useful to establish strategies for in situ and ex situ conserva-tion (JOLIVET; BERNASCONI, 2007; KUMAR et al., 2007). It also provides information on available genetic resources, for the formation of genebanks, the orientation of crosses between the most dissimilar genotypes and detection of genotypes with the best agronomic traits (CRUZ et al., 2004; THUL et al., 2009). But, even knowledge of reproductive mode of the jabuticaba tree must be improved.
The purpose of this study was to estimate the genetic dissimilarity among native jabuticaba trees in the Southwestern region of Paraná, Brazil, based on physicochemical fruit traits. Data generated by this study will contribute to jabuticaba tree breeding and cultivation on a commercial scale, which are still in an initial stage in Brazil.
MATERIALS AND METHODS
Fruits were collected from 36 adult jabuticaba trees of unknown age, at five sites (CH: 25°52’40”S, 52°36’40”W, 854 m asl; CV: 25°59’20”S, 52°42’05”W, 577 m asl; CL: 26°26’20”S, 52°19’15”W, 963 m asl; PB: 26°07’20”S, 52°39’15”W, 717 m asl; VT: 26°19’00”S, 52°46’45”W, 820 m asl), in the South-west of Paraná, Brazil, in September and October 2007. Plants were located inside remnants of the Forest with Araucaria. Each plant was divided into four quadrants (North, South, East and West), and 25 fruits were collected per quadrant. The number of plants varied from two to nine, according to the avail-ability of ripe fruit at the collect date. Furthermore, fruits were collected of plants distant from each other
at least 20 meters.
Sixteen fruits traits were evaluated: weight, equatorial diameter and fruit composition (seed, pulp and skin), pH, total soluble solids (TSS), titratable acidity (TA) and the pulp ratio TSS/TA; anthocy-anin and flavonoid contents in the fruit skin; number of seeds per fruit and mean seed weight; seedling emergence percentage, polyembryony percentage and speed of emergence (SE).
Fruit composition was determined based on total weight of the fruits, fruit skin and seeds, and the values were expressed in percentage. TSS of the pulp was measured with a digital refractometer and expressed in °Brix. TA was determined by titration and the values were expressed as grams of citric acid per 100 mL (INSTITUTO ADOLFO LUTZ, 1985). Fruit skin samples were deep-frozen (-18°C) and the anthocyanin and flavonoid concentrations quantified, according to the method of Lees and Francis (1972). To assess the percentage of seedling emer-gence, polyembryony and SE, 12 seeds per plant quadrant were sown, immediately after their extrac-tion, in 72-cell trays (100 cm3 cells), containing Plantmax® substrate, one seed per cell. Seedlings were counted every five days, from the beginning of emergence (35 days after sowing) until 95 days after sowing. The SE was calculated by dividing the number of emerged seedlings by the number of days from the date of sowing until emergence. The sum of the values for each date was considered the SE. On the 95th day after sowing, the final percentage of emergence and polyembryony rate (percentage of seeds that originated more than one plant) were evaluated.
The data were subjected to analysis of vari-ance, in a completely randomized design with four replications, and means compared by the Scott-Knott (P ≤ 0.05). The values of percentage of emergence were transformed by √x and percentage polyem-bryony by √x + 0,5. These tests were performed using software Genes (CRUZ, 2006a).
Vasconcelos et al. (2007). The relative importance of traits for the genetic dissimilarity (SINGH, 1981) was also estimated. These tests were performed using Genes software (CRUZ, 2006b).
RESULTS AND DISCUSSION
For the physical fruit traits it was found that the weight (10.7 g) and diameter (25.6 mm) of genotype ‘VT3’ were significantly higher than all other genotypes. Furthermore, it had the lowest seed content (3.2%), not differing only from ‘CL3’ (3.6%). All genotypes from ‘VT’ and ‘CV’ also stood out with higher pulp yield (> 56.8%), with the exception of ‘CV7’ (55.2%) (Table 1). Genotypes with these traits may be appropriate for fresh consumption and for juice and frozen pulp production, due to its great industrial efficiency. These values are higher than those found by Jesus et al. (2004) in four groups of jabuticaba trees from Jaboticabal, São Paulo, Brazil, with up to 38% of pulp yield. Genotypes in ‘CH’ and ‘CL’ had the highest percentage of fruit skin (Table 1). In this case, the higher yield of fruit skin can be exploited in the industry for the production of jelly and fermented beverages. Probably, the shelf life of this kind of fruit is larger, because, according to Pereira et al. (2000), the firmness of jabuticaba with a thicker skin is greater.
Regarding chemical fruit traits plant ‘CV5’ stood out with total soluble solids (TSS) of 17.3 °Brix, which is significantly higher than in the other genotypes. Sweeter fruits are preferred by consum-ers and result in lower operational costs in industry. However, this can also result in a lower postharvest storage capacity, due to faster fermentation (BAR-ROS et al., 1996). Titratable acidity (TA) was lower in fruits of the ‘CV’ genotypes, compared to the oth-ers, with values of 0.25 - 0.37 g of citric acid per 100 g of pulp. These values are lower than those found by Pereira et al. (2000), in fruits of eight genotypes of three jabuticaba species in Viçosa, Minas Gerais, and by Oliveira et al. (2003), for fruits of ‘Sabara’ jabuticaba (Plinia jaboticaba), from 10 different cultivation regions in the state of São Paulo, Brazil. Consequently, the TSS/TA ratio of the ‘CV’ genotypes was significantly higher than for genotypes from the other sites.
Anthocyanin and flavonoid content in fruit skin ranged from 367 - 1420 and 196 - 571 mg 100 g-1, respectively. In general, the anthocyanin and flavonoid content was significantly higher in fruits of the genotypes ‘CV’ and ‘VT’, and in ‘CH2’, and lower in ‘CL’ and ‘CH’ plants. The jabuticaba fruit
skin, of the studied genotypes, is rich in anthocyanins and flavonoids. The contents of those components are higher than in many other fruits containing considerable amounts of these compounds, such as açaí tree - Euterpe oleracea (POZO-INSFRAN et al., 2004) and Surinam cherry - Eugenia uniflora
(LIMA et al., 2002). A growing interest in the use of anthocyanins and flavonoids is currently observed in the cosmetic industry because of the anti-aging effect (ARCT et al., 2002), in the food industry as natural coloring (GIUSTI et al., 1998) and in the pharmaceutical industry, as a disease prevention, e.g., cancer (KAMEI et al., 1995). Therefore, these genotypes are promising sources of compounds with antioxidant properties and their cultivation should be encouraged.
The number of seeds was significantly greater for some genotypes from the ‘CL’ site (‘CL2’, ‘CL4’, ‘CL7’, ‘CL8’, ‘and CL10’), while the seed weight was lower. The percentage of seedling emergence was higher (over 83%) in the ‘CL4’, ‘CL5’, ‘ PB3’ and ‘PB4’ genotypes and all from the ‘CV’ site (except for ‘CV4’ and ‘CV8’). Andrade and Martins (2003) detected variability in the germina-tion percentage between three different jabuticaba genotypes, grown in Jaboticabal, São Paulo, ranging from 41 to 58%. In this experiment, the variability was even greater, since emergence ranged from 10.5 to 95.8%. The SE was significantly higher for the ‘PB3’ and ‘CV5’ genotypes, which were faster in plant emergence (Table 1). These traits are important for seedling development, either for a commercial purpose or for breeding. However, it is necessary to observe that the number of seeds used in this study was low and the results should be used carefully.
Regarding polyembryony, the percentage was significantly higher (75.1%) for ‘CL2’ than for all the other genotypes. In polyembryonic seeds, there is usually a zygotic embryo formed by fertil-ization, and one or more asexual embryos, which produce plants that are clones of the mother plant. This process has an enormous potential for genetic improvement by clonal propagation of superior genotypes using seeds. However, to date this po-tential is little known and exploited (KOLTUNOW; GROSSNIKLAUS, 2003). A technique for an early differentiation of the zygotic from the non-zygotic plants must be developed for jabuticaba tree.
There was wide variation among genotypes for all traits, mainly among genotypes from differ-ent sites, indicating sufficidiffer-ent genetic variability for the selection of superior genotypes with potential to breeding.
Rev. Bras. Frutic., Jaboticabal - SP, v. 33, n. 2, p. 517-525, Junho 2011 520
genotype pairs was highest for ‘CV5’ and ‘CL8’ (D2 = 660), indicating that these genotypes were the most divergent. The dissimilarity was lowest between ‘CL1’ and ‘CL5’ (D2 = 7), which are the most similar. Besides, by averaging the distances, ‘CV5’ (D2 = 370), ‘CV1’ (D2 = 329), ‘CV2’ (D2 = 299), ‘CV9’ (D2 = 285), ‘CV6’ (D2 = 282) and ‘VT3’ (D2 = 253) had higher dissimilarity with the other genotypes. The mean distances between genotypes within a site showed that the higher dissimilarity was among ‘CV’ (D2 = 60) and ‘VT’ (D2 = 89) genotypes. Therefore, genetic distance is greater among plants at different sites than among plants of the same site. However, it is noteworthy that some genotypes had high values of dissimilarity, as in the case of ‘VT3’ compared to the other genotypes of the ‘VT’ site (Data not showed).
The traits of fruit skin and fruit pulp percent-age accounted for 93.5% of the genetic dissimilarity between the genotypes (Table 2). It should be noted that these traits are easily measured by separation and weighing, and are also commercially important traits, particularly in relation to pulp yield.
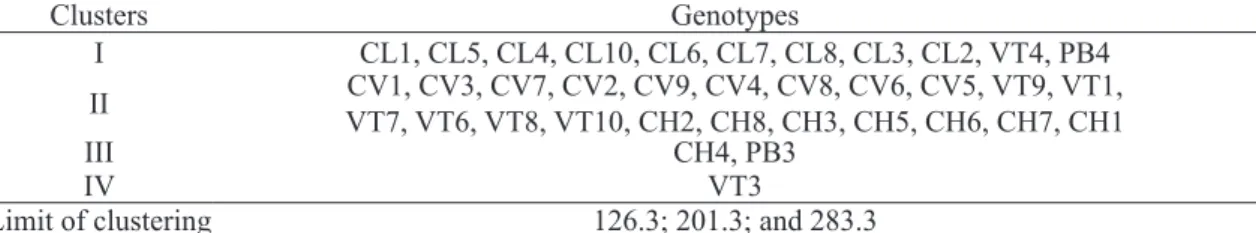
Although the modified Tocher clustering method formed four groups, and was observed that 90% or 32 out of 36 genotypes were grouped with others of the same site of occurrence. It was also noted that the genotype ‘VT3’ was not grouped with any other genotype, by either method (Table 3). This indicates a high genetic dissimilarity of this genotype in relation to the others, including those from the same site of occurrence. The original Tocher method clusters the groups simultaneously, based on a single reference value. By the modified Tocher method, developed by Vasconcelos et al. (2007), the groups are formed sequentially, and a new threshold value is established after the forma-tion of each new group. Moreover, by this method, there is no influence of grouped genotypes on the new grouping. Thus, the number of groups formed is smaller and the clustering of genotypes with high dissimilarity with greater efficiency compared to the original Tocher method.
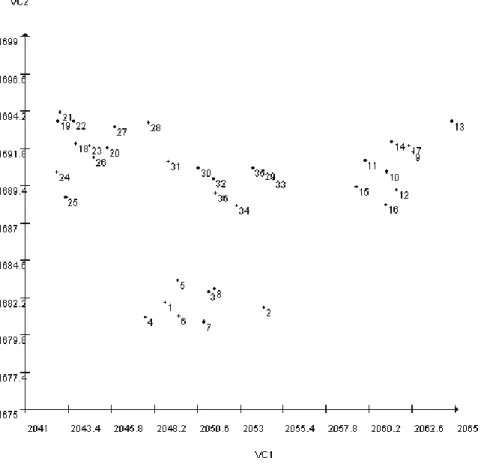
Each canonical variable is a linear combina-tion of original variables analyzed and the first two canonical variables must involve more than 80% of the total variance of the genotypes (CRUZ et al., 2004). For this purpose the traits fruit diameter, TSS/TA, polyembryony percentage, and SE were considered redundant and had to be excluded. By the exclusion, the cumulative percentage of vari-ance for the first two canonical variables increased from 73.5% to 80.1%. The remaining 12 traits were therefore used for a two-dimensional graphical
rep-resentation of the canonical variables.
The graph shows the formation of four groups, which are associated with the location of the geno-types at the different sites of occurrence. One cluster was formed by genotypes 1 to 8, including all geno-types from the ‘CH’ site; another grouped genogeno-types 9 to 17, consisting of all genotypes from ‘CV’; a group formed by the genotypes 18 to 28 representing all genotypes from ‘CL’ and ‘PB’, and one cluster containing the genotypes 29 to 36, corresponding to all genotypes of ‘VT’ (Figure 1).
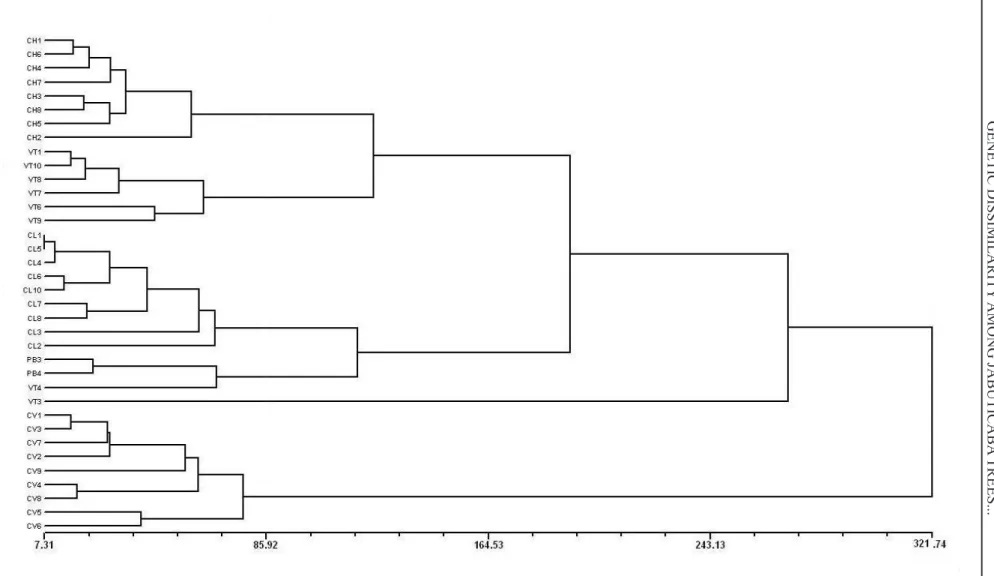
The dendrogram showed the formation of six clusters, grouping mainly genotypes from the same site of occurrence. The first group consisted of all genotypes from the ‘CH’ site; the second group con-tained all genotypes from ‘VT’, with the exception of ‘VT3’ and ‘VT4’; the third group consisted of all genotypes from the ‘CL’ site; the fourth group was formed by the genotypes ‘PB3’, ‘PB4’ and ‘VT4’; the fifth group contained only genotype ‘VT3’; and the sixth group the remaining genotypes from the ‘CV’ site (Figure 2). The value of the cophenetic correlation coefficient (r = 0.84) was well adjusted to the graph of distances and the original dissimilarity matrix (ROHLF, 2000), allowing reliable inferences based on a visual examination of the dendrogram.
The different methods of assessing genetic dis-similarity grouped the jabuticaba genotypes similarly, related to the different sites of occurrence. This shows that the geographic isolation allowed the evolution of genotypes and formation of families that share the same gene pool, with specific traits at the places of occurrence. Contrarily, Araújo et al. (2008), evalu-ated the genetic similarity between wild Passiflora cincinnata genotypes, based on phenotypic traits, and found that only 25% of the genotypes were grouped according to the origin. This was due to the fact that the specie had been dispersed to these sites through by human influence. Therefore, crosses between genotypes from different sites, since they are more divergent genotypes, the greater could be the effect of heterosis in the resulting progeny, increasing the probability of obtaining superior genotypes (TEKLE-WOLD; BECKER, 2006).
In this study, the genotypes of the ‘CV’ and ‘VT’ sites where noteworthy, particularly the ‘CV5’ and ‘VT3’, whose agronomic traits were superior and had high genetic dissimilarity. These two geno-types should be tested in experimental cultivation, beginning with the seedling production by vegetative propagation. Moreover, these genotypes can be used in breeding programs through crossings with any other genotypes.
521
Rev
. Bras. Frutic., Jaboticabal - SP
, v
. 33, n. 2, p. 517-525, Junho 201
1
Weight Diameter Composition of fruit (%) TSS TA Anthocyanin Flavonoids Weight seedsEmergence SE Polyembryony
Genotype (g) (mm) Seed Pulp Skin pH (ºBrix) acid 100 mL(g citric -1) TSS/TA mg 100 g-1 of skin N° seeds (g) (%) (days) (%)
CH1 6.2 e 21.7 e 6.2 b 48.4 c 45.4 b 3.42 d 12.4 g 0.76 c 16.4 g 619.9 c 309.9 b 1.25 c 0.306 c 10.5 h 0.130 g 0.0 g
CH2 5.8 e 21.0 f 6.3 b 53.3 b 40.4 b 3.73 c 14.2 e 0.56 e 26.1 f 1166.0 a 369.7 a 1.14 c 0.321 b 18.9 g 0.126 g 8.4 f
CH3 7.3 c 22.7 d 6.7 a 49.3 c 44.0 b 3.81 b 12.9 f 0.53 e 24.7 f 665.8 c 232.1 b 1.51 a 0.322 b 25.2 f 0.177 g 8.3 f
CH4 7.5 c 23.0 c 6.8 a 41.2 d 52.0 a 3.62 c 11.7 h 0.67 d 17.5 g 405.4 c 198.5 b 1.33 b 0.388 a 14.8 g 0.104 g 2.1 g
CH5 5.5 e 20.9 f 7.0 a 43.1 d 49.9 a 3.53 d 11.9 h 0.74 c 16.1 g 409.9 c 195.6 b 1.20 c 0.319 b 37.5 e 0.154 g 10.5 f
CH6 6.6 d 22.0 e 6.9 a 48.2 c 44.9 b 3.66 c 11.9 h 0.66 d 18.4 g 438.2 c 201.1 b 1.22 c 0.374 a 12.7 h 0.138 g 8.4 f
CH7 7.2 c 22.6 d 5.8 b 46.1 d 48.1 a 3.92 b 12.6 g 0.48 e 26.4 f 628.5 c 232.2 b 1.12 c 0.375 a 10.5 h 0.141 g 8.3 f
CH8 6.5 d 21.2 f 7.0 a 49.2 c 43.8 b 3.89 b 12.3 g 0.59 d 21.1 f 653.8 c 235.6 b 1.22 c 0.371 a 37.5 e 0.127 g 8.3 f
CV1 6.7 d 21.7 e 6.2 b 60.5 a 33.3 d 3.97 a 16.5 b 0.31 g 54.2 b 1272.4 a 412.8 a 1.21 c 0.347 b 91.7 a 0.605 c 51.8 b
CV2 6.0 e 20.9 f 6.6 a 58.7 a 34.7 c 4.08 a 16.1 b 0.37 g 44.3 d 889.5 b 381.3 a 1.41 b 0.284 c 91.7 a 0.656 b 54.0 b
CV3 6.7 d 21.7 e 5.9 b 59.0 a 35.1 c 4.05 a 14.9 d 0.31 g 48.9 c 1089.6 a 362.2 a 1.16 c 0.342 b 87.5 a 0.568 c 58.3 b
CV4 7.0 d 22.1 d 6.5 a 60.6 a 32.9 d 4.16 a 15.4 c 0.27 g 58.3 a 1053.7 a 410.1 a 1.28 c 0.358 a 62.8 c 0.508 c 20.8 e
CV5 6.4 d 21.4 e 5.0 c 63.6 a 31.5 d 4.11 a 17.3 a 0.27 g 63.2 a 1419.4 a 373.2 a 1.08 c 0.294 c 95.8 a 0.848 a 45.6 c
CV6 7.3 c 22.4 d 4.6 c 59.3 a 36.0 c 4.19 a 15.7 c 0.26 g 61.2 a 1182.3 a 398.0 a 1.01 c 0.336 b 83.4 a 0.704 b 54.0 b
CV7 6.3 d 21.1 f 7.5 a 55.2 b 37.3 c 3.83 b 14.6 d 0.33 g 44.1 d 1007.5 b 413.4 a 1.33 b 0.358 a 83.4 a 0.436 d 49.8 b
CV8 6.1 e 21.0 f 6.5 a 61.6 a 31.9 d 4.18 a 15.1 d 0.30 g 50.9 c 846.6 b 438.4 a 1.19 c 0.340 b 62.8 c 0.395 e 12.7 f
CV9 6.4 d 21.5 e 6.7 a 62.1 a 31.3 d 4.23 a 14.8 d 0.25 g 59.0 a 827.3 b 375.0 a 1.23 c 0.348 b 87.5 a 0.322 e 43.3 c
CL1 7.3 c 22.5 d 5.1 c 53.6 b 41.3 b 3.11 e 9.3 j 0.83 b 11.3 h 420.5 c 272.8 b 1.32 b 0.285 c 75.2 b 0.430 d 41.3 c
CL2 7.6 b 22.9 c 4.7 c 53.8 b 41.5 b 3.03 e 9.2 j 0.86 a 10.8 h 505.3 c 252.8 b 1.48 a 0.243 d 79.2 b 0.500 c 75.1 a
CL3 7.7 b 22.9 c 3.6 d 50.8 c 45.6 b 3.51 d 10.4 i 0.66 d 15.9 g 531.3 c 237.2 b 1.19 c 0.233 d 81.3 b 0.510 c 52.0 b
CL4 7.3 c 22.4 d 5.1 c 50.3 c 44.6 b 3.02 e 9.2 j 0.90 a 10.3 h 425.4 c 235.9 b 1.48 a 0.249 d 89.6 a 0.479 d 41.3 c
CL5 7.1 c 22.3 d 4.8 c 50.1 c 45.1 b 3.04 e 9.5 j 0.90 a 10.8 h 430.1 c 198.3 b 1.26 c 0.272 d 87.5 a 0.460 d 43.6 c
CL6 7.2 c 22.5 d 4.4 c 54.2 b 41.4 b 3.10 e 10.0 i 0.72 c 14.0 g 455.3 c 293.4 b 1.35 b 0.235 d 71.1 b 0.257 f 49.8 b
CL7 7.7 b 23.0 c 4.9 c 50.8 c 44.3 b 2.98 e 9.6 j 0.82 b 11.7 h 445.2 c 242.7 b 1.49 a 0.253 d 52.0 d 0.225 g 27.1 d
CL8 6.6 d 22.1 d 5.7 b 51.0 c 43.3 b 3.05 e 8.8 j 0.78 b 11.3 h 367.1 c 216.8 b 1.44 a 0.269 d 45.5 d 0.215 g 12.7 f
CL10 7.3 c 22.5 d 5.7 b 53.6 b 40.7 b 3.22 e 9.4 j 0.70 c 13.5 h 492.1 c 256.8 b 1.55 a 0.267 d 73.2 b 0.331 e 41.3 c
PB3 7.0 d 22.2 d 4.9 c 49.6 c 45.6 b 2.83 f 11.1 h 0.78 b 14.4 g 600.7 c 290.4 b 1.32 b 0.260 d 87.5 a 0.948 a 18.8 e
PB4 6.9 d 22.3 d 5.1 c 52.0 b 43.0 b 2.88 f 11.8 h 0.70 c 17.0 g 485.7 c 341.0 b 1.33 b 0.268 d 91.6 a 0.740 b 19.0 e
VT1 7.6 b 23.1 c 4.7 c 65.2 a 30.1 d 3.59 c 13.9 e 0.41 f 34.1 e 1134.5 a 570.5 a 1.24 c 0.292 c 66.8 c 0.419 d 27.2 d
VT3 10.7 a 25.6 a 3.2 d 63.8 a 33.0 d 3.70 c 13.5 e 0.41 f 33.6 e 1097.6 a 537.8 a 1.12 c 0.307 c 60.5 c 0.356 e 10.5 f
VT4 8.2 b 24.1 b 5.1 c 56.8 a 38.1 c 3.36 d 11.8 h 0.55 e 21.5 f 723.7 c 457.7 a 1.19 c 0.351 b 79.2 b 0.509 c 23.1 e
VT6 5.7 e 20.7 f 6.0 b 59.4 a 34.6 c 3.30 d 11.5 h 0.50 e 23.3 f 715.7 c 499.5 a 1.22 c 0.278 c 71.0 b 0.349 e 29.2 d
VT7 6.3 d 21.6 e 5.3 c 60.4 a 34.3 c 3.49 d 14.0 e 0.45 f 31.5 e 996.6 b 458.7 a 1.23 c 0.277 c 71.0 b 0.277 f 16.8 e
VT8 8.0 b 23.3 c 5.5 c 59.7 a 34.8 c 3.59 c 12.9 f 0.41 f 31.9 e 1066.9 a 566.9 a 1.15 c 0.381 a 56.3 d 0.279 f 14.8 e
VT9 7.0 d 22.2 d 6.6 a 61.7 a 31.7 d 3.47 d 12.9 f 0.48 e 28.8 e 816.0 b 482.3 a 1.38 b 0.332 b 79.2 b 0.520 c 54.0 b
VT10 8.1 b 23.4 c 5.1 c 62.7 a 32.2 d 3.41 d 13.2 f 0.48 e 27.8 f 898.0 b 465.9 a 1.34 b 0.306 c 54.0 d 0.256 f 17.0 e
Average 7.0 22.2 5.7 55.0 39.4 3.6 12.6 0.55 28.5 755.1 344.9 1.3 0.31 63.5 0.394 29.4
CV (%) 7.0 2.6 8.6 6.0 8.4 4.1 4.2 10.9 12.8 27.7 37.9 9.5 8.9 7.1 18.0 13.4
GENETIC DISSIMILARITY
AMONG JABUTICABA
Rev. Bras. Frutic., Jaboticabal - SP, v. 33, n. 2, p. 517-525, Junho 2011 522
FIGURE 1 - Dispersion biplot of 36 genotypes of jabuticaba tree in relation to the first two canonical variables. Legend of genotypes: 1 = ‘CH1’, 2 = ‘CH2’, 3 = ‘CH3’, 4 = ‘CH4’, 5 = ‘CH5’, 6 = ‘CH6’, 7 = ‘CH7’, 8 = ‘CH8’, 9 = ‘CV1’, 10 = ‘CV2’, 11 = ‘CV3’, 12 = ‘CV4’, 13 = ‘CV5’, 14 = ‘CV6’, 15 = ‘CV7’, 16 = ‘CV8’, 17 = ‘CV9’, 18 = ‘CL1’, 19 = ‘CL2’, 20 = ‘CL3’, 21 = ‘CL4’, 22 = ‘CL5’, 23 = ‘CL6’, 24 = ‘CL7’, 25 = ‘CL8’, 26 = ‘CL10’, 27 = ‘PB3’, 28 = ‘PB4’, 29 = ‘VT1’, 30 = ‘VT3’, 31 = ‘VT4’, 32 = ‘VT6’, 33 = ‘VT7’, 34 = ‘VT8’, 35 = ‘VT9’, 36 = ‘VT10’.
TABLE 2 - Relative contribution (S.j) of each trait to the dissimilarity among genotypes of jabuticaba tree based on Singh’s statistics.
Traits S.j %
Weight of fruit 5109.2 0.14
Diameter of fruit 3996.3 0.11
% seed 110895.4 3.00
% pulp 1682443.8 45.50
% skin 1776992.3 48.00
pH 8498.8 0.23
Total soluble solids (TSS) 27217.5 0.74
Titratable acidity (AT) 8670.7 0.23
TSS/TA 24414.0 0.66
Anthocyanin 1897.3 0.05
Flavonoids 396.4 0.01
N° seeds by fruit 8551.9 0.23
Weight of seed 6563.5 0.18
% emergence 11363.9 0.31
% polyembryony 14357.8 0.39
Speed of emergence 8430.4 0.23
523
Rev
. Bras. Frutic., Jaboticabal - SP
, v
. 33, n. 2, p. 517-525, Junho 201
FIGURE 2- UPGMA dendrogram for 36 genotypes of jabuticaba tree applied to Mahalanobis’ distance matrix. Cophenetic correlation coefficient is 0.84.
AMONG JABUTICABA
Rev. Bras. Frutic., Jaboticabal - SP, v. 33, n. 2, p. 517-525, Junho 2011 524
TABLE 3 - Clustering of 36 genotypes of jabuticaba tree using modified Tocher’s method applied to the generalized distance of Mahalanobis.
Clusters Genotypes
I CL1, CL5, CL4, CL10, CL6, CL7, CL8, CL3, CL2, VT4, PB4 II CV1, CV3, CV7, CV2, CV9, CV4, CV8, CV6, CV5, VT9, VT1,VT7, VT6, VT8, VT10, CH2, CH8, CH3, CH5, CH6, CH7, CH1
III CH4, PB3
IV VT3
Limit of clustering 126.3; 201.3; and 283.3
CONCLUSIONS
1-There is genetic variability among jabu-ticaba tree (Plinia cauliflora) genotypes for all analyzed traits.
2-The clustering structure is related to the collection sites. In general, genotypes from differ-ent sites are more divergdiffer-ent than genotypes from the same site. For breeding programs, genotypes from different sites should be crossed to generate progenies to be tested.
3- The genotypes ‘CV5’ and ‘VT3’ should be conserved in genebanks, due to their important agronomic traits.
ACKNOWLEGMENTS
The authors would like to thank the CAPES and the Fundação Araucária for the Master’s schol-arship to the first author and also to the Fundação Araucária, the CNPq and the UTFPR for the research financial support.
REFERENCES
ANDRADE, R.A.; MARTINS, A.B.G. Influence of the temperature in germination of seeds of jabuticaba tree. Revista Brasileira de Fruticultura, Jabotica-bal, v.25, p.197-198, 2003.
APEL, M.A.; SOBRAL, M.; ZUANAZZI, J.A.; HENRIQUES, A.T. Essential oil composition of four
Plinia species (Myrtaceae). Flavour and Fragrance Journal, Jena, v.21, p.565-567, 2006.
ARAÚJO, F.P.; SILVA, N.; QUEIROZ, M.A. Dis-similaridade genética entre acessos de Passiflora cincinnata Mast com base em descritores
morfoa-gronômicos. Revista Brasileira de Fruticultura, Jaboticabal, v.30, p.723-730, 2008.
ARCT, J.; OBORSKA, M.; MOJSKI, A.; BINKO-WWSKA, B.; SWIDZIKOWSKA, B. Common cos-metic hydrofilic ingredients as penetration modifiers of flavonoids. International Journal of Cosmetic Science, London, v.24, p.357-366, 2002.
BARROS, R.S.; FINGER, F.L.; MAGALHÃES, M.M. Changes in nonstructural carbohydrates in developing fruit of Myrciaria jaboticaba. Scientia Horticulturae, Amsterdam, v.66, p.209-215, 1996.
CRUZ, C.D. Programa genes: análise multivariada e simulação. Viçosa: Universidade Federal de Viçosa, 2006b. 175p.
CRUZ, C.D. Programa genes: estatística experi-mental e matrizes. Viçosa: Universidade Federal de Viçosa, 2006a. 285p.
CRUZ, P.J.; CARVALHO, F.I.F.; OLIVEIRA, A.C.; BENIN, G.; VIEIRA, E.A.; SILVA, J.A.G.; VALÉRIO, I.P.; HARTWIG, I.; BUSATO, C.C. Genetic dissimilarity among wheat genotypes for lodging-associated traits. Crop Breeding and Applied Biotechnology, Londrina, v.4, p.427-433, 2004.
GIUSTI, M.M.; RODRÍGUEZ-SAONA, L.E.; BAGGET, J.R.; REED, G.L.; DURST, R.W.; WROL-STAD, R.E. Anthocyanin pigment composition of red radish cultivars as potential food colorants. Journal of Food Science, Chicago, v.63, p.219-224, 1998.
INSTITUTO ADOLFO LUTZ. Normas analíticas do Instituto Adolfo Lutz: métodos químicos e físicos para análise de alimentos. 3. ed. São Paulo: Instituto Adolfo Lutz, 1985. 533p.
Caracterização de quatro grupos de jabuticabeira, nas condições de Jaboticabal-SP. Revista Brasileira de Fruticultura, Jaboticabal, v.26, p.482-485, 2004. JOLIVET, C.; BERNASCONI, G. Molecular and quantitative genetic differentiation in European populations of Silene latifolia (Caryophyllaceae). Annals of Botany, London, v.100, p.119-127, 2007.
KAMEI, M.; KOJIMA, T.; HASEGAWA, M.; KOIDE, T.; UMEDA, T.; YUKAWA, T.; TERABE, K. Suppression of tumor cell growth by anthocya-nins in vitro. Cancer Investigation, Bethesda, v.13, p.590-594, 1995.
KOLTUNOW, A.M.; GROSSNIKLAUS, U. Apo-mixis: A developmental perspective. Annual Review of Plant Biology, Palo Alto, v.54, p.547-574, 2003.
KUMAR, A.; KAUL, M.K.; BHAN, M.K.; KHAN-NA, P.K.; SURI, K.A. Morphological and chemical variation in 25 collections of the Indian medicinal plant, Withania somnifera (L.) Dunal (Solanaceae). Genetic Resources and Crop Evolution, Dordrecht, v.54, p.655-660, 2007.
LEES, D.H.; FRANCIS, F.J. Standardization of pigment analyses in cranberries. HortScience, Ale-xandria, v.7, p.83-84, 1972.
LIMA, V.L.A.G.; MÉLO, E.A.; LIMA, D.E.S. Fe-nólicos e carotenoides totais em pitanga. Scientia Agricola, Piracicaba, v.59, p.447-450, 2002.
MATTOS, J.R. Fruteiras nativas do Brasil: jabuti-cabeiras. Porto Alegre: Nobel, 1983. 92 p.
OLIVEIRA, A.L.; BRUNINI, M.A.; SALANDINI, C.A.R.; BAZZO, F.R. Caracterização tecnológica de jabuticabas ‘Sabará’ provenientes de diferentes regi-ões de cultivo. Revista Brasileira de Fruticultura, Jaboticabal, v.25, p.397-400, 2003.
PEREIRA, M.C.T.; SALOMÃO, L.C.C.; MOTA, W.F.; VIEIRA, G. Atributos físicos e químicos de frutos de oito clones de jabuticabeiras. Revista Brasileira de Fruticultura, Jaboticabal, v.22, p.16-21, 2000.
POZO-INSFRAN, D.D.; BRENES, C.H.; TAL-COTT, S.T. Phytochemical composition and pigment stability of açai (Euterpe oleracea Mart.). Journal of Agricultural and Food Chemistry, Easton, v.52, p.1539-1545, 2004.
ROHLF, F.J. NTSYS-pc: numerical taxonomy and multivariate analysis system, version 2.1. New York: Exeter Software, 2000.
SINGH, D. The relative importance of characters affecting genetic divergence. The Indian Journal of Genetics & Plant Breeding, New Delhi, v.41, p.237-245, 1981.
SNEATH, P.H.A.; SOKAL, R.R. Numerical tax-onomy: the principles and practice of numerical clas-sification. San Francisco: W.H. Freeman, 1973. 573p.
TEIXEIRA, L.N.; STRINGHETA, P.C.; OLIVEIRA, F.A. Comparação de métodos para quantificação de antocianinas. Ceres, Viçosa, MG, v.55, p.297-304, 2008.
TEKLEWOLD, A.; BECKER, H.C. Comparison of phenotypic and molecular distances to predict heterosis and F1 performance in Ethiopian mustard (Brassica carinata A. Braun). Theoretical and Applied Genetics, Berlin, v.112, p.752-759, 2006.
THUL, S.T.; LAL, R.K.; SHASANY, A.K.; DA-ROKAR, M.P.; GUPTA, A.K.; GUPTA, M.M.; VERMA, R.K.; KHANUJA, S.P.S. Estimation of phenotypic divergence in a collection of Capsicum
species for yield-related traits. Euphytica, Wagenin-gen, v.168, p.189-196, 2009.