Selection of cotton lines for high oil content
Luiz Paulo de Carvalho(1), Josiane Isabela da Silva Rodrigues(1) and Francisco José Correia Farias(1)
(1)Embrapa Algodão, Rua Oswaldo Cruz, no 1.143, Centenário, CEP 58428-095 Campina Grande, PB, Brazil. E-mail: [email protected],
[email protected], [email protected]
Abstract – The objective of this work was to evaluate the oil content and characters related to fiber quality and yield in cotton lines (Gossypium hirsutum), in order to select genotypes with high oil content and acceptable levels of the other characters. Twenty-two F6 lines and three checks were cultivated in three field trials – two in the municipality of Apodi, in the state of Rio Grande do Norte, and one in the municipality of Barbalha, in
the state of Ceará, both in Brazil. The genetic parameters and the genetic gain from selecting 20% of the lines
were estimated according to their means in each environment and in the group of environments. Regarding oil content, there is genetic variability, and the selection based on the overall mean is indicated, since this character showed high heritability, with 4.58% expected gain. The lines selected with this criterion have oil contents between 23.52 and 24.51%, which are higher than those of the Brazilian cultivar BRS Aroeira with the highest grain oil content (22.04%).
Index terms: Gossypium hirsutum, gain from selection, genotype x environment interaction, indirect selection, seed quality.
Seleção de linhagens de algodão para alto teor de óleo
Resumo – O objetivo deste trabalho foi avaliar o teor de óleo e os caracteres relacionados à qualidade e ao rendimento de fibra em linhagens de algodão (Gossypium hirsutum), para selecionar materiais com alto
teor de óleo e níveis aceitáveis dos demais caracteres. Vinte e duas linhagens F6 e três testemunhas foram cultivadas em três ensaios de campo – dois em Apodi, RN, e um em Barbalha, CE. Os parâmetros genéticos e o ganho com a seleção de 20% das linhagens foram estimados de acordo com suas médias em cada ambiente e no conjunto de ambientes. Quanto ao teor de óleo, há variabilidade genética, e a seleção com base na média geral é indicada, pois, esse caráter apresentou elevada herdabilidade, com ganho esperado de 4,58%. As linhagens selecionadas por este critério apresentam teores de óleo entre 23,52 e 24,51%, superiores aos da cultivar brasileira BRS Aroeira com maior teor de óleo no grão (22,04%).
Termos para indexação: Gossypium hirsutum, ganho de seleção, interação genótipo x ambientes, seleção
indireta, qualidade da semente.
Introduction
Cotton (Gossypium hirsutum L.) is cultivated mainly
due to its fiber, but its seed is an important by-product of processing, since it is the second main source of vegetal oil worldwide (Ashokkumar & Ravikesavan, 2008). Cottonseed oil has several applications in the food, cosmetic and pharmaceutical sectors, and is also widely used as edible oil and raw material for biodiesel.
The edible cotton oil has high thermal stability and a health-beneficial combination of fatty acids, with balanced amounts of omega 3 and 6, as well as vitamins A, D, and E (Ashokkumar & Ravikesavan, 2011). The biodiesel from cotton has high quality, attributed to its high density (0.875 g cm-³), low viscosity (6.00 cSt at
37.8°C), absence of sulfur, low oxygen content (~11%), and higher flammable ability than that of mineral
diesel, besides being non-corrosive (Freire et al., 2009). Therefore, due to its good properties and the high demand for cottonseed oil, the increase in oil content should also be sought in cotton breeding programs, together with yield characters and fiber properties.
or yield characters, there are reports ranging from the absence of correlation to high correlations, with reduced repeatability of the correlations (Turner et al., 1976; Mert et al., 2005; An et al., 2010; Badigannavar, 2010).
Despite the vast literature for cottonseed oil content, very little was done in terms of breeding. In these works, it is important to estimate the main genetic parameters related to the measured characters, genetic correlations, gain with selection for oil content, and the correlated response in the other characters. Studies in this direction are fundamental for the development of new cultivars with high oil content.
The objective of this work was to evaluate the oil content and characters related to fiber quality and yield in cotton lines, in order to select genotypes with high oil content and acceptable levels of the other characters.
Materials and Methods
Twenty-two cotton F6 lines derived from nine
biparental crosses between accessions with high oil content – belonging to the germplasm and elite line bank from the cotton breeding program of Embrapa Algodão –, as well as three checks for high oil content (C-300-91, V3, and 'BRS Aroeira'), were cultivated in three field trials under irrigation. The crosses involved the CNPA BA 2005 8909 x Acala 1.13-3-1, CNPA BA 2005 3008 x 149 FURRS, CNPA GO 2002 2043 x 'BRS Aroeira', CNPA BA 2002 2043 x Acala 1.13-3-1, CNPA BA 2005 3008 x Acala 1.13-3-1, CNPA BA 2003 2059 x Acala 1.13-3-1, CNPA BA 2003 2059 x 149 FURRS, 'BRS Buriti' x Acala 1.13-3-1, and CNPA BA 2005 8909 x 'BRS Aroeira' genotypes, besides the F2 to F5 generations conducted by the genealogical method. Selection was carried out between and within the progenies considering the character seed oil content.
The F6 lines and checks were cultivated in the
municipality of Apodi, in the state of Rio Grande do Norte, from 12/2013 to 12/2014, and in the municipality of Barbalha, in the state of Ceará from 12/2014 onwards. A randomized complete block design was used, with two replicates. The plots were composed of two 5-m rows, with 25 plants in each one. During harvest, 20 bolls were collected in each plot, in order to evaluate seed oil content and the following characters: fiber percentage, one boll weight (g), fiber length or UHM (mm), uniformity (%), short fiber index (%),
resistance (gf/tex), elongation (%), micronaire index (μg pol-1), maturity index (%), and spinning. The seed
oil content was determined by the MQA 7005 low field nuclear magnetic resonance (NMR) system (Oxford Instruments, Abingdon, Oxfordshire, England), using an electromagnet of 0.47 T. The fiber-related characters were determined in the Uster HVI 1000 high-volume instrument (HVI) (Uster Technologies, Uster, Zurich, Switzerland).
The variance of the treatments was decomposed into sources of variation attributed to genotypes, checks, and the contrast genotypes x checks. The effect of genotypes was considered random, and that of environments fixed. The following parameters were estimated from the analysis of variance in each environment: phenotypic and genotypic variances between means; heritability, based on the means of the progenies; ratio between the coefficients of genetic and environmental variations; expected gain with the selection of 20% of the best progenies for oil content; and correlated response in the other characters. These parameters were determined as follows: genotypic variance between means,
σ
g MSG MSR r 2 = −
( ) / ; phenotypic variance between means, σ
f MSG r
2 = / ; heritability based on the means of the progenies, h g f
2 2 2
=σ σ ; coefficient of
genetic variation, CV M
g(%)=100 g g; 2
σ coefficient of environmental variation, CVe(%)=100 e Mg;
2
σ
CV CVg
e= g e
σ2 σ2; ratio; environmental variance,
σe2 =MSR. gain based on the differential of selection,
GSi=(Xsi−Xoi)hi =DS hi i;
2 2 and indirect gain in
character j with selection in character i, GSj i( ) =DSj i( )hj. 2
For these equations, the following definitions were used: MSG, mean square of genotypes; MSR, mean squared residue; r, number of replicates; Mg, overall
mean; Xsi, mean of the individuals selected for
character i; Xoi, original mean of the population for
character i; DSi, selection differential practiced in the
population for character i; hi 2
, heritability based on the mean of the progenies for character i; h2j
, heritability
based on the mean of the progenies for character j; GSi,
gain with direct selection in character i; GSj(i), indirect
gain in character j, with selection in character i; and
DSj(i) , indirect selection differential obtained from the
environmental correlations were estimated for the 11 characters and tested by the test-t.
The joint analysis of variance was also carried out, obtaining the phenotypic, genotypic, and genotype x environment (GxE) interaction variances; heritability; and the ratio between the genetic and environmental coefficients of variation. These parameters were determined as follows:
σg MSG MSR σge er
MSGE MSR
r
e
e
2 = − 2 1
= −
−
; ;
h g MSG er
2 2
=σ / ( / ); CVg(%)=100 σ2g Mg;
CVe(%)=100 σe2 Mg;CV CV
g e = g e
σ2 σ2;
and σe MSR 2 =
.
In these equations, the following definitions were used: MSG, mean square of genotypes; MSGE, mean square of the GxE interaction; MSR, mean squared residue; g, number of genotypes; e, number of environments; r, number of replicates; m, overall mean; and σe
2
, environmental variance.
The percentages of the simple and complex parts of the MSGE between the pairs of environments were calculated according to Cruz & Castoldi (1991). The values of overall mean and heritability were used to estimate the direct gain with the selection of 20% of the best progenies for oil content, and the indirect gain for the other characters was obtained as previously described. All analyzes were processed with the Genes software (Cruz, 2006).
Results and Discussion
The analysis of variance in each environment revealed differences between the oil contents of the 22 F6 lines, except in Apodi, in 2014, where the effect of
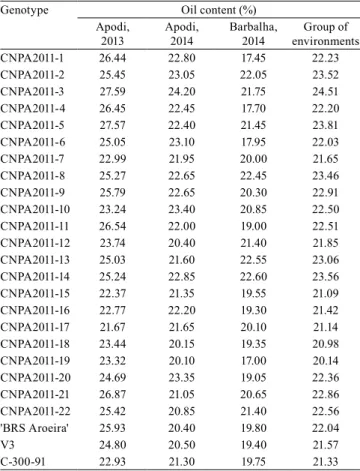
genotypes was not significant (Table 1). In Apodi, in 2013 and 2014, and in Barbalha, in 2014, the variation in oil content between the lines was of 21.67–27.59, 20.1–24.2, and 17.0–22.6%, respectively, whereas, between checks, the variation was of 22.93–25.93, 20.4–21.3, and 19.4–19.8%, respectively (Table 2).
The joint analysis revealed significant contrasts between lines, between lines and checks, and between environments, in addition to GxE interaction for oil content. Among the pairs of environments, the GxE interaction was significant between Apodi, 2013, and Barbalha, 2014, where the percentages of the simple
and complex parts of the MSGE were equal to 8.52 and 91.48%, respectively. Among the main effects, the effect of environments had the greatest contribution to the variation in oil content. The overall mean for oil content varied from 20.14 to 24.51% between lines and from 21.33 to 22.04% between checks. The highest oil contents between lines were observed for CNPA2011-3 (24.51%), followed by CNPA2011-5 (23.81%), and CNPA2011-14 (23.56%), values higher than the 22.04% obtained for 'BRS Aroeira', the check with the highest oil content. Another 11 lines also overcame the oil content of 'BRS Aroeira': CNPA2011-1, CNPA2011-2, CNPA2011-4, CNPA2011-8, CNPA2011-9, CNPA2011-10, CNPA2011-11, CNPA2011-13, CNPA2011-20, CNPA2011-21, and CNPA2011-22.
In the joint analysis, variability was also observed for all the other ten characters evaluated. The effect of environments was significant for most of them, and that of the GxE interaction for fiber percentage and elongation. For these characters, in general, heritability was high, except for uniformity and the short fiber index, for which heritability was median. Among the pairs of environments, the GxE interaction was significant between Apodi, 2013, and Barbalha, 2014, for fiber percentage and elongation; and between Apodi, 2014, and Barbalha, 2014, for elongation, for which the percentages of the simple and complex parts of the MSGE were 29.36 and 70.64%, 13.27 and 86.73%, and 33.87 and 66.13%, respectively. Therefore, for these characters and oil content, the performance of the genotypes changes according to the environment.
Table 1. Individual and joint analysis of variance of the environments and heritability for oil content and other ten agronomic characters in the F6 cotton (Gossypium hirsutum) lines cultivated in Apodi, 2013; Apodi, 2014; and Barbalha, 2014(1).
Source of variation(1) DF Fiber W/1BOLL UHM UNF SFI STR ELG MIC MAT CSP Oil
Apodi, 2013
Treatments 24 4.5** 1.4ns 1.1ns 1.4ns 1.6ns 2.3* 1.3ns 1.8ns 2.2* 1.2 ns 3.9**
Genotypes 21 4.1** 1.3ns 0.7ns 1.1ns 0.9ns 1.8ns 1.2ns 1.9ns 2.3* 0.8 ns 4.2**
Checks 2 5.8** 2.0ns 4.4* 4.4* 9.1** 9.1** 0.2ns 0.2ns 1.9ns 6.2** 3.3ns
Gen. x check 1 10.9** 0.3ns 2.0ns 1.6ns 1.3ns 0.1ns 4.0ns 1.8ns 0.4ns 0.001ns 0.3ns
Residue 24 - - -
-Overall mean - 42.3 6.2 28.1 83.8 7.5 29.6 5.9 5.3 0.9 2,405.9 24.8
Treatments - 42.5 6.2 28.0 83.9 7.4 29.6 5.9 5.3 0.9 2,406.2 24.9
Checks - 41.0 6.1 28.7 83.2 7.9 29.4 5.5 5.1 0.9 2,403.7 24.6
h2 (%) - 75.8 25.9 - 11.2 - 44.0 19.3 47.4 57.1 - 75.9
CV (%) - 2.45 7.4 4.0 1.5 11.5 5.53 8.5 6.3 1.0 10.9 4.8
Apodi, 2014
Treatments 24 3.8** 4.6** 4.2** 3.4** 3.2** 2.8** 2.2* 1.6ns 1.7ns 5.9** 1.2ns
Genotypes 21 3.6** 4.3** 4.0** 2.8** 1.6ns 1.9ns 2.5* 1.6ns 1.8ns 4.3** 1.1ns
Checks 2 7.0** 7.0** 3.8* 6.6** 17.8** 11.2** 0.1ns 0.2ns 0.4ns 12.6** 0.2ns
Gen. x check 1 0.9ns 4.5* 10.2** 10.1** 8.3** 5.2* 0.3ns 3.0ns 2.4ns 24.9** 4.6*
Residue 24 - - -
-Overall mean - 39.7 6.2 29.8 85.5 6.9 31.4 4.9 4.6 0.9 2,928.3 21.9
Treatments - 39.7 6.2 30.0 85.6 6.8 31.6 4.9 4.5 0.9 2,971.5 22.1
Checks - 39.2 6.6 28.6 84.4 7.5 30.1 4.9 4.9 0.9 2,611.3 20.7
h2 (%) - 72.4 76.9 75.1 63.7 36.6 46.8 60.1 37.9 43.2 76.8 12.6
CV (%) - 3.0 6.0 3.3 1.0 7.5 4.9 7.3 9.9 1.3 5.7 6.6
Barbalha, 2014
Treatments 24 6.7** 4.2** 6.8** 3.4** 12.0** 4.0** 7.6** 16.5** 7.4** 4.8** 2.0*
Genotypes 21 5.5** 3.5** 5.7** 2.5* 4.0** 2.6* 8.1** 17.6** 7.6** 2.6* 2.3*
Checks 2 20.5** 11.1** 21.8** 11.1** 82.7** 20.3** 1.5ns 1.9ns 3.5* 25.5** 0.04ns
Gen. x check 1 3.8ns 7.1* 1.2ns 5.6* 40.7** 1.5ns 9.4** 21.4** 10.4** 8.9** 0.6ns
Residue 24 - - -
-Overall mean - 40.5 6.4 29.9 85.4 6.9 30.3 5.2 4.4 0.9 2,904.2 20.1
Treatments - 40.6 6.3 30.0 85.5 6.8 30.4 5.2 4.3 0.9 2,931.7 20.2
Checks - 39.8 6.8 29.6 84.6 7.8 29.6 4.9 4.6 0.9 2,703.0 19.6
h2 (%) - 81.7 71.1 82.4 60.6 74.7 61.6 87.7 94.3 86.9 61.3 55.6
CV (%) - 2.3 5.9 2.9 1.1 4.9 4.8 4.8 3.4 0.7 6.1 7.9
Apodi, 2013; Apodi, 2014; and Barbalha, 2014
Treatments 24 10.6** 6.5** 8.0** 4.5** 7.2** 6.4** 4.3** 3.5** 5.3** 6.2** 3.1**
Genotypes 21 8.9** 5.6** 6.8** 2.6** 2.1** 3.7** 4.4** 3.8** 5.6** 3.2** 3.3**
Checks 2 28.9** 16.7** 22.7** 19.2** 54.1** 35.9** 0.6 0.6 3.0 34.6** 0.4
Groups 1 11.7** 4.8* 2.2 13.4** 19.1** 4.5* 8.6** 2.2 3.9 14.5** 4.2*
Environments 2 27.9** 1.2ns 11.1** 22.7** 5.0* 13.9 33.6** 39.1** 22.4** 47.4** 41.7**
Treat. x env. 48 1.9** 1.4ns 1.4ns 1.4ns 1.0ns 1.3ns 1.5ns 1.2ns 1.3ns 1.5ns 1.7*
Gen. x env. 42 2.0** 1.4ns 1.2ns 1.5ns 1.0ns 1.3ns 1.7* 1.2ns 1.3ns 1.4ns 1.8*
Check x env. 4 0.8ns 0.7ns 1.4ns 0.4ns 0.8ns 1.7ns 0.3ns 0.05ns 0.5ns 1.2ns 1.1ns
Group x env. 2 1.1 2.8ns 5.7** 0.4ns 0.9ns 1.0ns 1.2ns 3.6* 2.4ns 4.1* 0.8ns
Residue 72 - - -
-Overall mean - 40.8 6.3 29.3 84.9 7.1 30.4 5.3 4.7 0.9 2,746.2 22.3
Treatments - 40.9 6.2 29.3 85.0 7.0 30.5 5.4 4.7 0.9 2,769.8 22.4
Checks - 40.0 6.5 28.9 84.1 7.7 29.7 5.1 4.9 0.9 2,572.7 21.6
h2 (%) - 88.7 82.1 85.4 62.2 53.3 72.7 77.4 74.0 82.1 68.3 69.6
CV (%) - 2.6 6.4 3.4 1.2 8.6 5.1 7.2 8.5 1.0 7.5 6.4
(1)Fiber, fiber percentage; W/1BOLL, one boll weight (g); UHM, fiber length (mm); UNF, uniformity (%); SFI, short fiber index (%); STR, resistance (gf/ tex); ELG, elongation (%); MIC, micronaire index (μg pol-1); MAT, maturity (%); CSP, spinning; and Oil, oil percentage; Gen. x checks, genotype versus
should be higher in Apodi, 2013, and in Barbalha, 2014, and lower in Apodi, 2014, due to the low heritability or the greater environmental effect on oil content in this environment.
In addition to the genetic variance, the CVg and the CVg/CVe ratio are parameters used to quantify genetic variability, in order to determine the potential of a population for breeding. The CVg gives an idea about gain proportionality in relation to the mean, and the CVg/CVe>1 ratio indicates a favorable condition for selection and good perspective of genetic gain (Araújo et al., 2014). Heritability expresses the reliability of the phenotypic value as an estimator of the genotypic value, so that the higher the heritability, the greater should be the genetic gain with selection (Falconer & Mackay, 1996; Carvalho et al., 2015).
The genetic correlations between oil content and the other characters showed, in general, low magnitude, expressive variation, and frequent inversion of the
signal, according to the environment (Table 4). The lack of genetic correlation may have resulted from the lack of variation in several characters in Apodi, 2013, and Apodi, 2014, and from the number of evaluated genotypes, since, when the sample size is small, the value of the coefficient of correlation should be close to 1.0 to be significant (Cargnelutti Filho et al., 2010). Considering residual correlations, the environment affected the characters in opposite directions only a few times, as observed in Apodi, 2013, between oil content and the characters one boll weight, uniformity and short fiber index, and in Barbalha, 2014, among oil content and spinning. Some studies with cotton (Dani, 1991; Munawar & Malik, 2013; Erande et al., 2014) report no correlation between oil content and characters related to yield and fiber quality; others, however, show significant correlations (Mert et al., 2005; Qayyum et al., 2010; Badigannavar & Myers, 2015).
The genetic gain with the selection of 20% of the best lines for oil content in each environment and for the overall mean of the lines in the three environments is presented in Table 5. In Apodi, 2013, and Barbalha, 2014, a gain close to 6% is expected in oil content by direct selection, while in Apodi, 2014, the expected gain is only 0.06% due to the low heritability for oil content in this trial. In the selection in Apodi, 2013, and Barbalha, 2014, the selected lines did not coincide with each other, which makes explicit the GxE interaction, which is significant and predominantly complex in this pair of environments. In turn, the gain with selection based on the overall Table 2. Mean oil content of each F6 line and check of cotton
(Gossypium hirsutum) in the three evaluated environments,
from the joint analysis of the environments.
Genotype Oil content (%)
Apodi, 2013
Apodi, 2014
Barbalha, 2014
Group of environments
CNPA2011-1 26.44 22.80 17.45 22.23
CNPA2011-2 25.45 23.05 22.05 23.52
CNPA2011-3 27.59 24.20 21.75 24.51
CNPA2011-4 26.45 22.45 17.70 22.20
CNPA2011-5 27.57 22.40 21.45 23.81
CNPA2011-6 25.05 23.10 17.95 22.03
CNPA2011-7 22.99 21.95 20.00 21.65
CNPA2011-8 25.27 22.65 22.45 23.46
CNPA2011-9 25.79 22.65 20.30 22.91
CNPA2011-10 23.24 23.40 20.85 22.50
CNPA2011-11 26.54 22.00 19.00 22.51
CNPA2011-12 23.74 20.40 21.40 21.85
CNPA2011-13 25.03 21.60 22.55 23.06
CNPA2011-14 25.24 22.85 22.60 23.56
CNPA2011-15 22.37 21.35 19.55 21.09
CNPA2011-16 22.77 22.20 19.30 21.42
CNPA2011-17 21.67 21.65 20.10 21.14
CNPA2011-18 23.44 20.15 19.35 20.98
CNPA2011-19 23.32 20.10 17.00 20.14
CNPA2011-20 24.69 23.35 19.05 22.36
CNPA2011-21 26.87 21.05 20.65 22.86
CNPA2011-22 25.42 20.85 21.40 22.56
'BRS Aroeira' 25.93 20.40 19.80 22.04
V3 24.80 20.50 19.40 21.57
C-300-91 22.93 21.30 19.75 21.33
Table 3. Genetic parameter estimates for the F6 cotton (Gossypium hirsutum) lines in the three evaluated
environments(1).
Environment h2
(%) CVg (%) CVg/ CVe σf
2 σ e 2
, σg
2 σ
ge 2
Apodi, 2013 75.9 5.98 1.3 2.91 0.7 2.21
-Apodi, 2014 12.6 1.78 0.3 1.23 1.07 0.16
-Barbalha, 2014 55.6 6.31 0.8 2.91 1.29 1.62
-Group of
environments 69.6 3.95 0.6 1.12 2.04 0.78 0.55
(1)h2, heritability based on the mean of the progenies; CVg, coefficient
of genetic variation; CVg/CVe, ratio between the coefficients of genetic and environmental variation; σf
2, phenotypic variance for means;
σe 2
, environmental variance for means; σg 2
mean for oil content was about 5%. This gain, which is 1 to 2% lower than those obtained in Apodi, 2013, and Barbalha, 2014, however, was still the most
advantageous, because of the interest in maximizing gain in a greater number of environments. Therefore, since the genetic gain is only slightly lower than the
Table 4. Genetic correlations between oil content and other ten agronomic characters related to yield and fiber quality, from the F6 cotton (Gossypium hirsutum) lines, in the three evaluated environments.
Character(1) Phenotypic correlation Genotypic correlation Correlation of environments
Apodi, 2013 Apodi, 2014 Barbalha, 2014 Apodi, 2013 Apodi, 2014 Barbalha, 2014 Apodi, 2013 Apodi, 2014 Barbalha, 2014
Fiber 0.20ns -0.02ns -0.27ns 0.37ns -1.15ns -0.26ns -0.30ns 0.15ns -0.33ns
W/1BOLLL 0.24ns -0.22ns 0.37ns 0.08ns -3.64ns 0.70ns 0.45* 0.21ns -0.18ns
UHM 0.18ns 0.05ns 0.29ns - 0.25ns 0.50ns 0.30ns 0.06ns -0.12ns
UNF 0.33ns 0.15ns -0.28ns 0.23ns 0.67ns -0.21ns 0.51* 0.15ns -0.40ns
SFI -0.32ns -0.25ns 0.12ns -0.23ns 1.48ns 0.07ns -0.49* -0.39ns 0.21ns
STR 0.31ns 0.13ns -0.16ns 0.33ns 1.27ns -0.02ns 0.33ns 0.06ns -0.35ns
ELG 0.09ns -0.15ns -0.31ns 0.14ns 0.11ns -0.50ns 0.08ns -0.25ns 0.10ns
MIC 0.29ns -0.09ns 0.22ns 0.50ns -0.60ns 0.25ns 0.04ns -0.07ns 0.27ns
MAT 0.27ns -0.03ns 0.26ns 0.46ns -0.22ns 0.45ns -0.06ns -0.02ns -0.12ns
CSP 0.29ns 0.16ns -0.22ns - 0.81ns -0.06ns 0.42ns 0.17ns -0.46*
(1)Fiber, fiber percentage; W/1BOLL, one boll weight (g); UHM, fiber length (mm); UNF, uniformity (%); SFI, short fiber index (%); STR, resistance (gf/tex); ELG, elongation (%); MIC, micronaire index (μg pol-1); MAT, maturity (%); and CSP, spinning. *Significant by the t-test, at 5% probability. nsNonsignificant by the t-test.
Table 5. Prediction of the genetic gain with the selection of 20% of the best cotton (Gossypium hirsutum) lines for oil content
in each environment and based on the overall mean of the environments for the population of 22 F6 lines and the means of
the selected lines.
Character(1) X
o Xs
h² (%) GS GS (%)
Apodi, 2013 24.86 27.14 72.79 1.66 6.68
Selected lines and respective means CNPA2011-3 CNPA2011-5 CNPA2011-21 CNPA2011-11
-Oil percentage 27.59 27.57 26.87 26.54
-Apodi, 2014 22.10 23.51 0.98 0.014 0.06
Selected lines and respective means CNPA2011-3 CNPA2011-10 CNPA2011-20 CNPA2011-6
-Oil percentage 24.20 23.40 23.35 23.10
-Barbalha, 2014 20.18 22.41 52.21 1.17 5.78
Selected lines and respective means CNPA2011-14 CNPA2011-13 CNPA2011-8 CNPA2011-2
-Oil percentage 22.60 22.55 22.45 22.05
-Group of environments 22.38 23.85 69.64 1.02 4.58
Selected lines and respective means CNPA2011-3 CNPA2011-5 CNPA2011-14 CNPA2011-2
-Oil percentage 24.51 23.81 23.56 23.52 4.58
Fiber percentage 40.78 41.70 40.57 41.67 0.56
W/1BOLL 5.98 6.25 6.08 7.30 2.11
UHM 29.55 29.42 30.45 28.18 0.26
UNF 85.22 85.43 83.73 84.92 -0.14
SFI 6.90 6.85 7.52 6.85 -0.01
STR 30.17 33.03 30.37 31.68 1.87
ELG 5.30 5.52 5.23 5.33 -0.29
MIC 4.57 4.65 4.23 5.05 -1.52
MAT 0.88 0.88 0.87 0.89 -0.16
CSP 2816.33 2985.83 2796.17 2692.17 1.3
(1)W/1BOLL, one boll weight (g); UHM, fiber length (mm); UNF, uniformity (%); SFI, short fiber index (%); STR, resistance (gf/tex); ELG, elongation (%); MIC, micronaire index (μg pol-1); MAT, maturity (%); and CSP, spinning.X
o, original mean; Xs, mean of the selected individuals; h
2, heritability
estimates in Apodi, 2013, and Barbalha, in 2014, the strategy to obtain superior genotypes in the region as a whole is most indicated.
Despite the significant GxE interaction, the genotypic component still conferred high heritability to oil content. Therefore, heritability was high and genetic gain was only slightly lower than those estimated in Apodi, 2013, and Barbalha, 2014. Therefore, selection based on the overall mean for oil content should be preferred to selection in each environment.
The high heritability for oil content in the environments evaluated jointly shows that a large part of the phenotypic variance was due to the genotypic variance, which is largely due to the additive variance itself in the F6 generation, since there is almost no
effect of dominance. Both the additive (Azhar & Ajmal, 1999; Khan et al., 2007) and non-additive gene actions (Ahmad et al., 2005; Khan et al., 2007) were reported for oil content in cotton, but the no additive gene action seems to have greater importance (Azhar & Ahmad, 2000; Munawar & Malik, 2013). This shows that selection in advanced generations, as in F6,
is appropriate since the dominance effect is practically non-existent.
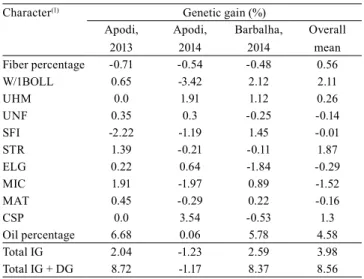
The correlated response in the other evaluated characters, with selection in Apodi, 2013; Apodi, 2014; and Barbalha, 2014, considering the general mean for oil content, is presented in Table 6. The correlated response varied between the environments, ranging from positive to negative except for the characters fiber percentage and fiber length. The indirect gain for the total characters and its sum with the direct gain for oil content were positive in Apodi, 2013, and Barbalha, 2014, but negative in Apodi, 2014. With selection based on the overall mean for oil content, the respective gains were positive and higher than those obtained in each environment. Therefore, for the correlated response, selection for oil content based on the overall mean also seems to be the most feasible. In this case, the indirect gain for the total characters should be positive, but a slight reduction is expected in the characters uniformity, short fiber index, elongation, and micronaire index. The greatest reduction, of -1.52%, is expected in the micronaire index. However, some indirect gain should occur for the characters fiber percentage (0.56%), one boll weight (2.11%), fiber length (0.26%), resistance (1.87%), and spinning (1.3%). These characters may be slightly increased with selection for oil content based on the overall mean. This indirect relationship is important for programs aiming to increase oil content, since yield and fiber quality – mainly with regard to length – are among the most important characters for the cotton crop.
The CNPA2011-2, CNPA2011-3, CNPA2011-5, and CNPA2011-14 lines, selected based on the overall mean for oil content, also presented reasonable means for fiber percentage and one boll weight, as well as fiber properties within the medium fiber cotton standard, with excellent uniformity and micronaire index. In the next few years, these lines should be tested in competition and crop value trials to select a new cultivar. In addition, the selected lines should be crossed with each other and with other accessions with high oil content to start new breeding programs to obtain up to 30% oil content. The importance of this goal is highlighted by the fact that, in Brazil, the variety with the highest oil content – 'BRS Aroeira' – presents about 22% oil in the seed, on average (Freire et al., 2009).
Table 6. Direct and indirect percentage gains with selection
in Apodi, 2013; Apodi, 2014; and Barbalha, 2014, and based
on the overall mean for oil content with the selection of 20%
of the best F6 cotton (Gossypium hirsutum) lines.
Character(1) Genetic gain (%)
Apodi, 2013
Apodi, 2014
Barbalha, 2014
Overall mean
Fiber percentage -0.71 -0.54 -0.48 0.56
W/1BOLL 0.65 -3.42 2.12 2.11
UHM 0.0 1.91 1.12 0.26
UNF 0.35 0.3 -0.25 -0.14
SFI -2.22 -1.19 1.45 -0.01
STR 1.39 -0.21 -0.11 1.87
ELG 0.22 0.64 -1.84 -0.29
MIC 1.91 -1.97 0.89 -1.52
MAT 0.45 -0.29 0.22 -0.16
CSP 0.0 3.54 -0.53 1.3
Oil percentage 6.68 0.06 5.78 4.58
Total IG 2.04 -1.23 2.59 3.98
Total IG + DG 8.72 -1.17 8.37 8.56
Conclusions
1. There is genetic variability for oil content among the F6 cotton (Gossypium hirsutum) lines evaluated.
2. Selection based on the overall mean for oil content is feasible according to the results obtained for heritability and predicted gain with selection.
3. The lines selected by this criterion have medium fiber pattern and overcome the oil content of the Brazilian cultivar, BRS Aroeira, with the highest grain oil content.
4. Selection for high oil content does not appear to compromise fiber yield and quality.
References
AHMAD, R.D.; MALIK, A.J.; HASSAN, G.; KHAN, M.U. Genetic architecture of some quantitative traits of cotton
(Gossypium hirsutum L.). Gomal University Journal of
Research, v.21, p.55-57, 2005.
AN, C.; JENKINS, J.N.; WU, J.; GUO, Y.; MCCARTY, J.C. Use of fiber and fuzz mutants to detect QTL for yield components, seed, and fiber traits of upland cotton. Euphytica, v.172, p.21-34, 2010. DOI: 10.1007/s10681-009-0009-2.
ARAÚJO, B.L.; ARNHOLD, E.; OLIVEIRA JUNIOR, E.A. de; LIMA, C.F. de. Parâmetros genéticos em cultivares de sorgo granífero avaliados em safrinha. Revista Trópica: Ciências Agrárias e Biológicas, v.8, p.51-59, 2014.
ASHOKKUMAR, K.; RAVIKESAVAN, R. Conventional and molecular breeding approaches for seed oil and seed protein content improvement in cotton. International Research Journal of Plant Science, v.2, p.37-45, 2011.
ASHOKKUMAR, K.; RAVIKESAVAN, R. Genetic studies of combining ability estimates for seed oil, seed protein and fibre quality traits in upland cotton (G. hirsutum L.). Research Journal of Agriculture and Biology Sciences, v.4, p.798-802, 2008. AZHAR, F.M.; AHMAD, M. Inheritance pattern of cotton seed oil in diverse germplasm of Gossypium hirsutum L. Pakistan Journal of Biological Sciences, v.3, p.1250-1252, 2000. DOI: 10.3923/pjbs.2000.1250.1252.
AZHAR, F.M.; AJMAL, S.U.K. Diallel analysis of oil content in seed of Gossypium hirsutum L. Journal of Genetics and Breeding, v.53, p.19-23, 1999.
BADIGANNAVAR, A. Characterization of quantitative traits using association genetics in tetraploid and genetic linkage
mapping in diploid cotton (Gossypium spp.). 2010. 153p.
Dissertation (Doctor of Philosophy) – Faculty of the Louisiana State University, Baton Rouge.
BADIGANNAVAR, A.; MYERS, G.O. Genetic diversity, population structure and marker trait associations for seed quality traits in cotton (Gossypium hirsutum). Journal of Genetics, v.94, p.87-94, 2015. DOI: 10.1007/s12041-015-0489-x.
CARGNELUTTI FILHO, A.; TOEBE, M.; BURIN, C.; SILVEIRA, T.R. da; CASAROTTO, G. Tamanho de amostra para estimação do coeficiente de correlação linear de Pearson entre caracteres de milho. Pesquisa Agropecuária Brasileira, v.45, p.1363-1371, 2010. DOI: 10.1590/S0100-204X2010001200005. CARVALHO, L.P. de; ANDRADE, C.C. de; SILVA, G.E.L.; ALENCAR, C.E.R.D.; LIMA, L.H.G. de M.; MEDEIROS, E.P. de; FREIRE, R.M.M.; LIMA, M.M. de A.; BRITO, G.G. de. Óleo de algodão: alternativa para biodiesel. Campina Grande: Embrapa Algodão, 2008. 9p. (Embrapa Algodão. Comunicado técnico, 357).
CARVALHO, L.P. de; FARIAS, F.J.C.; RODRIGUES, J.I. da S. Selection for increased fiber length in cotton progenies from Acala and non-Acala types. Crop Science, v.55, p.985-991, 2015. DOI: 10.2135/cropsci2014.08.0547.
CAVALHO, L.P. de; SILVA, G.E.L.; LIMA, M.M. de A.; MEDEIROS, E.P. de; BRITO, G.G. de; FREIRE, R.M.M. Variabilidade e capacidades geral e específica de combinação para teor de óleo em algodoeiro. Revista Brasileira de Oleaginosas e Fibrosas, v.14, p.19-27, 2010.
CRUZ, C.D. Programa GENES: biometria. Viçosa: Ed. da UFV, 2006. 382p.
CRUZ, C.D.; CASTOLDI, F.L. Decomposição da interação genótipo x ambientes em partes simples e complexa. Revista Ceres, v.38, p.422-430, 1991.
DANI, R.G. Analysis of combining ability for seed oil content in cotton (Gossypium hirsutum L.). Acta Agronomica Hungarica, v.40, p.123-127, 1991.
ERANDE, C.S.; KALPANDE, H.V.; DEOSARKAR, D.B.; CHAVAN, S.K.; PATIL, V.S.; DESHMUKH, J.D.; CHINCHANE, V.N.; KUMAR, A.; DEY, U.; PUTTAWAR, M.R. Genetic variability, correlation and path analysis among different traits in desi cotton (Gossypium arboreum L.). African Journal of Agriculture Research, v.9, p.2278-2286, 2014. DOI: 10.5897/ AJAR2013.7580.
FALCONER, D.S.; MACKAY, T.F.C. Introduction to
quantitative genetics. 4th ed. New York: Longman, 1996. 464p. FREIRE, E.C.; BELTRÃO, N.E. de M.; VALE, D.G. Cultivar BRS Aroeira (elevado teor de óleo) e o seu manejo cultural. 2.ed. Campina Grande: Embrapa Algodão, 2009. 1 folder. KHAN, N.U.; HASSAN, G.; KUMBHAR, M.B.; PARVEEN, A.; UM-E-AIMAN; AHMAD, W.; SHAH, S.A.; AHMAD, S. Gene action of seed traits and oil content in upland cotton (Gossypium hirsutum L.). Journal of Breeding and Genetics, v.39, p.17-29, 2007.
KHAN, N.U.; MARWAT, K.B.; HASSAN, G.; FARHATUKKAH, S.; BATOOL, S.; MAKHDOOM, K.; AHAMAD, W.; KHAN, H.U. Genetic variation and heritability for cotton seed, fiber and oil traits in Gossypium hirsutum L. Pakistan Journal of Botany, v.42, p.615-625, 2010.
MERT, M.; AKISCAN, Y.; GENÇER, O. Genotypic and phenotypic relationships of lint yield, fibre properties and seed content in a cross of two cotton genotypes. Acta Agriculturae Scandinavica, Section B – Soil and Plant Science, v.55, p.76-80, 2005. DOI: 10.1080/09064710510008649.
MUNAWAR, M.; MALIK, T.A. Correlation and genetic architecture of seed traits and oil content in Gossypium hirsutum L. Journal of Plant Breeding and Genetics, v.1, p.56-61, 2013.
QAYYUM, A.; MURTAZA, N.; AZHAR, F.M.; IQBAL, M.Z.; MALIK, W. Genetic variability and association among oil, protein and other economic traits of Gossypium hirsutum L. in F2 generation. Journal of Agriculture Research, v.48, p.137-142, 2010.
TURNER, J.H.; RAMEY, H.H.; WORLEY, S. Influence of environment on seed quality of four cotton cultivars.
Crop Science, v.16, p.407-409, 1976. DOI: 10.2135/
cropsci1976.0011183X001600030023x.