Apparent digestibility coefficient of feed ingredients for
juvenile meagre
( Argyrosomus regius, Asso 1801)
Carla Patrícia Rodrigues Olim
Dissertação
Mestrado em Recursos Biológicos Aquáticos
Porto
ii
Faculdade de Ciências da Universidade do Porto
Mestrado em Recursos Biológicos Aquáticos
Apparent digestibility coefficient feed ingredients for
juvenile meagre
( Argyrosomus regius, Asso 1801)
Carla Patrícia Rodrigues Olim
Study supervised by:
Prof. Dr. Aires Oliva Teles
Drª. Helena Peres
Thesis submitted in partial fulfillment of the requirements for the degree of Master of Science in Aquatic Biological Resources
Porto
2012
iii
Faculdade de Ciências da Universidade do Porto
Mestrado em Recursos Biológicos Aquáticos
Carla Patrícia Rodrigues Olim
Thesis submitted in partial fulfillment of the requirements for the degree of Master of Science in Biological Aquatic Resources
defended on .../.../...
Committee Chair
____________________________
iv
v
“Life is so beautiful that death has fallen in love with it, a jealous, possessive love that grabs at what it can. But life leaps over oblivion lightly, losing only a thing or two of no importance and gloom is but the passing shadow of a cloud...” Yann Martel, Life of Pi
vi
Acknowledgements
I would like first to express my gratitude to my supervisors, Dr. Aires Oliva Teles and Dr. Helena Peres, for their support, guidance and encouragement throughout the project. I would also like to acknowledge the researchers from Fish Nutrition Laboratory- FCUP, for providing funding support for this project.
My thanks to my friends, too many to mention be name, who were always supportive and kept me smiling.
My special thanks also go to my whole family, whose support and encouragement was indispensable for this accomplishment. My final thanks go to my parents, your unconditional love and constant support and encouragement is so treasured.
vii
Abstract
To date, there is still no information available on digestibility of nutrients in various feed ingredients for juvenile meagre. This information is especially needed in order for allow effective formulation of diets to minimize production cost and waste production. Apparent digestibility coefficients (ADCs) of dry matter (DM), crude protein (CP) and gross energy (GE) in fish meal (FM), soybean meal (SMB), canola meal (CAM), sunflower meal (SM), wheat flour (WF), corn meal (CM), faba bean meal (FBM), wheat gluten meal (WGM), corn gluten meal (CGM) and pea protein concentrate (PPC) were measured for meagre. Also, it was determined the starch digestibility of raw starch, gelatinized starch and starch from starch-rich plants (faba bean meal, corn meal and wheat flour). The ADCs were determined using a reference diet (RF) and test diets (70% RF diet plus 30% of tested ingredients) containing 1% chromic oxide as an external marker.
Crude protein digestibility coefficients were high and significantly (P<0.05) different among test ingredients. The crude protein ADC was highest for corn meal (99.6%) and lowest for corn gluten meal (89.0%). Apparent digestibility for energy were higher in fish meal (93.8%), wheat gluten meal (91.4%) and pea protein concentrate (91.3%) (P<0.05) than in the other ingredients. The ingredients tested with high carbohydrate had the lowest energy digestibility, with raw starch having the lowest value (30.7%) (P<0.05). The ADCs of DM were also lower in the ingredients high in carbohydrate, ranging from 41.7 % (RS) to 90.9% (WGM). Starch digestibility was low for faba bean meal (43.5%), corn meal (56.5%), wheat flour (60.0%) and raw starch (52.7%). On the other hand, meagre digested well the gelatinized starch included in the reference diet (95.1%).
This study showed that protein concentrates were well digested and that meagre has very limited capacity to digest raw starch.
viii
Resumo
Até à data não existem informações disponíveis sobre a digestibilidade de nutrientes das matérias-primas utilizadas em aquacultura para a corvina. Esta informação é especialmente importante para a corvina no exercício da substituição eficaz de matérias-primas e minimização tanto do custo de produção como da produção de resíduos.
Os coeficientes de digestibilidade aparente (CDA) da matéria seca (MS), proteína bruta (PB) e energia bruta (EB) em farinhas de peixe (FM), soja (SMB), canola (CAM), girassol (SM), trigo(WF), milho (CM), fava (FBM), glúten de trigo (WGM), glúten de milho (CGM) e concentrado protéico de ervilha (PPC) foram determinados para corvina. Além disso, foi determinada a digestibilidade do amido de milho nativo (RS), de amido de milho gelatinizado e de plantas ricas em amido (farinha de fava, farinha de milho e farinha de trigo). Os CDAs foram determinados utilizando uma dieta de referência (RF) e onze dietas de teste (incluindo 70% da dieta RF mais 30% de ingredientes testados) e contendo óxido de crómio a 1% como um marcador externo. Os coeficientes de digestibilidade aparente da proteína dos ingredientes testados foram altos e significativamente diferentes (P <0.05). Os valores máximos e mínimos de CDA de proteína bruta foram para a farinha de milho (99.6%) e para o glúten de milho (89.0%). Os valores de CDA de energia foram maiores em farinha de peixe (93.8%), glúten de trigo (91.4%) e concentrado proteico de ervilha (91.3%) (P <0.05). Os ingredientes testados com hidratos de carbono na sua constituição revelaram valores de CDA de energia mais baixos, sendo o amido nativo o que revelou menor valor (30.7%) (P <0.05). Além disso, os CDAs de matéria seca foram menores nos ingredientes testados com de hidratos de carbono, este valor variou entre 41.7% (RS) e 90.9% (WGM). A digestibilidade do amido foi baixa para farinha de fava (43.5%), farinha de milho (56.5%), farinha de trigo (60.0%) e o amido nativo (52.7%). Por outro lado, acorvina digeriu bem o amido gelatinizado incluído na dieta de referência (95.1%). Este estudo mostrou que os ingredientes com concentrados proteicos vegetais são bem digeridos e que a corvina parece ter uma capacidade muito limitada para digerir amido nativo.
ix
Abbreviations and Acronyms
ADC(s) Apparent Digestibility Coefficient(s) ANF Antinutritional Factor(s)
CAM Canola Meal Diet CGM Corn Gluten Meal Diet CM Corn Meal Diet
CP Crude Protein
DHA Docosahexaenoic Acid DM Dry Matter
EFA Essential Fatty Acid(s) EPA Eicosopentaenoic Acid FBM Faba Bean Meal FM Fish Meal Diet GE Gross Energy
HUFA Highly Unsaturated Fatty Acids IAA Indispensable Amino Acids N Nitrogen
NSP Non Starch Polysaccharides P Phosphorus
PPC Pea Protein Concentrate Meal PUFA Polyunsaturated Fatty Acids RD Reference Diet
RS Raw Starch Diet SBM Soybean Meal Diet SGR Specific Growth Rate
x SM Sunflower Meal Diet
WF Wheat Flour Diet
xi
Table of contents
Acknowledgements ... vi
Abstract ... vii
Resumo ... viii
Abbreviations and Acronyms ... ix
Table of contents ... xi
List of Figures ... xiii
List of Tables ... xiv
Chapter 1. Introduction ... 1
1.1. World and European aquaculture ... 1
1.1.1. General ... 1
1.1.2. European Aquaculture ... 1
1.2. Meagre ( Argyrosomus regius, Asso 1801) ... 2
1.3. Fish Nutrition ... 4
1.3.1. Protein and amino acids... 4
1.3.2. Lipids ... 5
1.3.3. Carbohydrates ... 6
1.3.4. Vitamins... 8
1.3.5. Minerals ... 8
1.4. Feedstuffs used in aquafeeds ... 9
1.4.1. Fish Meal ... 9
1.4.2. Alternative feedstuffs for aquaculture ... 10
1.4.2.1. Soybean ... 10 1.4.2.2. Canola ... 11 1.4.2.3. Sunflower ... 12 1.4.2.4. Wheat ... 13 1.4.2.5. Corn ... 13 1.4.2.6. Peas ... 15 1.4.2.7. Faba beans ... 15
xii
1.5. Digestibility... 17
1.6. Aquaculture and the Environment ... 21
1.7. Objectives of the current study ... 23
Chapter 2. General material and methods ... 24
2.1. Experimental animals ... 24 2.2. Experimental facilities ... 24 2.3. Diets ... 24 2.4. Digestibility trial ... 28 2.5. Analytical methods ... 28 2.5.1. Moisture ... 28 2.5.2. Ash ... 29 2.5.3. Crude Protein ... 29 2.5.4. Crude Fat ... 29 2.5.5. Gross Energy ... 29 2.5.6. Starch ... 29 2.5.7. Chromic oxide ... 30
2.6. Apparent digestibility coefficient (ADC) formulas ... 30
2.7. Statistical analyses ... 31 Chapter 3. Results ... 32 3.1. Diets Digestibility ... 32 3.2. Feedstuffs Digestibility ... 34 Chapter 4. Discussion ... 37 Chapter 5. Conclusion... 44 Chapter 6. References ... 45
xiii
List of Figures
Figure 1.1.Meagre, Argyrosomus regius, Asso 1801……….3 Figure 1.2. Guelph settling column system (Cho et al., 1982)………19
xiv
List of Tables
Table 1.1. Estimated protein requirements of some juvenile finfish……….5
Table 1.2. Alternative feedstuffs and their corresponding antinutritional factors……...17
Table 2.1. Reference and experimental diets formulations for determination of digestibility coefficients in meagre………..25
Table 2. 2. Proximate composition (dry matter basis) of test ingredients (n=3)……….26
Table 2. 3. Proximate composition (dry matter basis) of the reference and experimental diets (n=3)………27
Table 3. 1. Apparent digestibility coefficients (%) for dry matter, crude protein, starch and gross energy of experimental and reference diet for meagre………34
Table 3. 2. Apparent digestibility coefficients (%) of dry matter, crude protein, starch and gross energy of test ingredients for meagre………..36
1
Chapter 1. Introduction
1.1. World and European aquaculture
1.1.1. General
Aquaculture production is growing rapidly around the world. Since 1970 aquaculture production has been growing at an average annual rate of 8.8 percent (Tacon et al., 2006). A total of 142 million tonnes of fish (molluscs, marine fish, freshwater fish, crustaceans, etc.) were produced or harvested by the aquaculture and capture fishery industries in 2008 (FAO 2010). According to FAO, in 2008 an estimated 115 million tonnes of food-fish from capture fisheries and aquaculture were consumed, an all-time-high average of 17 kilos per capita. The contribution of aquaculture to the total production of capture fisheries and aquaculture continued to grow, rising from 34.5 percent in 2006 to 36.9 percent ( 52.5 million tons) in 2008 (FAO 2010).
The value of the world aquaculture harvest, 52.5 million tonnes, is estimated at US$ 98.4 billion in 2008 (FAO 2010). China is the largest single producer with reported 32.7 million tonnes, or 62% of global aquaculture production. Asia (excluding China) has retained its progressively dominant position in world aquaculture production, 26.1%, while America (4.60%), Europe (4.50%) and Africa (1.80%) account for the remaining major globe aquaculture producing regions by quantity (FAO 2010). Production from aquaculture is mostly destined for human consumption. In the last decades, capture fisheries production are being exploited to their maximum, 80-100 million tonnes. Population growth and demand for fishery products will continue increase and the only way to respond is to turn to the culture of aquatic organisms.
1.1.2. European Aquaculture
As in the rest of the world, aquaculture is European’s fastest growing primary industry. In 2008, European fish and shellfish farmers produced some 2.5 million tons worth US$9.4 billion, with an average value of US$3.73kg (FAO 2010a). Norway has by far the greatest impact on European aquaculture production, 33.2%, followed by UK (10.2%), France (8.7%), Italy (8.6%), Greece (5.8%) and Spain (5.5%) (FAO 2010).
2 The average annual growth for this period for marine and brackish water aquaculture is estimated at 1.7% (FAO 2010). Between 1990 and 2008, freshwater aquaculture production dropped from about 730 000 tonnes to 550 000 tonnes. In comparison, marine aquaculture increased from 810 000 tonnes to 1.9 million tonnes (FAO 2010). FAO and FishStat Plus, recorded the production data of over 120 species. However, European fish culture continues to be dominated by salmonids, seabass, seabream and common carp. Atlantic salmon was the most important species (37%), followed by rainbow trout (12%), sea mussel (7%), blue mussel (7%) and common carp (6%). Marine fish have seen a significant increase over the last 10 years, the two leading species, seabream and seabass, contributing now for 7.4% of total production. Europe is considered a world leader in the production of some high value species (European seabass, gilthead seabream, salmonids, and turbot) and contributes significantly to global aquaculture development through knowledge.
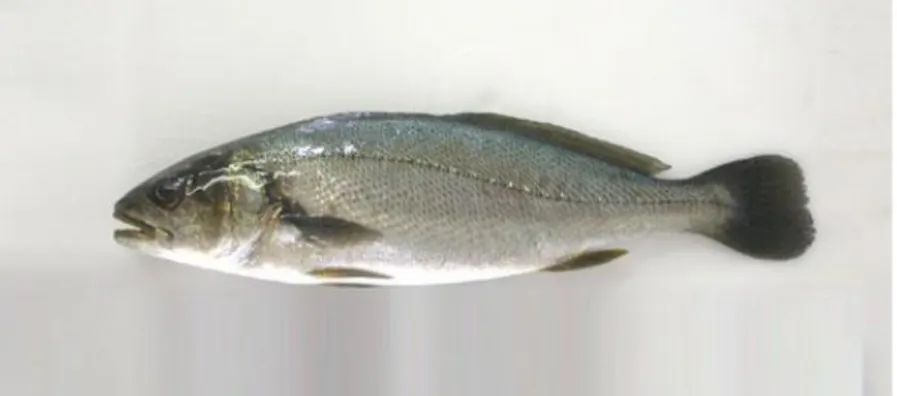
1.2. Meagre (Argyrosomus regius, Asso 1801)
Meagre (figure 1.1) belongs to the family Sciaenidae (Order Perciformes, Class Actinopterygii), it is a euryhaline fish which is found in subtropical climates (65ºN-6ºS, 23ºW-36ºE) in the eastern Atlantic (from Norway to Senegal) and also in the Mediterranean Sea and Black Sea (Fishbase). The species inhabits in inshore and shelf waters close to the bottom, as well as in surface and midwaters from 15m to about 200m depth (Whitehead et al., 1986). Length can go from 40-50 cm up to 2m long, with weights up to 55 kilograms. During reproduction adult meagre comes to estuaries in order to spawn (anadromous migration) (Monfort, 2010).
Meagre is a gonochoristic species with spawning taking place from May to July in estuaries and females can lay up to 800 000 eggs (Monfort, 2010). A.regius is a carnivorous fish, and juveniles eat small demersal fish and crustaceans while adult meagre (30-40cm) feeds on pelagic fish and cephalopods (Fishbase, 2010; Monfort, 2010). In England it is called meagre, in France maigre, in Spain corvine, in Portugal corvina-legítima and in Greece mylokope.
The meagre is a suitable candidate species for diversification of aquaculture in the Mediterranean region (Quéméner et al., 2002) which nowadays, is based almost only in the gilthead seabream (Sparus aurata) and European seabass (Dicentrarchus
3 between Italian and French producers, with the first commercial production in 1997 in France. Global production on the northern bank of Mediterranean Sea is estimated at 2500 to 3000 tonnes (Monfort, 2010). The world production of Sciaenidae was worth $80 million in 2007.
Figure 1.1. Meagre, Argyrosomus regius, Asso 1801.
According to FAO (2009a) Spain has the highest production of meagre in the Mediterranean region. The Scianidae species with 40-50 grams in aquaculture conditions showed high daily growth rates of 3% per day with survival ranging from 60 to 100% (Cárdenas, 2010). Also, it grows well in a wide range of salinities (5-45g/L), however, best growth was registered in low salinities (<36g/L) than in marine waters (Muñoz et al., 2008). The Scianidae species take a year to reach commercial size (800-1000g), well above the serving size of sea bream and sea bass (300g), when temperatures are optimal for growth, between 17 to 21ºC. The low whole-body lipid content gives to meagre the status of lean fish. To maintain growth rates (SGR) of 1% per day during on-growing, Scianidae need diets with high protein content- 44% (McGoogan and Gatlin III, 1999; Lee et al., 2001; Turano et al., 2002; Martinez et al., 2008, 2011; Pirozzi et al., 2010). The usual animal proteins (essentially fish meal) in feeds for Scianidae can be partially replaced by plant proteins without compromising performance (Segato et al., 2005), or qualities of the fillet (Segato et al., 2008).
Panagiotidou et al. (2007) and Chatzifotis et al. (2010) mentioned that during on-growing optimum dietary lipids in the diet are 17% and recommend that dietary lipid content exceeding 17% should be avoided. The price of a kg of meagre in 2007 was € 4.48, with a total gain of production in 2007 of € 3,628,800 (APROMAR, 2009).
Due to its recent introduction in the aquaculture industry, little is known about nutritional requirements, diets and ingredients digestibility and the utilization of alternative feed ingredients to replace fishmeal in meagre aquafeeds. Currently, diets
4 used for meagre production are the same formulated for gilthead seabream or seabass.
1.3. Fish Nutrition
1.3.1. Protein and amino acids
Protein is the largest component of carnivorous fish diets and it is the most costly. In fish, proteins and their constituent amino acids play significant roles in various functions of the organism, including growth processes and cell renewal (Garcia
et al., 2000). Generally, protein requirements for growing finfish are typically between
35-55% of total dietary intake (Rahnema et al., 2005; Trushenski et al., 2006; Kaushik and Seiliez 2010). The estimated protein requirements of several juvenile fish are summarized in Table.1. The values are expressed as percentage of dry diet. As previously mentioned, the protein requirement for meagre was estimated at about 47% (Martinez et al., 2011), a value that is similar to those reported for other carnivorous species listed in the Table 1.1. The protein requirements, as a proportion of the diet, decreases as fish grows. The optimal dietary protein level varies with fish species, life stage, dietary protein quality, dietary amino acid composition and quantity of non-protein energy.
Fish do not have a true protein requirement but require a balanced combination of essential (EEA) and nonessential amino acids. Protein in fish tissues is formed from all 20 major amino acids, but 10 amino acids cannot be synthesized and must be provided in the diet. The 10 EEA are: arginine, histidine, isoleucine, leucine, lysine, methionine, threonine, tryptophan, phenylalanine and valine (NRC, 2011).
To date there is no published information on the requirements of essential amino acids for meagre. However, in another Scaniedae species, the red drum, Moon and Gatlin III (1991) determined the requirement of the 10 essential amino acids. In general, the requirement of EAA is higher than in gilthead seabream or European seabass. Carcass amino acid patterns of fish generally correlate well with the quantitative amino acids requirement profile (Mambrini and Kaushik, 1995). This makes fish meal the most appropriate protein and amino acids source for fish diets (Tacon, 1994; Tacon, 1995a). However, fish meal is a limited resource and in recent decades the search of alternative protein feedstuffs has been a priority.
5 Table 1.1. Estimated protein requirements of some juvenile finfish.
Species Protein Source Estimated
requirement (%) Reference Asian sea bass
(Lates calcarifer) Casein, gelatin 45
Boonyaratplin (1991) Atlantic Salmon
(Salmo salar) Fish meal 55
Grisdale-Helland and Helland (1997) European sea bass
(Dicentrarchus labrax) Fish meal 50
Hidalgo and Alliot (1988) Florida pompano
(Trachinotus carolinus)
Fish meal, soy
meal 45 Lazo et al., 1998
Gilthead seabream (Sparus aurata)
Casein, FPC,
amino acids 40
Sabaut and Luquet (1973) Largemouth bass
(Micropterus salmoides) Casein 40
Anderson et al., 1981* Meagre
(Argyrosomus regius) Fish meal 47 Martinez et al., 2011 Mulloway
(Argyrosomus
japonicus)
Fish meal 44- 49 Pirozzi et al., 2010
Rainbow trout
(Oncorhynchus mykiss) Casein, gelatin 40 Zeitoun et al., 1973 * Red drum (Sciaenops ocellatus) Fish meal, casein 35- 45 Daniels and Robinson (1986); McGoogan and Gatlin (1998) Red sea bream
(Pagrus major) Casein 55 Yone (1976)
*
Yellowtail
(Seriola quinqueradiata) Fish meal 55 Takeda et al., 1975 *
*
Data extracted from Wilson (2002).
1.3.2. Lipids
Lipids play an important role in almost every physiological process, such as growth, health and reproduction (Sargent et al., 2002; Tocher, 2003). Lipids provide essential fatty acids (EFA) and energy to the fish. This energy source is particularly important in fish that have a restricted ability to use complex carbohydrates for energy (NRC, 2011) and also contributes to effective utilization of dietary protein, sparing it for growth purpose (Watanabe, 1982). Lipids also have other important nutritional
6 functions such, as to assist in the absorption of fat-soluble vitamins, be precursors for the synthesis of various functional metabolites such as eicosanoids and are components of hormones. Lipids also have a fundamental role in the maintenance of cell membrane structure and function.
Fish, like all other vertebrates, cannot synthesize de novo the polyunsaturated fatty acids (PUFA) linoleic (18:2n-6) and linolenic acids (18:3n-3) (Sargent et al., 2002). These must therefore be supplied in the diet to satisfy the requirements for normal growth and development (NRC, 2011). Fish PUFA requirements are linked to the ability of elongation and desaturation of fatty acids of 18-carbon. Freshwater fishes can convert polyunsaturated fatty acids to longer chain, highly unsaturated fatty acids (HUFA). However, marine fish are not able to do so, due to the absence or low activity of enzymes involved in this process (Yamada et al., 1980; Watanabe, 1982). Therefore, marine fish require HUFA in their diets, such as eicosopentaenoic acid (EPA, 20:5n-3) and docosahexaenoic acid (DHA, 22:6n-3) (Tocher, 2003). For several species of freshwater and salmonids fishes, the essential fatty acids requirements can be met by levels of PUFA of 1% or 0.4-1.0% HUFA of the dry weight of the diet (Sargent et al., 2002). In general, marine fish species such as red drum, sea bass, turbot and silver bream require up to 1% of HUFA (Sargent et al., 2002), however other species such gilthead sea bream, may require higher levels, 1.9% (Ibeas et al., 1994).
Dietary lipids levels are usually correlated with the levels of lipid in the carcass of fish (Cowey, 1993). High levels of lipids in the diets can be a seriously problem in fish that tend to store lipid in muscle and visceral cavity, with negative effects in performance, product quality and shelf life (NRC, 2011).
The adequate lipid level for meagre was estimated at about 17% of the diet (Chatzifotis et al., 2010), a value similar to that established for other marine fish species, such seabass (Alliot et al., 1974), gilthead seabream (Vergara et al.,1996a) and red drum (McGoogan and Gatlin III, 1998).
1.3.3. Carbohydrates
Fish do not have a specific dietary requirement for carbohydrates, but carbohydrates are an inexpensive source of chemical energy. Inclusion of carbohydrates in fish feeds spares both protein and lipid (Trushenski et al., 2006), though results maybe variable according to fish species and dietary carbohydrate source (Kaushik,
7 1999). Carbohydrates are components of feedstuffs, such as cereals (e.g. wheat, corn) and pulses (peas, faba beans), whereas starch constitute the major carbohydrate component.
Carbohydrate digestion and capacity to use it is species dependent with carnivorous fish being less able to utilize them than omnivorous and herbivorous species (Krogdhal et al., 2005). In general, carbohydrate inclusion in carnivorous fish diets is limited to 20% (Hardy, 1991; NRC, 2011). However, warm-water omnivores can use diets containing as much as 40% dietary carbohydrate because they have higher intestinal amylase activity (Dabrowski and Guderley, 2002).
Digestion of dietary starch in fish is highly variable depending on fish species, carbohydrate source, physical state of the molecule and processing (Wilson, 1994; Krogdahl et al., 2005). Advances in carbohydrate processing, such as applying heat treatment, improves digestibility and increases dietary digestible energy supply (Kaushik, 1999; Drew et al., 2007). Bergot and Breque (1983) showed that starch gelatinization has a positive effect on starch digestibility and growth of rainbow trout. In general, processed starch has higher digestibility than raw starch (Bergot and Breque, 1983; Jeong et al., 1992; Hertrampf and Piedade-Pascual, 2001; Peres and Oliva-Teles, 2002).
Feeding diets containing high levels of digestible carbohydrates usually increase feed intake in rainbow trout (Hilton et al., 1983) and European seabass (Perez et al., 1997) and have associated increased glycaemia (McGoogan and Reigh, 1996). Fish are considered to have high plasma glucose tolerance compared to mammals, as wide fluctuations of blood glucose levels are normally found (Dabrowski and Guderley, 2002), with carnivorous species showing more persistent hyperglycaemia than omnivorous fish (Médale et al., 1998). Excessive amounts of carbohydrates in fish diets also increase liver size and glycogen deposition in salmonids (Arnesen et al., 1995; Kim and Kaushik, 1992).
Fibre comprises cellulose, hemicellulose, and other non starch polysaccharides (NSP) (NRC, 2011). These components occur in natural diets of herbivorous and omnivorous fish but not of carnivorous fish (Krogdahl et al., 2005). Fish cannot digest fibre due to the lack of the enzyme cellulase and NSPases, thus only the presence of intestinal microbiota may partially digest it (Dabrowski and Guderley, 2002). Excessive fibre in fish feeds has been shown to increase faecal output and reduce nutrient
8 utilization (NRC, 2011). Nevertheless, cellulose and hemicellulose have been used as binders and provide physical stability to the pellet (NRC, 2011). In general, fish species can tolerate up to 8% of fibre in their diets (NRC, 2011).
1.3.4. Vitamins
Vitamins are a group of organic compounds essential for growth, health and normal function in animals, that are required in small amounts and that have no structural functions or are used for energy purposes (NRC, 2011). Vitamins cannot be synthesized by the animal or are synthesized at a rate insufficient to meet animal needs (Tacon, 1987). Vitamins are divided in two groups based on solubility; the water-soluble vitamins (ascorbic acid, biotin, choline, folic acid, inositol, niacin, pantothenic acid, pyridoxine, riboflavin, thiamine and vitamin B12) and the fat-soluble vitamins (vitamin A, D, E, and K) (Halver, 2002). The fat-soluble vitamins are absorbed in the intestine along with dietary fats and are stored by the animals if dietary intake exceeds metabolic needs (Tacon, 1987; Halver, 2002; NRC, 2011). In contrast, the water-soluble vitamins are not stored in appreciable quantities in the animal body and excess vitamins are excreted (Tacon, 1987).
Fifteen vitamins have been shown to be essential in fish diets, 11 water-soluble and 4 fat-soluble vitamins, but the minimum requirements for all vitamins have been established for only a few species, such as channel catfish, common carp, seabream, trout, Nile tilapia (Halver, 2002; NRC, 2011). In addition, vitamin requirements are influenced by size, age, growth rate, nutrient interrelationships and environmental factors (NRC, 2011). The symptoms of deficiency for various vitamins in fish include reduced growth, lethargy, anaemia, scoliosis, hemorrhages and mortality (Halver, 2002; NRC, 2011). Vitamins are usually added to the feeds in the form of premixes at a rate of about 1-2% of total ingredients. This gives a margin of safety for losses associated with processing and storage. Therefore, more studies are needed to determine vitamin requirement of fish.
1.3.5. Minerals
Fish require inorganic elements for tissue formation, osmoregulation and other metabolic functions (Lall, 2002). Fish have the capacity to absorb some minerals not only from the diets but also from the water in which they live (Lall, 2002; NRC, 2011).
9 As salt water has a much higher mineral content than freshwater, mineral deficiencies are less likely to occur in fish reared in salt water. However, the exchange of ions from the aquatic environment across gills and skin of fish compromise the quantification of mineral requirements. Dietary requirements have been established for macro minerals (calcium, phosphorous, magnesium, chloride, sodium, potassium and sulfur) and for microminerals (cobalt, chromium, copper, iodine, iron, manganese, selenium and zinc) of a limited number of species (Lall, 2002; NRC, 2011). Dietary deficiencies of most minerals in fish include reduced growth rate, poor feed efficiency, bone demineralization, skeletal deformity, anorexia, erosion of fins, muscular dystrophy and thyroid hyperplasia (Tacon, 1987; Lall, 2002; NRC, 2011). Further, some microminerals are potentially toxic when present in amounts above the requirement (NRC, 2011). Also, mineral supplements in fish diets, particularly phosphorous, can contribute to environmental eutrophication (Lall, 2002; NRC, 2011). Like vitamins, minerals are added to the diets as mineral premix at a rate of about 1-2% of the total ingredients.
1.4. Feedstuffs used in aquafeeds
1.4.1. Fish Meal
Fish meal is generally considered to represent the “gold standard” dietary protein source for carnivorous fishes (Drew et al., 2007). Fish meal is a highly nutritious feedstuff primarily used as high quality protein source as it has an excellent amino acid profile, it is very palatable, has high a nutrient digestibility, is a rich source of energy, essential fatty acids (EFA), vitamins and minerals and has low levels of antinutritional factors (Gatlin et al., 2007; NRC, 2011). However, the chemical composition of fish meal may vary significantly depending on the source of fish used for its production (Hertrampf and Piedad-Pascual, 2001). The production of fish meal has been stabilized over the past 15 years at about 7 million metric tonnes (FAO, 2010). According to FAO (2010) the aquaculture sector is at present the biggest consumer of fish meal, with a share of 46% of total fish meal produced. The production of fish meal used in traditional fish feeds has decreased gradually, whereas its share in aquaculture has increased. For instance, the El Niño, which occurred in 1998, caused a dramatic decline in Southern hemisphere catches and consequently reduced the global production of fish meal.
10 Fish meal and fish oil are important components of the feeds for many farm-raised species, from pigs and poultry to farmed fish. As ingredients in aquaculture feeds, fish meal and fish oil supply essential amino acids and fatty acids required for normal growth of cultured species including carp, salmon, tilapia, trout, catfish, shrimp, and others. However, the relatively high cost of fish meal due to growing demand for this product as well as pressure on the wild fisheries that supply these products are adding up to make alternative feeds one of the top issues facing the global aquaculture industry, fuelling research on suitable alternative feed ingredients.
1.4.2. Alternative feedstuffs for aquaculture
In last decades, the high cost of fish meal, its restricted availability and the market unpredictability, increased the need for searching alternative sources of protein in fish feed. The rapid growth of aquaculture production has been accompanied by innovation of aquafeed production. Feedstuffs with high protein content that can currently be used to replace fish meal in aquafeeds are very limited. The most commonly used alternative protein sources are plants feedstuffs, which include cereal grains, oilseeds and pulses, that traditionally have been used as protein or energy concentrates as well as novel products developed through various processing technologies.
1.4.2.1. Soybean
Soybean, Glycine spp Linnaeus, is the most commonly used protein source of plant origin. Soybean meal is by far the most commonly available feed ingredient with global production of 258.4 million metric tonnes in 2010 (Soy Stats®). Soybean meal is the by-product obtained after removal of oil from soybeans; solvent-extraction of the oil results in products containing 48% crude protein if the soybean hulls are also removed or 44% of crude protein with hulls (NRC, 2011). Both of these meals have lipid contents around 1%. Another soybean product commonly referred to as “full-fat” soybean meal is produced by heat treatment of whole soybeans, resulting in a product having a crude protein content of approximately 38% and 18% lipid (Hertrampf and Piedade-Pascual, 2001; NRC, 2011). Soybean has one of the best amino acid profiles among protein-rich plant feedstuffs for meeting most of the essential amino acid requirements of fish (Mohsen, 1989, quoted in NRC, 2011; Mohsen and Lovell, 1990). However, levels of
11 the EAA methionine, lysine and threonine are significantly lower than in fish meal (NRC, 2011). Additionally, soybean meal contain some antinutritional factors (ANF), such as trypsin inhibitors, lectins, phytic acid, saponins, phytoestrogens and anti-vitamins (El-Sayed, 1999; Francis et al., 2001) that may affect the digestive process (Refstie et al., 2000). Trypsin inhibitors need to be removed or inactivated through processing prior to usage in aquafeeds (Tacon, 1995b). Soybeans and other plants products do not contain taurine, which has been demonstrated to be conditionally indispensable for some fish (Takeuchi, 2001).
Soybean by-products are potential alternative feedstuffs to fish meal and have already been evaluated in a fairly large number of nutritional studies with good results up to 90% maximum level of replacement of fish meal protein, depending on fish species. According to, McGoogan and Gatlin III (1997), diets with 90% of soybean meal replacing fish meal in red drum reported no growth and feed efficiency reduction. Also in red drum, Reigh and Ellis (1992) showed that diets with 50% of soybean protein and methionine supplementation, promoted higher growth rates and feed efficiency than control diets. In gilthead seabream, diets with fish meal replacement with 20% and 30% soybean meal were well accepted by the fish without any adverse effect on growth (Robaina et al., 1995). Japanese flounder, Atlantic halibut, Cobia, Asian seabass and Atlantic salmon, also showed good results with 30-40% fish meal replacement with soybean meal (Kikuchi, 1999a; Berge et al., 1999; Booryaratpalin et al., 1998; Carter and Haunler, 2000; Chou et al., 2004).
1.4.2.2. Canola
Canola, Brassica napus Linnaeus, refers to selected varieties of rapeseed that are low in glucosinolate and erucic acid (Bell, 1993). Globally, canola is one the most important oilseeds as it is ranked second after soybean in 2010 (Soy Stats®). Production of canola in 2010 was 58.4 million metric tonnes and accounted to 13% of global oilseed production. Canola meal is the by-product obtained from the extraction of oil from canola seed. This by-product provides a relatively high crude protein (36%) and balanced amino acid profile for fish (Pastuszewska et al., 2000; NRC, 2011). Canola meal is a particularly rich source of sulphur-containing amino acids, methionine and cysteine, for fish diets (Higgs et al., 1995). Also, it contains comparably high levels of crude fibre, due to the fact that canola seed is not dehulled prior to oil extraction and
12 has a complex carbohydrate structure (Saskatchenwan canola development commission). It also contains about 4% phytic acid and glucosinolates. However, extrusion processing has been shown to improve the nutritive value of canola meal (Satoh et al., 1998). Canola protein concentrates (>60% crude protein) contain very low levels of antinutritional factors with the exception of elevated phytic acid level (Higgs et
al., 1994, 1995; Mwachireya et al. 1999; Thiessen, 2004).
Canola meal and canola protein concentrate are considered good potential protein substitutes for fish meal in aquafeeds. Such products have been used to replace fish meal in diets for various finfish species (Hardy and Sullivan, 1983; Mccurdy and March, 1992; Wedster et al., 1997; Forster et al., 1999; Mwachireya et al., 1999; Thiesen et al., 2004;; Booth and Allan, 2004). Canola by-products combined with other protein sources in fish diets, showed good results on fish growth and performance (Teskeredzic et al., 1995; Lim et al., 1997; Thiessen et al., 2004).
1.4.2.3. Sunflower
Sunflower, Helianthus annuus, is the fourth oilseed crop produced globally, 30.7 million metric tonnes (Soy Stats®). Sunflower is an oilseed, and sunflower oil is the primary product of this cultivation. After oil extraction the resulting cake meal contains about 1.5% residual oil, 30% crude protein, 6.2% ash and 24% crude fibre (with hulls) (Hesley, 1994). Additionally, sunflower meal has high levels of sulphur containing amino acids, methionine and cysteine. However, the relatively high fibre and lignin contents and low level of lysine limits its use in high performance feeds. Sunflower contains a variety of antinutritional factors, the most important of which is chlorogenic acid, which is reported to function as an effective trypsin inhibitor (Kanto, 1988).
Sunflower meal has been used as replacement for fish meal with good results up to 30% replacement level. Research with diets including sunflower meal has showed good results and no adverse effects on growth performance of rainbow trout (Martínez, 1984) and sharpsnout seabream (Diplodus puntazzo) (Mérida et al., 2010). Also, Gill et
al. (2006) reported that diets with 33% sunflower meal in Atlantic salmon had any
adverse effect on performance. In Nile tilapia (Oreochromis niloticus) and gilthead seabream the best results were obtained with 14% and 12% sunflower substitution, respectively (Furuya et al., 2000; Sanchez-Lozano et al., 2007).
13
1.4.2.4. Wheat
Wheat is one of the most important food crops for human consumption. Generally six wheat species are produced and used as feed ingredients. The most common species cultivated in Europe is Triticum aestivum ssp. Vulgare (Hertrampf and Piedade-Pascual, 2001). According to the USDA, world wheat production was estimated at 6.52 million metric tonnes in 2010. Approximately 17-20% of global wheat production is used for feeding mammals and poultry (FAO, 2009b). Wheat is usually milled to flour and the by-products include wheat bran, wheat pollard, wheat germ and wheat gluten. Wheat flour is relatively low in protein (24.3%) and lipid (1.7%), its high in carbohydrate (81.9%) and has low levels of lysine, threonine and valine (Hertrampf and Piedade-Pascual, 2001).
Wheat gluten is a high protein by-product obtained after extraction of starch from wheat grains (Davies et al., 1997; Hertrampf and Piedade-Pascual, 2001). This by-product is currently produced for human consumption as a high-value, non-meat protein source. Wheat gluten is a complex of water insoluble protein with elastic properties that makes it a relatively good binder for aquafeeds. Commercial wheat gluten is an excellent protein source, containing 80.1% crude protein, 1.5% total fat and 0.7% ash. Carbohydrates are the other major component, 17.2% (Hertrampf and Piedad-Pascual, 2001).
This by-product is a potential alternative feedstuffs to fishmeal and has already been evaluated in a fairly large number of nutritional (Gomez-Requeri et al., 2004; Helland et al., 2006; Hansen et al., 2007) and digestibility studies (Pfeffer et al., 1992; 1995; Davies et al., 1997; Davies and Serwata; Robaina et al., 1999; Sugiura et al., 1998; Storebaken et al., 2000; Tibbetts et al., 2006). In general, fish replacement with wheat gluten showed goods results without adverse effects on growth rates and feed utilization. Also, protein from wheat gluten is highly digestible.
1.4.2.5. Corn
Corn, Zea mays L., is a top ranking cereal in terms of global production. It is second to wheat in total world production and has great significance as human food, animal feed and industrial products. Production of corn has remained almost stagnant at around 820 million metric tonnes in 2009-2010 (USDA, 2011). However, only a small percentage of annual production is consumed directly by humans.
14 The corn kernel is a complex mixture of starch, protein, oil, water, fibre, vitamins and pigments, all wrapped in cellophane-like package and it contains no major antinutritional factors. Corn industries explore the full potential of this grain, which generate various by-products. Corn meal is obtained during grain dry milling, the first step of physical separation process of corn in which germen, tip cap and pericarp are separated from the endosperm, which is usually destined for animal feeding. This product contains about 10% crude protein, 4.8% crude fat, 2.8% crude fibre and 80.6% carbohydrate (Hertrampf and Piedade Pascual, 2001). However, it is a poor source of lysine, methionine and tryptophan. Another by-product of corn is obtained by the wet-milling process that separates corn into its four basic components: starch, germen, fibre and gluten (Gatlin III et al., 2007). The commonly traded corn gluten meal is an excellent feed that is a high source of protein (60%), low in carbohydrate (about 25-30%), fat (3.6%) and fibre (1%). It has a good amino acid profile except for lysine and arginine (Hertrampf and Piedade Pascual, 2001). It is a valuable source of methionine to complement other commonly used protein sources but may contain high levels of yellow carotenoids pigments. It is also rich in highly digestible amino acids and contains no antinutritional factors.
Multiple studies have demonstrated the nutritional properties of corn gluten meal for fish feeding. Corn gluten meal was used to replace fish meal in aquaculture diets for numerous species, such as Japanese flounder (Kikuchi, 1999b), gilthead seabream ( Pereira et al, 2003; Robaina et al., 1997; Kissil and Lupatsch, 2004), Atlantic salmon (Anderson et al., 1992; Mundheim et al., 2004), turbot ( Regost et al., 1999; Fournier et
al., 2004), rainbow trout (Cowey and Cho, 1992; Moyano et al., 1992; Pongmamerat
and Watanebe, 1992; Morales et al.,1994; Gomes et al., 1995), European seabass (Morales et al.,1994; Kaushik et al., 2004), juvenile yellowtail (Watanabe et al.,1998), tilapia (Wu et al., 1995), carp (Pongmaneerat and Watanabe, 1991) with varying levels of success. High protein digestibility (over 90%) was reported with silver perch (Allan
et al., 2000), tilapia (Lorico-Querijero and Chiu, 1989; Sklan et al., 2004; Koprucu and
Ozdemir, 2005), rainbow trout (Cho and Slinger, 1979; Gomes et al., 1995; Gaylord et
al., 2008; Davies and Serwata, 2001), yearling channel catfish (Brown et al., 1985),
Atlantic cod (Tibbetts et al., 2006), grower rockfish ( Lee, 2002) and juvenile cobia (Zhou et al., 2004).
15
1.4.2.6. Peas
Field or dry or green peas (Pisum sativum L.) play an important role in the traditional diets of many regions around the world due to its high nutritional value for humans. Pea varieties fall into two main types, yellow and green. Total world production was 10.4 million metric tonnes with Canada (3.4 MMT) and United States of America (0.7 MMT) being the world's two largest producers (FAOSTAT, 2011a). Dry peas contain 22-25% crude protein with relatively high lysine level, but deficient in sulphur-containing amino acids and tryptophan (Hertrampf and Piedad-Pascual, 2001). Peas also contain high levels of carbohydrate (59%) and are low in lipid (14%) (Allan et
al., 2000; Burel et al., 2000; Drew et al., 2007). Field peas has been considered as
potential feed ingredients, either whole or dehulled, raw or processed, however, the level of anti-nutritional factors in raw dry peas limits its use in aquafeeds. Processing techniques have been used to improve the nutritional quality of peas, including dehulling or more advanced treatments such air classification, fine grinding and heat process (Gomes et al., 1995; Thiessen et al., 2003; Allan and Booth, 2004; Schulz et al., 2007).
Studies investigating the nutritional/digestibility value of peas and peas products as fish meal protein replacement for aquafeeds provides favourable results for several aquatic species including rainbow trout (Gomes et al., 1993, 1995; Gouveia et al., 1993; Burel et al., 2000; Thiessen et al., 2003), Atlantic salmon (Carter and Hauler, 2000; ; Aslaksen et al., 2007; Overland et al., 2009), European seabass (Gouveia and Davies, 1998, 2000; Russel et al., 2001), gilthead seabream (Pereira and Oliva-Teles, 2002; Sánchez-Lozano et al., 2009), Atlantic cod (Tibbetts et al., 2006), silver perch (Allan, 1997; Allan et al., 2000; Booth et al., 2001), turbot (Burel et al., 2000), tilapia (Fontainhas-Fernandes et al., 1999; Schulz et al., 2007), common carp (Davies and Gouveia, 2010), catfish (Davies and Gouveia, 2008), milkfish (Borlogan et al., 2003) and shrimp (Smith et al., 1999; Cruz-Suarez et al., 2001; Davis et al., 2002; Bautista-Teruel et al., 2003). In general, studies showed that the digestibility coefficients of pea protein is high in pea protein concentrate, dehulled peas and extruded pea seed meal ( >89%).
1.4.2.7. Faba beans
16 beans, and are grown as gain (pulse) and green-manure legume and it is more evenly distributed around the world than most other grain legumes (Jensen et al., 2010; Nleya
et al., 2000). Faba bean is one of the oldest crops grown by man and it is recognized of
good nutritional value; it is used as source of protein in human diets and as fodder and forage crops for animals (Duke, 1981; Duc et al., 2011). Faba beans world production has declined from 5.6 million metric tonnes in 1965 to 4.1 million metric tonnes in 2009 (FAOSTAT, 2010b). China, 1.6 million metric tonnes, and Ethiopia, 0.61 million metric tonnes, are the world's largest producers (FAOSTAT, 2010). Faba beans varieties can be divided into summer and winter (Hertrampf and Piedade-Pascual, 2001) or coloured and white flower with high and low tannin contents respectively (Sauvant et al., 2004). The protein content of faba beans is 25-30%, but some varieties even reach over 40% protein, and have high levels of lysine. However, tryptophan and methionine levels are limited and it contains high levels of carbohydrate, 40-50%, and 12-20% crude lipid (Duc et al., 1999; Sauvant et al., 2004).
Until recently, few studies were conducted with faba beans as ingredient in aquaculture feeds. Allan et al. (2000) and Booth et al. (2001) reported apparent protein digestibility coefficient values in excess of 90% for a range of faba beans products (whole beans, dehulled and protein concentrates) for silver perch at 30% inclusion level. Also Fontainhas-Fernandes et al. (1999) and Azaza et al. (2009) reported good apparent protein digestibility coefficient values of faba bean meal for Nile tilapia. The nutritional value and digestibility of faba bean meal also proved favourable (>80%) for Atlantic salmon (Aslaken et al., 2007), common carp (Grabner and Hofer, 1985) and rainbow trout (Grabner and Hofer, 1985; Gomes et al., 1995) and more recently in European sea bass (Adamidou et al., 2009).
1.4.3. Antinutritional factors (ANF)
The use of plant feedstuffs in aquafeeds may be, to some extent, challenging or even problematic, due to the presence of antinutrients or antinutritional factors. These compounds are defined as substances that interfere in food utilization and affect the health and production of the animals. Some ANF of relevance includes protease inhibitors, phytates, tannins, lectins, oligosaccharides and non-starch polysaccharides (Francis et al., 2001). Another negative characteristic of these plant-based protein sources is that they usually have low palatability, especially when fed to carnivores fish
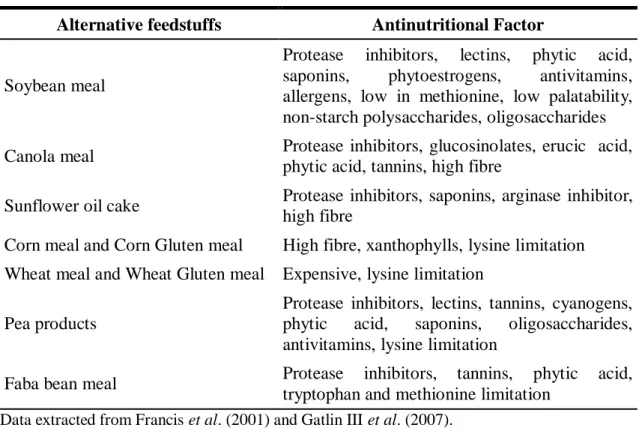
17 (Hardy, 1996). Some examples of the plant-based protein sources that contain ANF are soybean meal, canola meal, sunflower oil cake, corn and wheat products, faba bean meal, pea seed meal, cottonseed meal, barley meal, lupin meal and sesame meal (Francis et al., 2001; Gatlin III et al., 2007). Some ANF can be inactivated by a variety of methods such as dehulling, germination, soaking and enzyme addition or heat treatment such as autoclaving, roasting and extrusion (Francis et al., 2001). A list of plant-based proteins sources and their corresponding antinutritional factors can be seen in Table 1.2.
Table 1.2. Alternative feedstuffs and their corresponding antinutritional factors. Alternative feedstuffs Antinutritional Factor
Soybean meal
Protease inhibitors, lectins, phytic acid, saponins, phytoestrogens, antivitamins, allergens, low in methionine, low palatability, non-starch polysaccharides, oligosaccharides Canola meal Protease inhibitors, glucosinolates, erucic acid,
phytic acid, tannins, high fibre
Sunflower oil cake Protease inhibitors, saponins, arginase inhibitor, high fibre
Corn meal and Corn Gluten meal High fibre, xanthophylls, lysine limitation Wheat meal and Wheat Gluten meal Expensive, lysine limitation
Pea products
Protease inhibitors, lectins, tannins, cyanogens, phytic acid, saponins, oligosaccharides, antivitamins, lysine limitation
Faba bean meal Protease inhibitors, tannins, phytic acid, tryptophan and methionine limitation
Data extracted from Francis et al. (2001) and Gatlin III et al. (2007).
1.5. Digestibility
The nutritional value of a feed is not exclusively based on its chemical composition but also on the amount of nutrients and energy that can be absorbed. By definition nutrient digestibility is the difference in the amount of nutrients or energy taken in that is excreted in faeces (NRC, 2011). Digestibility is a key factor in evaluating the potential of an ingredient for use in the diet of an aquaculture species (Cho and Kaushik, 1990; Allan et al., 2000). Determining the digestibility of nutrients
18 in feedstuffs is important not only to enable formulation of diets that maximize the growth of cultured fish, by providing appropriate amounts of available nutrients, but also to limit the wastes produced by the fish (Cho et al., 1994; Lupatsch and Kissel, 1998; Azevedo et al., 1998; Allan et al., 2000; Lee, 2002; Glencross et al., 2007). Measuring digestibility in fish is more difficult than in terrestrial animals, as nutrients can leach from the faeces into the water before faeces collection (Allan et al., 1999). Several techniques have been used to collect faecal material from fish. The most common techniques used include the collection of faeces from the lower part of the intestine by stripping (Nose, 1960), suction (Windell et al., 1978) or intestinal dissection (Smith and Lovell, 1971). These techniques cause stress or even death to fish and possible contamination of faeces with endogenous material, leading to underestimation of digestibility (Cho et al., 1982; Hajen et al., 1993). Another method, proposed by Smith (1971) consists of measuring all the feed consumed by the fish and all the resulting excreta. For that purpose, fishes are confined in individual metabolic chambers, which allow separating the products of branchial and renal excretions. The faeces are subsequently collected and analyzed for their nutrient content. The amounts of nutrients in the excrements are then subtracted directly from those in the feed to determine the amounts retained (NRC, 2011). This method is open to criticism, because fish are immobilized and force-fed and so stressed that feed utilization may be compromised.
Due to the problems described above, alternative techniques for assessing the digestibility without manipulating the animals were developed. Cho and Slinger (1979) and Choubert et al. (1979) developed two efficient methods for faeces collection, in which excretions are removed from the fish tank soon after expulsion. Cho and Slinger (1979) method comprises a settling column that is used to separate faeces from the effluent water (Guelph system) and Choubert et al. (1979) method uses a mechanically rotating-screen to filter faecal material from the water outlet.
With the Guelph system, fish are maintained in tanks and the faecal material is collected in a settling column as shown in figure 1.2. The bottom of the column, which ends in wedge include a control device for collecting faeces and uneaten feed, and for emptying the tank. The velocity of the water flow is adjusted to maximize the recovery of the faeces in the settling column. It was observed that large faeces particles are deposited within 2 minutes of being voided by the fish (Cho et al., 1982). However,
19 faeces stay in contact with the water and some leaching of nutrients may still occur leading to over-estimation of digestibility (Smith et al., 1980; Cho et al., 1985).
Choubert et al. (1982) developed a system for automatic collection of faeces, where faeces are continuously captured in the outlet of the tank by a rotating-screen, drained and deposited in trays. This process occurs within 6 to 15 seconds after faeces expelling, with positive effects on reduction of leaching since faeces are no longer in contact with water. However, cost of the equipment and system maintenance, in particular when working with salt water, which speeds up deterioration of the material, makes use of this system less spread.
Digestibility can be measured directly by subtracting the amount of nutrients in the faeces from those provided in the feed. This method is impractical in fish, due to difficulties in accurately measuring feed intake and faeces production and nutrient leaching; thus it is more usual to use an indirect method for determination of digestibility. This method implies the use of an indigestible marker in the diet. The digestibility of the nutrient/energy can be determined by assessing the difference between feed and faecal concentrations of marker and nutrient. The apparent digestibility coefficient (ADC) is then estimated by using the following formula:
ADC (%) = [1-(ID*NF)/ (IF*ND)]*100,
20 Where, ID represents the marker in the feed, IF marker in faeces, ND nutrient/energy in the feed and NF nutrient/energy in faeces.
The use of a marker is advantageous as it allow maintenance of the fish in normal culture conditions and the number of fish per tank can be extended (Austreng, 1978). To be effective, the marker must be indigestible, non-toxic, completely inert and should move through the gut at the same rate as the undigested ingredients (Cho et al., 1985; NRC, 2011). Markers can be internal markers (dietary constituents) such as crude fibre, acid insoluble ash, hydrolysis-resistant organic matter or external markers that must be incorporated in the diet. Most digestibility studies conducted with aquafeeds used formulated diets containing external markers, such as chromic oxide (Cr2O3), synthetic particles (polyethylene) and yttrium oxide. Chromic oxide is the most commonly used marker and is usually included in the diet at a concentration of 0.5 to 1.0 percent (NRC, 2011).
Digestibility usually does not vary significantly with the amount of ingested food, the number of meals (Choubert et al., 1984), environmental factors such as temperature and salinity, or biotic factors, such as age (Cho and Kaushik, 1990). However, apparent digestibility varies according with species, extrusion process of feedstuffs and factors intrinsic to the feed and the ingredients that compose it.
The determination of digestibility of a single ingredient in aquatic animals is rarely possible as fish do not easily accept feeding individual feedstuffs like soybean, wheat, etc. However, ingredient digestibility can be obtained by the difference method, as it is assumed that under normal conditions digestibility of nutrients is additive, i.e., digestibility of a nutrient in one ingredient does not interact with the digestibility of the same nutrient in another ingredient. In this method, the test ingredient replaces part of a reference diet to obtain the test diet.
Cho et al. (1982) developed this method for digestibility studies in fish with test diets composed of 30% of the test ingredient and 70% of the reference diet. With this method, the digestibility coefficient of the test ingredient is measured according to the following formula (Cho et al., 1982):
21 However, this equation has been shown to be mathematically incorrect as it does not take in consideration the level of nutrient in the ingredient and in the reference diet (Forster 1996; Sugiura et al., 1996). To overcome that incorrectness, Forster et al. (1999), proposed the following formula:
ADCing= [(x+y)* ADC Ndiet – (x)* ADCDR]*y-1
where: ADCI = apparent digestibility coefficient of nutrient or energy in the test ingredient; ADC Ndiet = apparent digestibility coefficient of nutrient or energy in test diet; ADCDR= apparent digestibility coefficient of nutrient or energy in the reference diet; x= nutrient contribution of reference diet to nutrient content of combined diet (level of nutrient in reference diet *(100-i); y= nutrient contribution of test ingredient to nutrient content of test diet (level of nutrient/energy in test ingredient * I); i= level of test ingredient in test diet.
1.6. Aquaculture and the Environment
Aquaculture is the fastest growing food production system due to significant increases in demand for fish and seafood throughout the world and the increase of world population. Along with the expansion of production, environmental impacts of aquaculture activities have been a concern and minimizing those potential negative environmental impacts is an important factor for a sustainable development of the aquaculture industry (Tacon et al., 1995; Cho and Bureau., 2001). Intensification of aquaculture leads to increasing use and demand for aquafeeds and these nutrients inputs are the major source of waste from aquaculture industry (Cho, 1991; Bergheim and Asgard, 1996). Feed derived wastes, such as solids and nutrients such as phosphorous and nitrogen, are considered the largest proportion of aquaculture waste, leading to degradation of water resources. However, the environmental impact from aquaculture waste is small in comparison to the potential impact of agricultural and land-based animal production wastes.
Many forms of feed derived wastes include uneaten feed, undigested feed, and excretion of metabolic products (Beveridge, 1987; Cripps, 1995; Bergheim and Asgard, 1996; Dosdat, 2001). Feed waste depends mostly on the feeding practices and increase when the amount fed exceeds the maximum energy intake for the animal. As the costs of aquafeeds represent the greatest proportion of costs in fish production, getting the
22 feeding strategy which minimizes feed waste requires considering the characteristics of fish, biotic factors and nutrient composition of the diet. Type of feed is also crucial with regard to the aquatic environment, as feed pellets should remain intact in water until consumed, improving feed utilization and thus reducing waste production.
Digestibility of feedstuffs is another factor affecting the waste production of aquaculture systems. Digestibility is a key factor when formulating fish diets, since undigested material generally represents the most important losses related to feed processing by the fish, and it provides information of the amount of available nutrients to the animals. In general, protein and lipids are highly digestible, so solid wastes consist largely of undigested carbohydrate and fibre from various plant products (Cho and Bureau, 2001).
Nutrient pollution, particularly nitrogen (N) and phosphorus (P), may effectively stimulate eutrophication and consequently degradation of natural aquatic ecosystems (Persson, 1988; Cho e Bureau, 2001; Zhang et al., 2006). Nitrogenous compounds and phosphorus are important nutrients for aquatic plants booth in marine and freshwater environment. Therefore, their increased availability in aquatic environment can significantly affect the balance of natural ecosystems. So, reducing N and P discharges is a main strategy to reduce the environmental impacts of aquaculture industry (Cheng
et al., 2003).
Nitrogenous compounds results of protein metabolism and excretion amount depends on species, quantity and quality of the dietary protein. Poor digestibility and over supply of dietary protein causes high metabolic nitrogenous wastes. Another key factor is the amino acid composition of the diet, as feeding amino acids in excess of requirements will result in catabolism of the amino acid with associated excretion of ammonia. According to Cho and Bureau (2001), the reduction of dietary protein to energy ratio usually results in an increase of nitrogen retention thus reducing nitrogen waste. Improvement of N retention and decrease of N excretion may be accomplished with the utilization of non-protein energy sources for meeting energy requirements, resulting in a reduction of amino acid catabolism.
Fish require between 0.4 and 0.7% of phosphorus in their diets (NRC, 2011) but in general the phosphorus content of diets exceeds fish needs. The availability of dietary phosphorus is dependent on the chemical form and digestibility, absorption and metabolic utilization. Fish meal has high contents of phosphorous and is still the main
23 source of dietary phosphorous in fish feeds. Therefore, using plant protein with low phosphorous content is one strategy for reducing phosphorous waste from aquaculture (Cho and Bureau, 2001). However, the bioavailability of phosphorous in plant feedstuffs is low as it is mainly present in the form of phytate and fish do not produce the enzyme phytase which hydrolyses phytate. According to Cho and Bureau (2001), dietary incorporation of microbial phytase improves the digestibility of phosphorous of fish fed diets containing phytic acid.
Aquaculture and natural preservation is not only a theoretical consideration, but a basic assumption in the development of sustainable aquaculture practices respectful of the environment. There are several approaches of combating water pollution due to aquaculture, most of which are detailed in codes of practices and guidelines on best management practices. Feeds nutritionally balanced, incorporating highly digestible ingredients and effluent treatment can be carried out to reduce aquaculture waste and minimize the environmental negatives impacts of this industry.
1.7. Objectives of the current study
In this study we intend to measure the digestibility coefficients for juvenile meagre of fish meal and several plant feedstuffs with potential to be incorporated in diets, namely as soybean meal, canola meal, sunflower meal, wheat flour, wheat gluten meal, corn meal, corn gluten meal, pea protein concentrate and faba bean meal, in order to obtain basic data for adequate formulation of diets for this species.
24
Chapter 2. General material and methods
2.1. Experimental animals
Juvenile meagre (Argyrosomus regius) were obtained in IPIMAR/Sul, Olhão and were transported to the experimental facilities at the Marine Zoological Station, Faculty of Sciences, University of Porto. The fish were kept in quarantine for a week, on fiberglass tanks with a volume of 300 liters. During this period fish were fed a maintenance diet.
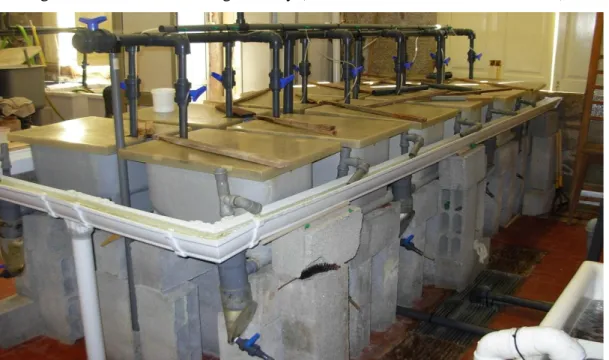
2.2. Experimental facilities
The experimental system was composed of 12 fiberglass tanks of 55 liters water capacity designed according Cho et al. (1982) in a recirculating water system with partial water renewal. To each of the tanks was attached a faeces sedimentation column designed according Cho et al. (1982). The water current was adjusted so that flow rate within the tanks was fast for rapid faeces removal. Faeces deposited on the terminal zone of the sedimentation column, were daily collected. The effluent of each tank flowed into a common drainage channel, which led to the filtration system. This system was composed by a biological filter, comprising two square tanks of 500 liters capacity filled with “bio-balls”, and a sand filter. Before entering the biological filter waste passed in a mechanical filter to remove particulate material. The digestibility trials were conducted at a constant temperature of 19°C; water temperature was controlled by a thermoregulation system composed of a heating resistance and a cooler. The experimental fish were subjected to a 12h light/12h dark photoperiod regime provided by artificial illumination.
2.3. Diets
A reference diet (RD) and eleven experimental diets composed of 70% RD and 30% of each of the following test ingredients, soybean meal, canola meal, sunflower meal, wheat flour, corn meal, faba bean meal, wheat gluten meal, corn gluten meal, pea protein concentrate and raw starch (Table 2.1.). The reference diet was formulated to contain approximately 50% crude protein and 14% lipid. Chromic oxide was used as an external marker and was incorporated into the reference diet at 1%. Proximate
25 composition of the reference and experimental diets is shown in Table 2.3. The ingredients, after well mixed were cold pelleted in a laboratory pellet mill (CPM) through a 2.5 mm die.
Table 2. 1. Reference and experimental diets formulations for determination of digestibility coefficients in meagre (n=3).
Ingredients (g.kg-1 dry diet) Reference diet Experimental diets
Fish meal1 650 450
Soluble fish protein
concentrate2 50 35 Gelatinized starch 171 120 Fish oil 84 59 Vitamin premix3 10 7 Mineral premix4 10 7 Choline chloride (50%) 10 7 Binder (Aquacube)5 10 7 Chromic oxide 10 7 Test ingredient --- 300 1
Steam Dried LT fish meal, Pesquera Diamante, Perú ( CP:752.0g kg-1 DM; CF: 99.0g kg-1 DM).
2
Sopropêche, France (CP:804.0h kg-1 DM; CF: 197.0 g kg-1 DM) 3
Vitamins (mg.kg-1 diet): alpha-tocopherol 83.3; meandione 16.6; thiamin 12.5; riboflavin 12.5; Ca pantothenate 33.3; nicotinic acid 116.7; pyridoxine 8.3; folic acid 4.2; cyanocobalamin 0.04; biotin 0.5; ascorbic acid 83.3; inositol 250 (IU.kg-1 diet): retinol 18000; cholecalciferol 1667.
4
Minerals (mg.kg-1 diet): cobalt sulphate 1.9; copper sulphate 19.6; Iron sulphat 200; sodium fluoride 2.2; potassium iodine 0.8; magnesium oxide 830; manganese oxide 26; sodium selenite 0.7; zinc oxide 37.5; bicalcium phosphate 8020; potassium chloride 1150; sodium chloride 440.
5
Agil, England (guar gum, polymethyl, carbamide, manioc starch blend, hydrate calcium sulphate).