i
Customer Clustering in the Health Insurance Industry
by Means of Unsupervised Machine Learning
Jéssica Raquel Zaqueu
An Internship Report
Internship report presented as partial requirement for
obtaining the Master’s degree in Advanced Analytics
i Title:Customer Clustering in the Health Insurance Industry by Means of Unsupervised
Machine Learning Subtitle: Na Internship Report
Jéssica Raquel Zaqueu
MAA
201
ii
NOVA Information Management School
Instituto Superior de Estatística e Gestão de Informação
Universidade Nova de Lisboa
CUSTOMER CLUSTERING IN THE HEALTH INSURANCE INDUSTRY BY
MEANS OF UNSUPERVISED MACHINE LEARNING
by
Jéssica Raquel Zaqueu
Internship report presented as partial requirement for obtaining the Master’s degree in Advanced Analytics
Advisor: Leonardo Vanneschi
External Supervisors: André Rufino & Anwar El-Jawhari
iii
DEDICATION
This report is dedicated to my beloved parents for their endless love, support and continuous encouragement.
iv
ACKNOWLEDGEMENTS
I would like to start by thanking my supervisor, Professor Leonardo Vanneschi, for his time, effort, guidance, patience and understanding. I would also like to thank him for his lectures during the first year of the Master’s which were a great and very interesting learning experience.
I wish to also express my company supervisor André Rufino for the opportunity to undergo this internship as well as all his dedication, teachings and patience in ensuring that this project was carried out as smoothly as possible. I would also like to thank Anwar El-Jawhari for his guidance, dedication, for supervising me throughout the project and passing on his incredible data science knowledge. My gratitude also goes towards Diana Duarte, who was my assigned business specialist, for ensuring that my integration into the company and into the insurance world was easily achieved. I would also like to thank my Master’s colleagues Andrew Talas and Jorge Abreu who were with me throughout the internship journey, for their help, friendship and support. Furthermore, I would like to thank everyone at the host company and a special thank you to my team who contributed to making this learning experience as pleasant as possible.
v
ABSTRACT
To ensure competitiveness and relevancy in today’s highly digitised world, companies need to ensure that their focus is continuously on the client and on the experience they provide – while not having a negative effect on the organisation’s bottom line. A crucial step to achieving this is to get to know one’s customer base. With the vast amount of data available in a health insurance company, they are able to leverage on unsupervised machine learning techniques to segment their customers. This enables organisations to have a more tailored approach to their customers, identify market growth opportunities and gain competitive advantage.
KEYWORDS
Segmentation; Clustering; Customer Analytics; Customer Clustering; Customer Segmentation;
Insurance; Unsupervised learning; KMeans; Decision Trees; Data Mining; Customer Behaviour; Health Insurance; Customer Relationship Management; CRM; Machine Learning
vi
INDEX
1.
Introduction ... 1
Contextualisation ... 1
2.
Motivation ... 3
3.
Clustering ... 4
Clustering Algorithms ... 4
Clustering Applications ... 5
Clustering Methods ... 7
Partitioning Algorithms... 7
Hierarchical Algorithms ... 8
Density Based Clustering Methods ... 10
Grid-Based Clustering Algorithms ... 10
Model Based Clustering Algorithms ... 11
K Means Clustering ... 12
Distance Measures ... 14
Additional Considerations ... 17
4.
Methodology ... 18
Details ... 18
Business Understanding ... 20
Project Scope: ... 20
Project Objective: ... 20
Data Understanding and Preparation ... 21
Modeling ... 25
Model Scoring ... 30
Deployment ... 33
5.
Conclusions ... 35
6.
Limitations and recommendations for future works ... 36
vii
LIST OF FIGURES
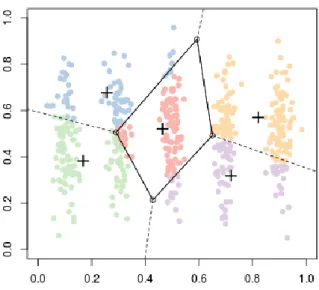
Figure 1 - Voronoi Clustering Diagram ... 7
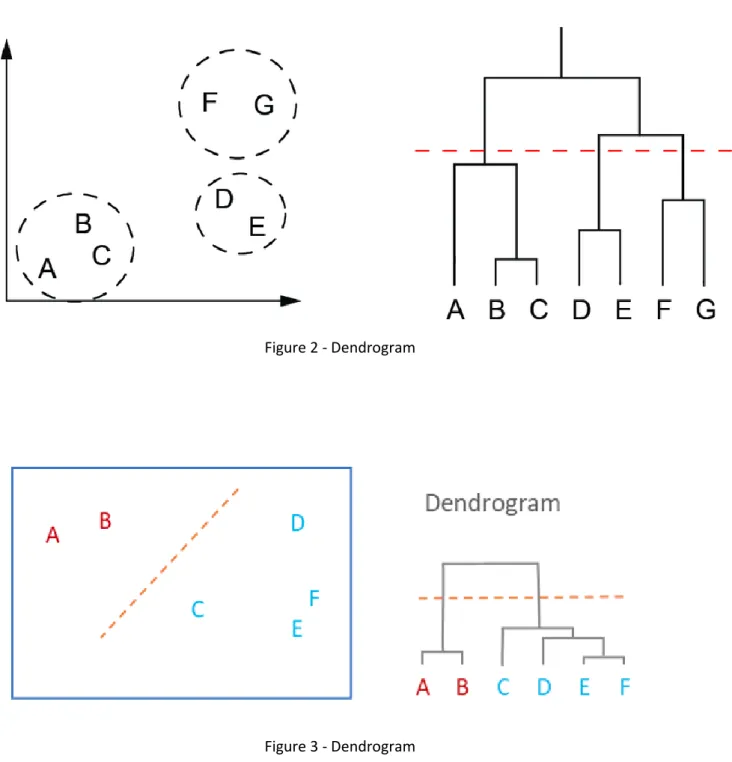
Figure 2 - Dendrogram ... 9
Figure 3 - Dendrogram ... 9
Figure 4 - Lloyd's Algorithm ... 13
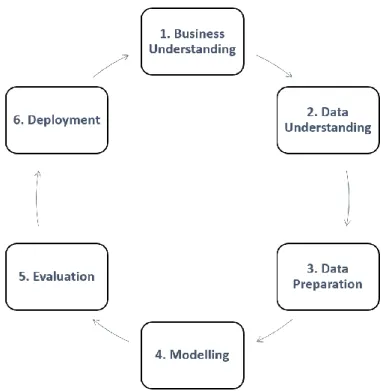
Figure 5 - CRISP DM Methodology ... 18
Figure 6 - Used Methodology ... 19
Figure 7 -SAS E Miner Nodes ... 25
Figure 8 - Selected Cluster Results ... 26
Figure 9 - Gap Statistic ... 27
Figure 10 -Cluster Distribution ... 29
Figure 11 - KPIs to be Monitored ... 31
viii
LIST OF TABLES
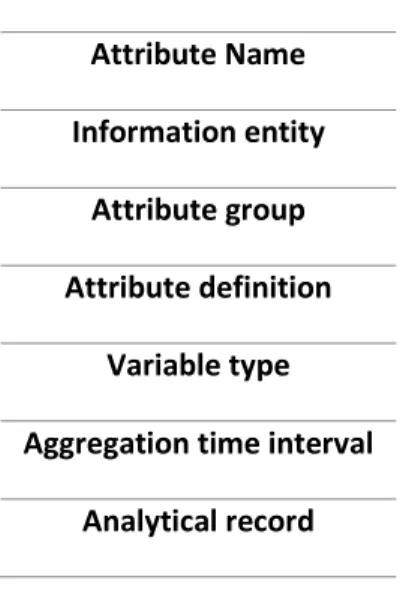
Table 1 - RDU Fields ... 21
Table 2 - Source Tables ... 22
Table 3 - Factors Description ... 25
ix
LIST OF ABBREVIATIONS AND ACRONYMS
PCA Principal Component AnalysisDBSCAN Density Based Clustering Algorithm
RDU Reference Data Universe
1
1. INTRODUCTION
For this report, a member of Grupo Ageas Portugal has been chosen to be the partnering company for the internship. The company is one of the leading health insurance companies in the Portuguese market. The partnership between the university and the host company guarantees that the internship contents are in line with the Master’s topics. The internship took place from August 2017 to May 2018.
In line with the company’s aim to become more data and analytically driven, an ecosystem of analytical models needed to be put in place. A customer clustering model is considered to be one of the foundational layers required to build such an ecosystem. The output of this model can serve various purposes from improving targeted actions, refining pricing granularity, embarking on a more tailored customer relationship management journey as well as serve as input for a series of other types of models or providing a new perspective to look at customers.
One of the company’s main goal is to truly get to know its customer base so as to be able to improve the way it interacts with them. The customer segments discovered through the implementation of a partitioning clustering algorithm during the internship period shed light on subgroups which the organisation did not know it had from previously carrying out basic analyses. This subdivision of the over 200,000 customers into distinct clusters empower the marketing department to approach campaign planning and execution from a new angle and they also enable the discovery of possible new clinical focus.
This report is divided into two parts. The first part provides a theoretical overview of clustering algorithms as well as additional topics which were studied in order to carry out the practical project. The second part provides a description of the practical process used to carry out a clustering analysis of the company’s individual client portfolio.
C
ONTEXTUALISATIONIn today's rapidly changing commercial landscape, organisations are faced with increasing challenges, such as improving margins, acquiring profitable customers, increasing market share and satisfying the needs and wants of their customers to ensure retention and long-term growth. The insurance industry has additional specific challenges; these include flat market growth, more sophisticated and morphing fraud, and increased regulatory oversight.
Successful businesses place the customer at the centre of all business strategies. It is therefore vital to understand the customer base and to identify sources of growth within the portfolio. This information is also useful to monitor customer journeys.
Furthermore, it is also useful for targeting and attracting the right mix of customers. Several Data Mining and Machine Learning techniques exist to understand the customer base. Customer
2 segmentation, in this case also referred to as customer clustering, is an excellent starting point. Customers are placed into distinct groups. Each group has distinct characteristics that are useful in profiling.
Segmentation in combination with other business strategies, such as Marketing and Pricing, has the potential to bring tremendous benefits to the organisation.
The host company provides health insurance policies for three groups of customers. These are individual customers, customers through small and medium enterprises and corporate customers. The policies available to these three groups differ in terms of purchase drivers, available services as well as purchasing methods. As such, the customer clustering exercise cannot be done on the entire portfolio at once. In order to achieve the intended objectives, it is important to cluster these customers in their categories. This report focuses on individual customers and how they were segmented.
3
2. MOTIVATION
Economic shifts and changes in traditional business models that have emerged with the digital revolution have put the customer on an even more accentuated centre stage than ever before. Customers nowadays have many more platforms to have their voices heard. Consequently, the impact, which the customers have on business operations, has also magnified. These shifts also bring the need for organisations to know the composition of their customer base and to cater to the customer individual or collective needs in order to remain relevant and competitive. The health industry is highly competitive and challenging. Health is also an especially delicate topic.
The new digital age demands that all actors in the industry, both direct and auxiliary health care providers, ensure that they are providing excellent services and truly listen to the customers' needs and wants to prevent them from opting for other offers on the market. This not only ensures that the companies gain competitive advantage but it also assists in promoting growth, and increasing profits. Product features such as type and coverage, legislation which determines whether a product or service is mandatory or optional and customer interactions such as claims experience and contact with the company, greatly influence customers' choices. A healthcare insurance customer has no direct comparison to, for example, a motor insurance customer.
The needs and motivations that drive a person to purchase health insurance differ widely from those that drive a person to purchase motor insurance. For example, the latter is typically mandatory, whereas health insurance is optional. When a product is optional, customers who see no benefits in owning the product are often quick to leave. It is therefore one of a company's main focus to attract and retain customers.
This must be done while maintaining or increasing profitability. In an industry where usage determines identifying product usefulness while also determining costs incurred by the company, it is crucial to maintain a balance between being able to show customers how they benefit from owning the product while not affecting the organisation’s bottom line.
Additionally, health insurers have an added underlying social responsibility to promote healthy living habits among their customers and society as a whole. Such knowledge of who the customers are and what potential health requirements they have provides great insights that contribute to the generation of potential health awareness campaigns.
4
3. CLUSTERING
In today’s customer-centric era, organisations need to ensure that they do not fall into the one size fits all trap. Purcell (2017) believes that customer segmentation provides the key to delivering uniquely tailored customer experiences. Data driven and advanced analytics approaches such as behaviour based and predictive segmentation allow for the emergence of valuable customer groups from organisational data. It is also said that customer segmentation is the required enabler for the intimacy and relevance that the modern-day customer demands.
With the increasing need for grouped focus in several industries and applications, clustering algorithms have gained increased focus in various industries. In recent years clustering has had a series of applications. This is highlighted the recently gained importance for organisations to shift away from traditional segmentation techniques and leverage on the advanced analytics techniques on the vast amount of data they collect on customers.
Clustering is an unsupervised machine learning technique for statistical data analysis used in many fields. Clustering algorithms aim to group data points. With a given dataset, clustering enables the assignment of each data point into a specific group. The data points in the same group should have features as similar as possible to one another and should be as dissimilar as possible to the features in a different cluster.
Clustering analysis enables the gain of truly valuable insights from data by seeing the patterns that the algorithm is able to extract.
There are several benefits to companies applying implementing and making use of clustering algorithms; one of the main ones being that clustering enables organisations to tailor client relationships based on common shared characteristics between the members of each group hence providing the customer with the perception of being treated uniquely.
In a summarized form, clustering can be defined as the act of grouping together data points with characteristics that are as similar to one another in the group and as different as possible to observations in a separate cluster.
C
LUSTERINGA
LGORITHMSMany algorithms have been proposed for clustering analysis; there is no universally applicable technique. Furthermore, different clustering problems require different clustering approaches. It is paramount to understand the problem at hand and the various available algorithms to ensure that the most suitable approach is used.
Jain et al. (1996) define clustering as the unsupervised classification of patterns, which can be observations, data items or feature vectors, into groups or clusters. They believe that the broad spectrum of applications of clustering techniques has made it more difficult to have a transfer of generic concepts and methodologies.
5 Clustering can be used in varying fields such as image segmentation, object recognition, information retrieval and portfolio and customer analysis. The latter being the focus of this report.
Sarstedt and Mooi (2014) support Jain et al.’s definition and state that cluster analysis is a convenient method for identifying homogenous groups of objects and that these objects in a specific cluster share many characteristics but are very dissimilar to objects not belonging to that cluster. Additionally, they add that cluster analysis can be applied in market segmentation in a way which allows segments to be formed that based on data and are hence less dependent on subjectivity. Kumar et al. (2005) further add to the previous two definitions by stating that cluster analysis divides data into groups that are meaningful, useful or both. The goal of clustering can be to obtain meaningful groups or to serve as a starting point for further analysis. Should the aim be the understanding then the clusters should capture the natural pattern of the data. Kumar et al. believe that cluster analysis can therefore be for utility or understanding and irrespective of the final objective, these techniques have been used in various fields ranging from psychology and social sciences to biology to pattern recognition.
Kaufman and Rousseeuw (2009) state that clusters can often be measured in terms of density. Therefore, a cluster can also be defined as a region in which the density of the object is locally higher than in other regions.
Clustering Applications
As previously mentioned, clustering is being used in a variety of fields. Some of the uses are detailed below.
‒ Medical Applications
Cluster analysis has been widely used in varied applications including finding a true typology, prediction based on groups, hypothesis generation, data exploration, and data reduction or grouping similar entities into homogeneous classes, consequently organising large quantities of information and enabling labels that ease communication. Several specific examples of the use of cluster analysis have been reported in the literature, such as characterising psychiatric patients based on clusters of symptoms, finding a group of genes that have similar biological functions, or identifying medical patient groups most in need of targeted interventions. A field requiring attention but slightly less investigated is the utility of cluster analysis in macro-structures associated with changes in treatment outcomes documented in large healthcare claims databases.
‒ Customer Segmentation
Customer segmentation refers to any process which subdivides customers based on shared attributes; it is the process of dividing customers into groups based upon certain boundaries and clustering is one way to generate these boundaries. Traditionally this task was performed relying mainly on demographic data. Nowadays, there is a wide array of data available including but not limited to
6 transactional, behavioural, psychographic, social and contextual. These newly available data sources allow for the fine-tuning of customer groups into microsegments which in turn enable for cluster tailored business strategies.
‒ Image Pattern Recognition:
This use of clustering detects similar regions in an image. Image segmentation is among the mostly used techniques to classify the pixels of an image correctly in decision-oriented applications. Chen et al. (2015) define image segmentation as a procedure to divide an input image into several regions according to the visual characteristics shared by the pixels. It divides an image into several discrete regions such that the pixels have high similarity in each region and high contrast between regions. It is a valuable tool in many fields including healthcare, image processing, traffic image, and pattern recognition among others. From the various available techniques, Dhanachandra et al. (2015) believe that one of the most efficient methods is the clustering method.
7
C
LUSTERINGM
ETHODSKaufman and Rousseeuw state that there are two types of clustering algorithms; Swarndeep and Sharmil (2016) add three more to the initial set. The clustering techniques differ in various ways and can be categorized as Partitioning techniques, Hierarchical techniques, Density-based techniques, Grid based methods and Model-based methods. This chapter provides a description of these techniques.
Partitioning Algorithms
Partitioning algorithms construct a partition of a database D of n objects into a set of k clusters, k is an input parameter for these algorithms and as such some domain knowledge is required which is not the case for many applications.
Ester et al. (1996) describe the partitioning algorithm as normally starting with an initial partition of
D and then following an iterative control strategy to optimize an objective function. Each cluster is
represented by the gravity centre of the cluster – in the case of K Means algorithms – or by one of the objects of the cluster located near its centre – in the case of K Medoid algorithms.
As a result, partitioning algorithms use a two-step procedure. First, determine k representatives minimizing the objective function. Second, assign each object to the cluster with its representative closest to the considered object. The second step implies that a partition is equivalent to a voronoi diagram and each cluster is contained in one of the voronoi cells. Thus, the shape of all clusters found by a partitioning algorithm is convex which is very restrictive.
8 Swarndeep and Sharmil explain partitioning techniques as follows.
Given a database of n objects, it constructs k partitions of the data. Each object must belong to exactly one group. Each group must contain at least one object. Partitioning technique can improve iterative relocation technique by mining objects from one graph to another. The main objective of partition clustering algorithm is to divide the data points into K partitions. Each partition will reflect one cluster. The technique of partition depends upon certain objective functions such as minimising the square error criterion.
The weakness of such an algorithm is that whenever the distance between the two points from the centre are close to another cluster, the result becomes poor or misleading due overlapping of the data points.
Hierarchical Algorithms
Hierarchical algorithms create a hierarchical decomposition of the dataset D. The hierarchical clustering method seeks to build a tree based hierarchical taxonomy from a set of unlabelled data. The hierarchical decomposition is represented by a dendrogram, which is a tree that iteratively splits
D into smaller subsets until each subset consists of only one object.
In such a hierarchy, each node of the tree represents a cluster of D. All cluster nodes contain child clusters; sibling clusters partition the points covered by their common parent. The dendrogram can either be created from the leaves up to the root – agglomerative approach – or from the root down to the leaves – divisive approach – by merging or dividing clusters at each step.
In the agglomerative approach which is also known as bottom up approach, Hierarchical algorithms always result into what is called nested set of partitions. Divisive and Agglomerative strategies are two important strategies of hierarchical clustering. In case of divisive approach, commonly known as top down approach, all data points are considered as a single cluster and split into number of clusters based on certain criteria. Examples for such algorithm include Balance Iterative Reducing and Clustering using Hierarchies (BIRCH) and Cluster Using Representatives (CURE).
In contrast to partitioning algorithms, hierarchical algorithms do not need to determine k as an input. However, a termination condition must be defined in order to indicate when the merge or division process should be terminated. One example of a termination condition in the agglomerative approach is the critical distance Dmin between all the clusters of Q. Research shows that the main problem with hierarchical clustering algorithms has been the difficulty of deriving appropriate parameters for the termination condition, e.g. a value of Dmin which is small enough to separate all natural clusters and, at the same time large enough such that no cluster is split into two parts. The most important weakness of hierarchical clustering technique is that it does not scale properly because of time complexity.
9
Examples of Dendrograms
Figure 2 - Dendrogram
10
Density Based Clustering Methods
Density based method has been introduced on the basis of density. Benfield and Raftery opined that Density based methods assume that the points that belong to each cluster are drawn from a specific probability distribution. This algorithm can be used for only spherical-shaped clusters. The merit of such clustering is that they have considerable higher density of points than outside the cluster. This method can be effective in handling the noise to some extent provided the input dataset can be scanned. It only requires one scan of the input dataset. The precondition of this algorithm is that the density parameters should be initialized a priori. It permits the given cluster to grow continuously as long as the density of neighbourhood exceeds a certain threshold. DBSCAN, DENCLUE and OPTICS are examples of density-based methods.
Sharma ad Ramya explain DBSCAN as a method that finds all clusters properly, independent of the shape, size, and location of clusters to everyone. DBSCAN is based on two main concepts: density reach ability and density connect ability. Both concepts depend on two input parameters of the DBSCAN clustering: the size of epsilon neighbourhood e and the minimum points in a cluster m. The number of points parameter impacts detection of outliers. Points are declared to be outliers if there are few other points in the e-Euclidean neighbourhood. e parameter controls the size of the neighbourhood, as well as the size of the clusters. The Euclidean space has an open set that can be divided into a set of its connected components. The execution of this idea for partitioning of a finite set of points requires concepts of density, connectivity and boundary.
Grid-Based Clustering Algorithms
A grid-based structure is formed by this algorithm by quantising the object space into finite number of cells. This means the following:
‒ The data space is first partitioned into definite number of cells. ‒ The cell density for each of the cell is calculated.
‒ The cells are classified through sorting according to their densities. ‒ The centre of the cluster is identified.
‒ The distance between the neighbouring cells are calculated.
The main advantage of the grid-based method is fast processing time, irrespective of number of data objects. The main feature of this algorithm is that it does not require computing distances between two data objects. Clustering is performed only at summarized data points. STING, Wave Cluster and CLIQUE are examples of grid-based methods.
11
Model Based Clustering Algorithms
This algorithm is based on hypothesising a model for every cluster to find best fit of the data according to the mathematical model. It can automatically determine the number of clusters based on standard statistics. The method may locate clusters by constructing a density function that reflects the spatial distribution of the data points. It therefore yields robust clustering method. STASTICAL approach and COBWEB are examples of model-based clustering methods.
12
K Means Clustering
The following section will detail out one of the partitioning algorithms which was used for the purpose of this report.
K Means Algorithm
K Means (MacQueen, 1967) is one of the simplest unsupervised learning algorithms used to solve the clustering problem. The procedure follows a simple and easy way to classify a given data set through a certain number of k clusters fixed a priori. The main idea is to define k centroids, one for each cluster. These centroids should be placed in a clever manner de to the fact that different initialisations (location of the centroid) can cause different results. Therefore, the better choice is to place them as far away as possible from one another.
The next step is to take each point belonging to a given data set and associate it to the nearest centroid. A centroid is the most representative point within the group. When no point is pending, the first step is completed, and an early grouping is considered completed.
At this point, k new centroids need to be recalculated as barycentres of the clusters resulting from the previous step. After the k new centroids have been obtained, a new binding has to be done between the same data set points and the nearest new centroid. A loop is then generated. As a result of this loop it can be seen that the k centroids change their location step by step until no more changes are done.
This algorithm aims at minimizing an objective function, in this case a squared error function. The algorithm is composed of the following steps:
1. Place K points into the space represented by the objects that are being clustered. These points represent initial group centroids.
2. Assign each object to the group that has the closest centroid.
3. When all objects have been assigned, recalculate the positions of the K centroids.
4. Repeat Steps 2 and 3 until the centroids no longer move. This produces a separation of the objects into groups from which the metric to be minimized can be calculated.
13 Figure 4 - Lloyd's Algorithm
K Means clustering and Lloyd’s algorithm are probably the most widely used clustering procedure. This is for three main reasons:
• The objective function is simple and natural.
• Lloyd’s algorithm (which we see below) is simple, efficient and often results in the optimal solution.
• The results are easily interpretable and are often quite descriptive for real data sets. In 1957 Stuart Lloyd suggested a simple iterative algorithm which efficiently finds a local minimum for this problem. This algorithm (a.k.a. Lloyd’s algorithm) seems to work so well in practice that it is sometimes referred to as k-means or the k-means algorithm.
Advantages of K Means:
− If the variables are large, then K-Means most of the time computationally faster than hierarchical clustering methods.
− K Means produces tighter clusters than Hierarchical Clustering Method. Disadvantages of K Means:
− It is difficult to predict the K Value.
− More difficulty in comparing quality of cluster.
14
Distance Measures
The choice of distance measures is a critical step in clustering. It defines how the similarity of two elements (x, y) is calculated and it will influence the shape of the clusters.
The classical methods for distance measures are Euclidean and Manhattan distances, which are defined as follow:
Euclidean Distance
It is the distance between two points defined as the square root of the sum of the squares of the differences between the corresponding coordinates of the points and is calculated as follows.
Manhattan Distance
I tis the distance between two points defined as the sum of the absolute values of the differences of the coordinates of the points and is calculated as follows.
There are other dissimilarity measures which exist such as correlation-based distances, which are widely used for gene expression data analyses.
Correlation-based distance is defined by subtracting the correlation coefficient from 1. Different types of correlation methods can be used such as:
15 Pearson Correlation Distance
Pearson correlation measures the degree of a linear relationship between two profiles.
Eisen Cosine Correlation Distance
It is a special case of Pearson’s correlation with x and y both replaced by zero
Spearman Correlation Distance
The spearman correlation method computes the correlation between the rank of x and the rank of y variables.
Where x’I = rank (xi) and y’I = rank (yi)
Kendall Correlation Distance:
Kendall correlation method measures the correspondence between the ranking of x and y variables and is defined as follows:
16
Where,
nc: total number of concordant pairs
nd: total number of discordant pairs
n: size of x and y
The choice of distance measures is very important, as it has a strong influence on the clustering results. For most common clustering software, the default distance measure is the Euclidean distance.
Depending on the type of the data and the researcher questions, other dissimilarity measures might be preferred. For example, correlation-based distance is often used in gene expression data analysis. The value of distance measures is intimately related to the scale on which measurements are made. Therefore, variables are often scaled (i.e. standardized) before measuring the inter-observation dissimilarities. This is particularly recommended when variables are measured in different scales (e.g: kilograms, kilometres, centimetres, …); otherwise, the dissimilarity measures obtained will be severely affected.
The goal is to make the variables comparable. Generally, variables are scaled to have standard deviation one and mean zero.
The standardization of data is an approach widely used in the context of gene expression data analysis before clustering. We might also want to scale the data when the mean and/or the standard deviation of variables are largely different.
When scaling variables, the data can be transformed as follows:
Where center(x) can be the mean or the median of x values, and scale(x) can be the standard deviation, the interquartile range, or the MAD (median absolute deviation).
17
A
DDITIONALC
ONSIDERATIONSCustomer clustering can set an organisation up to reap great rewards – companies have seen their conversion rates and in turn revenue increase as well as a higher retention rate of their customers. Customer segmentation allows companies to remain relevant to each customer. Relevance is important to develop loyalty and trust. The digital transformation has accentuated the need individuals have to trust providers of goods and services. Philipp Diekhoner observes, the trust economy places digitalisation in a thought-provoking light; rather than providing continuity to what the industrialisation era had done, which was to remove the human touch from commercial transactions and interactions, the digital revolution is having the opposite effect. It is giving rise to what he considers to be a relationship renaissance empowered by the growth in peer-to-peer commercial trades.
In spite of the fact that the intermediary and enabler for this type of exchanges being technological platforms, customers are now more connected to their goods and services providers. With the emergence of new digital companies and technologies, the way companies and customers interact is rapidly changing.
The relationship is currently undergoing a transformation from traditional centralisation and standardisation to a more relationship and connections driven state of affairs. As Rachel Bosman points out, people have now reduced the level of trust to traditional organizations and now are much more willing to put their trust into a stranger or groups of strangers on the other end of a digital platform. This is mainly due to the fact that they believe that these strangers are more like them, have a higher level of care and, based on reviews from other customers similar to them, they feel a pre-existing connection. Consumers feel or are aware that it is a person just like them on the other end.
Insurance, especially health insurance, is a delicate product for consumers. It helps manage important uncertain outcomes. Consumers depend on insurance at critical and vulnerable times in their lives. As well as managing their healthcare risk, insurance providers are custodians of what consumers consider very sensitive personal medical history information. There is an interdependency between product features and trust. When choosing a product, the level of trust customers require depends on the anticipated risks. In turn, the product features and characteristics engender the level of trust. In the case of choosing a health insurance provider, customers need to be able to trust in the institution and see the true value in the provider.
By remaining relevant and interacting with consumers in a customised manner, trust is more likely to establish an allegiance to grow. Segmentation is an important step in attaining this. When undertaking personalisation actions, companies in the healthcare industry sector should also take into consideration the building of trust between them and their customers as this trust plays a large role in today’s customer loyalty and retention.
18
4. METHODOLOGY
Overview
Clustering algorithms require a varied array of information in order to provide meaningful results. Identifying available sources of information within the organisation, which provides a multi-facetted view of the customer, should therefore be a starting point. The collected information must provide a 360 degrees view of the customer.
Special attention must be taken when handling data in health insurance as it comes in varying levels of granularity. When putting together the input dataset, it is important to always bear in mind which information comes at which level. For example,, claim and interaction information is often at insured person level whereas product portfolio information is generally at policyholder level.
Such product portfolio information is captured at policy holder level but can be extrapolated to all insured persons in the policy. Depending on the type of data being considered, such extrapolation can vary in difficulty or complexity.
This consideration and separation between insured person and policyholder also play a crucial part in the approaches taken for the various business applications. As one policy can be split across various clusters depending on the insured person’s data.
D
ETAILSFor the purpose of this project, the CRISP-DM in combination with SEMMA methodology were followed with a few adjustments. This chapter details the used methodology.
19 Figure 6 - Used Methodology
20
B
USINESSU
NDERSTANDINGEvery industry contains its intricacies and prior to starting on a project of any nature, it is important to understand how the industry and the specific organisation function. This becomes even more relevant when the project involves understanding how the organisation is to interact with its customers or how to increase the level of engagement of the customer vis-à-vis the organisation Due to the complexity of the insurance industry and the specificities of the health insurance industry, it was important to understand the business operations and associated jargon. At its onset, this project began by an onboarding phase to ensure adequate integration within the company and the gaining of the ability to identify the necessary contact points within the organisation as well as the project stakeholders.
During this phase, the project scope and objectives were defined.
Project Scope:
− Apply a clustering algorithm such as K Means or Hierarchichal Clustering to segment the company’s individual customers into unique clusters.
− Identify the variables that best characterise the customers. − Design KPIs to monitor.
− Gain meaningful customer knowledge to enable refined decision making.
Project Objective:
‒ Segment the company’s customers to better analyse and understand the customer portfolio through the creation of distinguished clusters.
‒ Improve Customer Relationship Management and increase customer growth and retention. ‒ Gain meaningful customer knowledge to enable refined decision making.
21
D
ATAU
NDERSTANDING ANDP
REPARATIONAs a clustering exercise had not been previously conducted in the organisation for this particular line of business and at insured person level, and no analysis input dataset had been created for it, it was important to understand the various data sources available as well as the purpose and intent of each of these sources.
There are, within the organisation, three main systems which capture the information and SAS is then used for storing this data.
At the time of project development, datamarts for specific analytical and modelling needs were in a development stage within the team. As these datamarts could not be used, the data used for this project was therefore in its raw state. A major part of the data understanding phase was to understand the keys used to connect data coming from the three systems and the processes that would be required to perform data cleaning activities.
The Data Understanding phase consisted of simultaneous insurance and health jargon understanding as well as the understanding the data sources and structures within the organisation. This phase also consisted of an analysis of a Reference Data Universe developed by other data scientists and analysts in the company to aid in the creation of the base sets for analytics projects. This allowed to identify what data was available, what variables would need to be created and which were the variables with the most likelihood to have a good to high predictive/classification power.
Table 1 - RDU Fields Attribute Name Information entity
Attribute group Attribute definition
Variable type Aggregation time interval
Analytical record
Furthermore, a method for handling claims data needed to be decided upon. A medical claim, identified by unique claim IDs, consists of several items which are stored in different lines and can have varying levels of approval – approved, pending, rejected, awaiting confirmation, among others. Each claim can have different several dates for the various procedures and can also contain information regarding varying medical procedures encompassing varying medical specialties.
During the data understanding stage, an attempt was made to separate medical specialties based on their medical code which would then simplify the creation of additional summary variables. However, due to its complexity, it was decided to use aggregator level medical classification that was
22 already in use for some of the reporting needs within the organisation. This aggregation method is divided into three levels comprising of medical intervention information (regular appointment, home visit), medical specialty (podiatry, orthopedy) as well as medical procedure.
This is the phase where decisions on the time interval were also made. It was decided that data would be collected since time of enrollment so as to be able to identify both short- and longer-term patterns of behaviour.
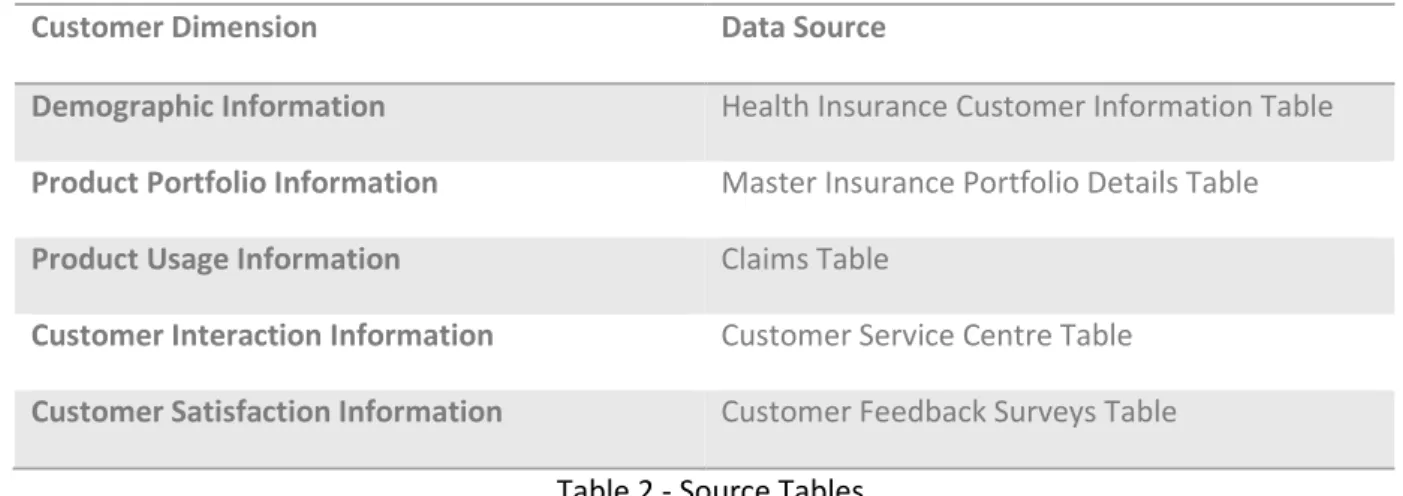
The data sources were divided according to specific customer dimensions as described in Table 2.
Customer Dimension Data Source
Demographic Information Health Insurance Customer Information Table
Product Portfolio Information Master Insurance Portfolio Details Table
Product Usage Information Claims Table
Customer Interaction Information Customer Service Centre Table
Customer Satisfaction Information Customer Feedback Surveys Table
Table 2 - Source Tables
Prior to modelling the distinct clusters, a dataset comprising different customer dimensions (demographic, customer profile, product profile and usage as well as interaction with the company) had to be created. As this dataset was composed of over 800 attributes, a variable selection process was required to improve the understanding and simplify the modelling.
It is crucial to select the most predictive variables through statistical methods prior to inputting the data into the clustering model. Variable selection is the process of selecting a subset of relevant features/variables for use in model construction. This is primarily done to allow shorter execution times, enhanced generalization and simplification of models thus enabling easier interpretation. For this purpose, the numerical data underwent a process of variable clustering followed by principal components analysis. The categorical variables were not used at this stage but were used at a later stage when profiling the customers.
Dimensionality reduction was achieved in two steps. The first one being variable clustering using an R Square Test which was then followed by Principal Component Analysis (PCA). PCA is a statistical method used to reduce the number of variables in a dataset. It does so by joining highly correlated variables, and extracting the most information from each, according to a user defined threshold. This technique provides successful dimension reduction results and solves the multicollinearity problem. Using SAS Enterprise Guide, PCA was achieved using the below code and the number of factors (nFactor) is dependent on the number of factors that step 1 outputs.
23 %LET DI_DG_NUMERIC = STANDARDIZED NUMERIC VARIABLES LIST;
title 'STEP 1';
proc factor data = INPUT_DATASET mineigen=1 flag=0.4 noprint; var &DI_DG_NUMERIC;
where ENTITY_TYPE IN ('Individual'); RUN;
ods graphics on / LABELMAX=300;
ods output OrthRotFactPat = lIBNAME.ORTH_FACTORS;
proc factor data = INPUT_DATASET scree flag=0.4 rotate = varimax out = LIBNAME.factors nfactor=37 priors = MAX;
var &DI_DG_NUMERIC;
where ENTITY_TYPE IN ('Individual'); run;
The input table creation was as follows: − Missing values removal:
Removal of unary variables and variables with a high number of missing values − Variable Clustering and Chi Squared Test
Removal of highly correlated variables and variables with a chi square value below a defined threshold.
− Principal Component Analysis
Dimensionality reduction through a principal component analysis and a chosen ideal number of factors.
Through the variable selection process, the variables which are most likely to be associated with and hence justify customer behaviour were identified and allowed a reduction to approximately 70 variables. These were then standardised to allow for comparison and then further reduced through combination into factors allowing to come up with underlying dimensions of customer behaviour that describe the customers without suffering any information loss. The factors are uncorrelated and represent different dimensions of the customer and will assist in constructing a fuller profile/segmentation of the customer
These customer dimensions, factors and explanation of the top salient variables in each factor are described in Table 3.
24
Customer Dimension
Factor Description Explanation
Claim Related
Claim Cost Claim Cost in the last 12, 24 and 36 months
Claim Rate Claim Ratio since Always, last 24 and last 36 months
Claim Recency & Depth of Relationship with Médis
IndClaim_12M, IndClaim_24M, Num_AnosApoliceEmVigor
Claim Value (Count & Sum) SUMCL_12M, COUNTCL_12M
Claims
Dental (General) Dental Claims variables – frequency and value
Emergency Emergency Claims variables – frequency and value
Gastroenterology Gastro Specialty Claims variables – frequency and value
Surgical Costs Surgery Claims Variables – Frequency and Value
Examination Costs Medical Examination Claims Variables – Frequency and Value
Intensive Care Intensive Care Claims Variables – Frequency and Value
Obstetrics and Gynaecology Obstetrics and Gynaecology Claims Variables – Frequency and Value
Oncology and Radiology Oncology and Radiology Claims Variables – Frequency and Value
Orthopedic & Physiotherapy Orthopedic & Physiotherapy Claims Variables – Frequency and Value
Pediatrics Pediatrics Claims Variables – Frequency and Value
Pulmonology & Immunology Pulmonology & Immunology Claims Variables – Frequency and Value
Vascular Surgery Vascular Surgery Claims Variables – Frequency and Value
CRM Customer Engagement Frequency and Type of Customer Service Calls
Post Consultation Questionnaire Response results to Satisfaction Survey
Customer Profile
Health Scores (BMI and BP indicators)
Biometric indicators
Demographics
Age, Gender and policy
distribution/composition -
Gender composition of policy -
Greater than 55 Age Group -
Non-retired Population -
35-45 Age Bracket -
Policy Related
Composition of the policy
(dependent/non-dependent) -
25
Premium and Commission Val_PremContab_Rolling36Meses, Val_Comissao_Rolling12Meses,
Val_Comissao_YTD_UltMes
Premium and Other Policies Num_ApolicesTotal, Num_ApolicesEmVigor, CLV_NUM_MR_POLICIES
Table 3 - Factors Description
M
ODELINGHigh Performance Clustering (HPCLUS) using Aligned Box Criterion node in SAS Enterprise Miner using Euclidean distance as a distance metric was used in order to apply the K Means clustering algorithm. Various iterations and variations of this model were run prior to choosing the final model. A combination of desirable 7 raw variables and 17 factors selected for input.
The final model inputs were as follows: − Maximum Iteration: 250 − Stop Criterion: Cluster Change − Stop Criterion Value: 50 − Seed Initialization: 12345 − Distance: Euclidean
The model was chosen based on ability to identify clearly distinct segments, validation of the segments based on historical performance and business experience.
26 Figure 8 - Selected Cluster Results
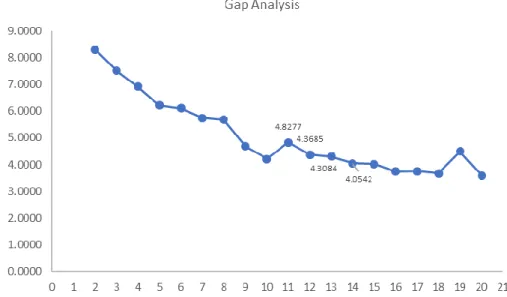
27 Gap statistic
− The Gap statistic is a method to evaluate the ideal number of clusters
− The gap statistic compares the total within intracluster variation for different values of k with their expected values under null reference distribution of the data.
− The estimate of the optimal clusters k will be the value that maximizes the Gap
Figure 9 - Gap Statistic
Results and Discussion
The global peak for the gap statistic is obtained at 4,8277 (11 clusters) after which it reduced and stabilised. A total of 11 clusters were identified with 3 clusters (7, 6 and 10) being relatively close to each other. Table 4 and Figure 10 display the distribution of these clusters.
These clusters were validated with the business stakeholders who identified that the smallest cluster was of irrelevant size and should therefore be forced into the nearest cluster. The final decision was therefore to have 10 clusters.
Each of these clusters were then profiled based on company and basic demographic KPIs which are as follows:
• Claim Ratio • Product Holding • Age Distribution • Gender Distribution
• Relationship with policy holder • Profitability
28 Following the profiling exercise and identification of distinguishing factor for each of the clusters, all 10 clusters were given names. These names were then used in communicating the results of the cluster analysis to the various stakeholders.
The immediate use of the clusters is to fine tune the marketing approach for customer relationship management and leverage on this knowledge for retention and acquisition campaigns. Knowing the company portfolio at insured person level provides the organisatiion with a customer view that they did not previously possess. They no longer have to focus solely on policyholders (the decision makers) but are now able to conduct campaigns tailored to the members of the policies.
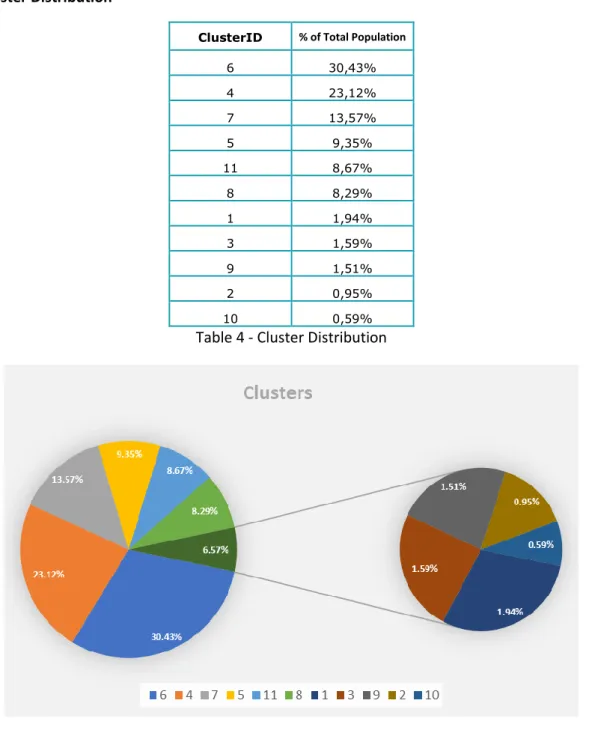
29 Cluster Distribution
ClusterID % of Total Population
6 30,43% 4 23,12% 7 13,57% 5 9,35% 11 8,67% 8 8,29% 1 1,94% 3 1,59% 9 1,51% 2 0,95% 10 0,59%
Table 4 - Cluster Distribution
Figure 10 -Cluster Distribution
• The top 6 clusters contain the highest density of the population. • The bottom 5 can be thought of as the smaller niche clusters
30
M
ODELS
CORINGModel scoring is applying the output of this model to a new dataset. The score of the K Means model can be directly applied to any new data source. There are instances, however, when the rules created by the score code require fine tuning. In these cases, the output of the model could be translated into a decision tree, allowing for calibration of the results which can be turned into a set of rules. This therefore also allows for a simpler business implementation and communication of output to the various stakeholders.
For this project, SAS Enterprise Miner was used for model scoring. While performing the segment profiling, it was identified that some of the cluster members did not make business sense, it was therefore decided that a decision tree would be needed. Fine tuning of the rules extracted from the decision tree was performed so as to create a set of rules which will then be applied to new members of the customer portfolio.
E
VALUATIONIn order to validate the model, it was decided that the results of the clusters would be used in lead generation for marketing campaigns. In this way the company would be able to validate whether the clusters have captured the underlying characteristics of the customers in the various clusters. This would be carried out as per figure 12. The leads would be subdivided into ‘in-pilot’ and out of pilot. Those in-pilot would be the ones on which cluster rules and subsequent business strategies would have been applied. A comparison of the conversion would be done from the non-pilot leads to the pilot leads. The output of this analysis would then be one way to help understand whether or not the clustering algorithm has succeeded.
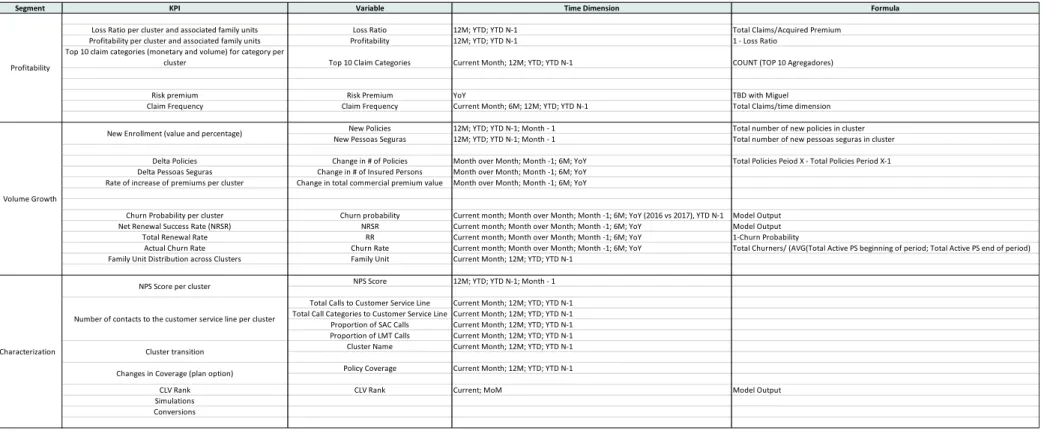
Furthermore, the KPIs identified in Figure 11 would be monitored with the aid of a visualization tool. The business knowledge along with cluster performance would be another way to help evaluate the success and usefulness of the identified customer segments.
31
Segment KPI Variable Time Dimension Formula
Loss Ratio per cluster and associated family units Loss Ratio 12M; YTD; YTD N-1 Total Claims/Acquired Premium Profitability per cluster and associated family units Profitability 12M; YTD; YTD N-1 1 - Loss Ratio
Top 10 claim categories (monetary and volume) for category per
cluster Top 10 Claim Categories Current Month; 12M; YTD; YTD N-1 COUNT (TOP 10 Agregadores)
Risk premium Risk Premium YoY TBD with Miguel
Claim Frequency Claim Frequency Current Month; 6M; 12M; YTD; YTD N-1 Total Claims/time dimension New Policies 12M; YTD; YTD N-1; Month - 1 Total number of new policies in cluster New Pessoas Seguras 12M; YTD; YTD N-1; Month - 1 Total number of new pessoas seguras in cluster Delta Policies Change in # of Policies Month over Month; Month -1; 6M; YoY Total Policies Peiod X - Total Policies Period X-1 Delta Pessoas Seguras Change in # of Insured Persons Month over Month; Month -1; 6M; YoY
Rate of increase of premiums per cluster Change in total commercial premium value Month over Month; Month -1; 6M; YoY
Churn Probability per cluster Churn probability Current month; Month over Month; Month -1; 6M; YoY (2016 vs 2017), YTD N-1 Model Output Net Renewal Success Rate (NRSR) NRSR Current month; Month over Month; Month -1; 6M; YoY Model Output
Total Renewal Rate RR Current month; Month over Month; Month -1; 6M; YoY 1-Churn Probability
Actual Churn Rate Churn Rate Current month; Month over Month; Month -1; 6M; YoY Total Churners/ (AVG(Total Active PS beginning of period; Total Active PS end of period) Family Unit Distribution across Clusters Family Unit Current Month; 12M; YTD; YTD N-1
NPS Score 12M; YTD; YTD N-1; Month - 1 Total Calls to Customer Service Line Current Month; 12M; YTD; YTD N-1 Total Call Categories to Customer Service Line Current Month; 12M; YTD; YTD N-1 Proportion of SAC Calls Current Month; 12M; YTD; YTD N-1 Proportion of LMT Calls Current Month; 12M; YTD; YTD N-1 Cluster Name Current Month; 12M; YTD; YTD N-1 Policy Coverage Current Month; 12M; YTD; YTD N-1
CLV Rank CLV Rank Current; MoM Model Output
Simulations Conversions Profitability
Volume Growth
New Enrollment (value and percentage)
Characterization
NPS Score per cluster
Number of contacts to the customer service line per cluster
Cluster transition Changes in Coverage (plan option)
32 Figure 12 - Pilot Plan for Evaluation
33
D
EPLOYMENTDesigning a data science project, no matter how small the project and how small the measured or predicted impact requires organisational investment. This investment is made in both monetary and manpower resources. Ensuring the survival of a model post implementation is crucial in ensuring that such efforts and investment were not made in vain and no capital is lost.
In order to prevent such losses of employee time, energy as well as productivity, the organisation needs to ensure that there is effective documentation to not have full dependence on a few key employees and to allow the projects to be passed on to other team members; this documentation needs to be as effective as it needs to be kept up to date. Furthermore, the code needs to be kept up to date to ensure that it is free of errors to avoid erroneous results. Failing to maintain the required standard of the model output and results could lead to subprime business decisions being made, which could rapidly translate to lost money. Moreover, maintaining and monitoring models ensures that there is no need for the wheel to be reinvented should a different person need to work on the model. With the clustering model, as the organisation’s portfolio is not expected to undergo major monthly changes, a decision has been made to update the model every 6 months. This is to guarantee that the input variables are still statistically significant; this could mean that some variables need to be removed or it could mean that there should be a recalibration so as to add new variables.
The importance of model maintenance has challenges associated to it. These are as follows: • Keeping all the input correct and fresh.
• Making sure the outputs go to the right places, in the correct formats. • Keeping the code organized for effective updating and maintenance. • Creating and maintaining effective documentation.
• Assessing and tracking model performance. • Effectively deciding when to update the model.
Notwithstanding, with the appropriate level of organisational planning, accountability of the analysts and data scientists as well as commitment to analytics, organisations are able to overcome them and propel themselves to a level in which they can ensure that they are taking full advantage of their models with a high degree of confidence.
Furthermore, models are meant to be created in order to generate business value – else they would be a complete misuse of organisational resources - be it in monetary terms or in the form of process improvements. The failure to monitor and maintain models could result in financial loss for the organisation.
There is extreme value to be obtained from predictive analytics models. They become organizational assets which are central in making paramount business decisions in the form of opportunity finding,
34 process reengineering as well as potential risk evaluation. An outdated or underperforming model could put decision makers and their respective decisions at risk for trustworthiness and accuracy, which in the long run could negatively affect the organisation’s bottom line and cause hard-to-repair damages to the business
Continuous monitoring allows for the evaluation of the whether the changes in the organisation’s operating environment such as products, exposures, activities, customers and market conditions require modifications, adjustments and rethinking of the original models. As advised by Accenture, any model limitations or assumptions identified in the development stage should be assessed as part of ongoing monitoring. Practically speaking, the monitoring of a model initiates at the time that the model is launched into production for business. There are certain requirements for this monitoring process and they are as follows: This monitoring process should have a frequency appropriate to the nature of the model, the availability of new data or modelling approaches, and the magnitude of the risks involved. In our view, this should be clearly laid out as part of a monitoring standards document.
35
5. CONCLUSIONS
The customer segmentation models have the ability to identify the ideal k number of clusters. However, the ideal model output cannot always be translated into business outputs. It is important to know when to compromise in order to obtain true value from the model output.
Despite the magnitude of the customer portfolio, choosing to have 20 customer segments could never really translate into any actionable items as this would require extreme personalisation. It is important however to not forget that, despite the similarities of the customers within a cluster, a customer’s individuality should still prevail.
The segmentation allows the organization to have its initial subset of clients which can then be more closely looked at depending on the actions. Furthermore, irrespective of model sophistication, it is always crucial to take into consideration the in-house knowledge of the client base and of the industry. In health, this would be particularly important specially if the output is to be used for awareness campaigns. This is because we would not want to approach customers that the model believes belong to a specific group based on certain characteristics but in a real-world scenario involving health conditions, that customer does not fit the profile. As this line of business deals with customers’ health, it is important to always have a cautious and sensitive approach from results to action. There is no guarantee of the type of response that would be obtained from customers if the focus is on the health condition but rather an approach in terms of preventive or careful proactive actions need to be taken.
For example, in the event that a group of customers with similar usage characteristics to those with a higher tier product has been identified, in order to drive an upsell campaign it cannot be shown to the customers that the organization is aware that they have a probability to spend more due to their characteristics.
Maximising customer value is vital to surviving in today’s competitive world – amidst the rising customer demands, companies need to be able to differentiate the most profitable customers from the least profitable ones. This ensures that companies will stay relevant, meet customer demands, attract the desired type of customers while promoting growth.
Policy composition (age distribution and family relationships), types of claims and product portfolio proved to be key distinguishing features in cluster creation within the health industry. The model has the ability to naturally segment customers based on the various life stages displaying a diversified customer portfolio as well as paving the way for transition analysis.
The understanding of when the customers join, how they move throughout their customer lifecycle allows companies to provide a more guided customer journey and experience. This also provides cross-sell opportunities for companies with a diversified product offering and upsell opportunities for companies focusing solely on health.
Health insurance providers need to make the most use of the customer segmentation to not only build a company-to-client relationship but to also allow customers to take that leap of faith of trust that will help retaining a loyal customer base.
36
6. LIMITATIONS AND RECOMMENDATIONS FOR FUTURE WORKS
This project lays one of the founding stones for additional advanced analytics projects in the organisation. The subdivision into clusters has allowed for a deeper understanding of the company’s customer portfolio.
This therefore allows for personalised marketing campaigns. The results of these campaigns can then be used as validation for the cluster analysis. Should the success rate of the campaign be satisfactory, it can validate that the clusters have in fact captured the nuances of the customers. Should they not be satisfactory, it could mean that the clusters need to be re-evaluated.
Cluster Analysis can have increased value when the output of customer lifetime value models is included as input variables allowing for the organisation to focus on attracting and retaining customers that will bring the most value.
Understanding and forecasting each segment’s lifetime value enables companies to pinpoint to those segments that offer the greatest profit potential and then make strategic decisions about product, service and retention strategies to best serve the customers within those segments. It also enables management to redirect retention efforts and other expenditures away from the least profitable segments and focus these resources elsewhere.
Customer journey forecasting would be a logical continuation of the clustering model; as the company now knows the customer portfolio it possesses and knows which customers it wishes to attract or maintain. Through conducting a customer journey forecast, it would be enabled with the necessary tools to keep customers happy, engaged and with the company for longer.
With all this in mind, a limitation that arose in the year 2018 is the implementation of the GDPR which sets limits on what companies can and cannot do with the information collected from customers. Therefore, prior to making use of the segments for any targeting efforts, the involved departments need to ensure that the information being used is GDPR compliant.
37
7. BIBLIOGRAPHY
Executive Papers
Baker Tilly (2015). Customer Segmentation provides Foundation to Increase Customer Life Time Value.
Clarke, R., & Libarkian, A. (2014). Unleashing the value of advanced analytics in insurance. Deloitte (2014). Insurance Analytics: Driving insight to gain advantage.
Meltzer, M. Segment Your Customers Based on Profitability.
PriceWaterhouseCoopers Consumer Finance Group (2009). Customer segmentation: how to harness its profit-building power.
Purcell, B. (2017). Q&A The Secrets of Successful Segmentation Revealed. Retrieved from Forrester SAS: Insurance Solution Brief, (2009). How can we attract new, profitable customers and retain our
existing ones.
SEI Executive Connection Insights (2014). Can Segmentation Lead to Sustainable Profits? Webtrends (2011). White Paper: Segmentation in the Healthcare Industry.
Articles
Abbas, O. A. (2007). Comparison Between Data Clustering Algorithms. The International Arab journal
of Information technology, 5 (3), 320-325.
An introduction to Cluster Analysis for Data Mining (2000).
Arumawadu, H. I., Rathnayaka, R. M., & Illangarathne, S. K. (2015). Mining Profitability of Telecommunication Customers Using K-Means Clustering. Journal of Data Analysis and
Information Processing, 3, 63-71.
Athanassopoulos, A. D. (2000). Customer Satisfaction Cues to Support Market Segmentation and Explain Switching Behaviour. Journal of Business Research, 47, 191-207. Retrieved from Elsevier
Bação, F., Lobo, V. B., & Painho, M. Self-organizing Maps as Substittutes for K-Means Clustering. Title
of Periodical, volume number (issue number), pages.
Borchers, B., & Ossege, A. (2015). An Innovative Method of Customer Clustering. SAS Papers Bucker, T. (2016). Customer Clustering in the Insurance Sector by Means of Unsupervised Machine