UNIVERSIDADE DE LISBOA
FACULDADE DE CIÊNCIAS
DEPARTAMENTO DE BIOLOGIA ANIMAL
EVALUATING ECOSYSTEM SERVICES TRADE-OFFS DUE TO LAND USE
CHANGES: TRANSITION TO AN IRRIGATED AGRICULTURE LANDSCAPE
ANA BRITO LEMOS
MESTRADO EM BIOLOGIA DA CONSERVAÇÃO
DISSERTAÇÃO ORIENTADA POR:
Cristina Branquinho e Pedro Pinho
II Agradecimentos
Quero em primeiro lugar agradecer aos meus orientadores por todo o apoio, tempo e ajuda que me deram, por toda a disponibilidade e por tudo o que me ensinaram.
A todo o grupo eChanges, que se mostraram sempre disponíveis para ajudar, em especial à Lena, por toda a ajuda com os meus chás e por todo o tempo disponibilizado para me ajudar!
Ao Mário Boieiro, por toda a ajuda com as minhas abelhas!
Um agradecimento muito especial à Ana Ilhéu, da EDIA, que colaborou em todas as fases deste projeto, que sem a sua colaboração não teria sido possível.
Quero também agradecer aos meninos da FCUL, Martinha, Pocinhas, Teté e Zé, por todos os dias em que trabalhámos juntos e em especial à Rita, pelos nascer do sol a contar passarinhos e os dias passados a trabalhar no jardim!
Ao Nuno, Rochinha, Sofia e João, por estarem lá desde o inicio! E porque podemos não estar sempre juntos mas estamos sempre lá!
Ao JD e ao Tomy pela paciência quando os vou chatear.
Aos meninos com quem passei as tardes de Verão depois de dias de trabalho! Por todos os momentos de convívio que depois davam motivação para continuar a trabalhar no dia seguinte, pelos jantares e pelas saídas cheias de sorrisos e boa disposição! Em especial à Rita, ao André, à Patrícia, ao Gonçalo, ao Pedro, à Ju, à Bea, ao Rafa, ao Sousa e ao Tomás, com quem as tardes e as noites divertidas continuaram bem depois do Verão acabar!
Aos F4, Mike, Pepe e Pocinhas, e ainda à Martinha e à Babs por todos os momentos bons, que foram muitos, por toda a companhia, por todos os risos e por toda a ajuda e apoio durante este longo ano!
III Abstract
Ecosystem services are the benefits people obtain from ecosystems. Land-use and related land-cover modifications caused by agriculture aim at increasing the supply of selected or bundles of ecosystem services, on which human societies depend. However, agriculture also causes un-intended changes in ecosystem functioning and associated ecosystem services of which agriculture depends. These services are provided by varied species, but because agriculture is a major driver of biodiversity loss, those services are affected. Of special concern is the shift to intensive agriculture, which causes the most losses of biodiversity and associated ecosystem services. For example, pollinators have a major role in agriculture food production, yet agricultural expansion and intensification is one of the main drivers for pollinator loss. The general aim of this work was to evaluate how ecosystem services that support agriculture were affected by agriculture intensification. To do so we analyzed, in a spatial explicit way, how habitat quality, pollination, carbon storage and soil-related ecosystem services like nutrient cycling changed in the transition of an extensive agriculture landscape to irrigated agriculture landscape, in Alentejo, Portugal. Results showed a decrease in habitat quality and crop pollination services, where irrigated areas show a lower value for these values than more natural land use types, and variation in the carbon storage, where areas of permanent irrigated crops show higher amounts of carbon stored than land uses types with annual crops. Nutrient cycling showed no significant differences between land uses. Overall, Riparian Galleries provided the highest ecosystem service capacity, while irrigated areas were the ones with the lowest capacity to provide the ecosystem services analyzed. These results allowed to evaluate the current situation in the area and therefore suggest measures to minimize the loss of some important ecosystem services, like the promotion of patches of natural vegetation surrounding areas where the ecosystem services are most needed.
Keywords: Ecosystem services; Agriculture; InVest, Irrigation; Alqueva
Resumo
Os serviços dos ecossistemas são os benefícios que o ser humano obtém a partir dos ecossistemas e que são necessários para o seu bem-estar. Estes são classificados pelo Millennium Ecossistem Assessment em quatro categorias principais: provisionamento, suporte, regulação e culturais. As alterações nos ecossistemas (por exemplo alteração do tipo de uso do solo ou poluição) podem ter impacto na capacidade dos ecossistemas produzirem esses serviços. Uma das maiores alterações do uso do solo a nível mundial foi a substituição de ecossistema naturais por ecossistemas agrícolas (aumento da área agrícola em 466% desde 1700).
A agricultura fornece e depende de vários serviços do ecossistema. A paisagem agrícola não só suporta a produção de alimentos, fibras e combustíveis, mas também providencia uma grande variedade de benefícios públicos como o sequestro de carbono e paisagens esteticamente agradáveis. Exemplos destes benefícios são a reciclagem de nutrientes, o controlo do microclima local, regulação dos serviços hidrológicos locais, regulação da abundância de organismos não desejados. Os serviços dos ecossistemas dependem das espécies presentes no local para poderem ser produzidos. No entanto, a intensificação da agricultura é uma das principais ameaças a biodiversidade. A agricultura moderna simplificou os sistemas agrícolas tradicionais e substituiu as funções biológicas originalmente providenciadas por comunidades diversas de organismos, com uma maior introdução de energia e agroquímicos no sistema. As formas industriais de agricultura têm como objetivo remover as limitações à produtividade das plantas. Estas práticas de gestão podem afetar a condição dos ecossistemas através de impactos, como por exemplo, a erosão do solo, a qualidade da água e a emissão de gases efeito de
IV
estufa. Estes efeitos podem ser exacerbados em regiões semiáridas, onde é feita irrigação para ultrapassar a limitação da disponibilidade de água.
Tendo isto em consideração, a qualidade do habitat é um fator importante para a agricultura, uma vez que uma elevada biodiversidade promove muitos serviços do ecossistema que sustentam a agricultura. A polinização é outro dos serviços necessários à agricultura, visto que a maioria das plantações dependem ou beneficiam da presença de polinizadores. No entanto, várias espécies de polinizadores estão em vias de extinção e as populações de polinizadores estão a diminuir, sendo a expansão e a intensificação da agricultura uma das suas principais ameaças. O armazenamento de carbono é outro serviço de ecossistema que pode ser comprometido pelas práticas agrícolas e que simultaneamente pode ser extremamente valioso para a agricultura. O carbono pode ser encontrado em vários compartimentos do ecossistema, sendo um deles a biomassa acima do solo (por exemplo árvores). Quando a paisagem é convertida para agricultura este carbono é perdido. Melhorar o carbono orgânico do solo é uma das formas da agricultura ajudar a diminuir esta perda de carbono, e pode também promover a produção de alimentos, sendo dessa forma também um serviço fornecido à agricultura.
O solo tem a capacidade de reciclar os a matéria orgânica e de promover a circulação de nutrientes no sistema. Os organismos do solo degradam e decompõem a matéria orgânica, promovendo assim, por exemplo, a fertilidade dos solos. A capacidade de decomposição do solo pode ser alterada devido ao crescimento de plantas e à fertilidade do solo ser mantida não através da natural circulação de nutrientes no sistema, mas através da introdução de fertilizantes que podem ter consequências negativas tanto para os ecossistemas (e.g. poluição dos cursos de água) como para a saúde humana (e.g. problemas respiratórios). Alem disso, a constante movimentação dos solos pode ter como consequência o aumento da erosão dos mesmos e ainda a perda de matéria orgânica, podendo afetar assim a capacidade de circulação de nutrientes.
Avaliar os serviços dos ecossistemas assim como os seus trade-offs pode ser utilizado para demonstrar o valor relativo desses serviços, tornando mais evidente os custos das atividades que os degradam. Mapear os serviços do ecossistema e os trade-offs que ocorrem na alteração do tipo de uso do solo, pode ser de bastante auxílio na sua gestão, especialmente se este mapeamento for realizado com resolução ao nível da propriedade e da cultura agrícola.
Deste modo, este trabalho tem como objetivo avaliar os trade-offs nos serviços do ecossistema devidos a alteração do uso do solo numa paisagem que sofreu uma alteração de uma agricultura extensiva para uma agricultura de irrigação. Para isto, será utilizado o software InVest, recorrendo a dados de uma área agrícola irrigada pela barragem do Alqueva (bloco de irrigação de Monte Novo). Isto permitirá avaliar os trade-offs dos serviços do ecossistema na área e melhorar estratégias de gestão dos mesmos.
De forma a recolher os dados necessários para as bases de dados foram realizados tanto pesquisa bibliográfica como recolha de dados no local de estudo. Amostragens de aves (qualidade do habitat) e polinizadores (serviço de polinização) foram realizadas no terreno e complementadas com pesquisa bibliográfica posterior. Para a análise da decomposição foi utilizado um protocolo estandardizado, o Tea
Bag Index. Para isto foi recolhido solo no campo e o protocolo foi realizado no laboratório.
Na transição de uma agricultura extensiva para intensiva observou-se um aumento da área irrigada de 4.75% para 56.32%. Como consequência os resultados mostram alterações ao nível dos vários serviços estudados. Quanto à qualidade de habitat verificou-se um decréscimo dos valores deste serviço. Os resultados mostraram também que as galerias ripícolas são o uso do solo com maior índice de qualidade de habitat. Estas comunidades naturais são de extrema importância, uma vez que podem promover a conectividade entre outras manchas de habitat. O mapa atual mostra um menor armazenamento de carbono que o mapa histórico (menos 10%). O uso do solo com maior armazenamento de carbono é as
V
galerias ripícolas para os dois mapas. No mapa atual o carbono é armazenado principalmente nas áreas irrigadas com plantações permanentes, como os olivais e as vinhas. Uma das limitações da avaliação deste serviço do ecossistema, é ter sido baseado em dados da bibliografia, pelo que seria interessante reavaliar este serviço com medições realizadas no campo para os vários compartimentos de carbono existentes. Quanto ao serviço de circulação de nutrientes medido através da taxa de decomposição, não se encontraram diferenças significativas entre os vários usos do solo em análise. Estes resultados podem estar a ser verificados pelo pouco tempo que passou desde o inicio da irrigação. Uma vez que o protocolo utilizado para medir a taxa de decomposição foi conduzido em laboratório, os valores obtidos representam o potencial de decomposição dos solos e não a sua taxa de decomposição real.
Quando todos os serviços foram considerados no seu conjunto, as galerias ripícolas mostraram ser o uso do solo com maior capacidade de providenciar o conjunto dos serviços do ecossistema analisados, sendo que os usos do solo irrigados e com maior impacto humano são aqueles que mostram uma menor capacidade de fornecer estes serviços. Assim, medidas como o aumento do número de manchas de usos do solo como galerias ripícolas e montado, de forma a que estes possam aumentar a conectividade das áreas naturais e fornecer serviços do ecossistema a LULC que não os possuam pode ser uma das medias a ser implementada de forma a otimizar tanto a agricultura como os serviços do ecossistema no bloco de irrigação de Monte Novo.
Este estudo mostra que a intensificação agrícola através da substituição de culturas extensivas por irrigadas levou a alterações nos serviços dos ecossistemas na área de estudo. A construção de um modelo espacialmente explicito usando programas como o InVest são uma boa ferramenta para analisar e avaliar as alterações que uma área sofre devido às alterações no uso do solo e devem ser tidos em consideração quando são planeadas medidas de gestão com objetivo de promover uma agricultura mais sustentável.
VI Conferences
Ana Lemos, Cristina Branquinho & Pedro Pinho. 2016. Evaluating ecosystem services trade-offs due to land use changes: transition to an irrigated agriculture landscape at the Silvo-Pastoril World Congress, Évora 2016 – winning 2nd place for best poster
VII Index
1 Introduction ... 1
1.1 Natural Capital and Ecosystem Services ... 1
1.2 Agroecosystems... 3
1.3 Drylands and water ... 5
1.4 From extensive agroecosystems to irrigated agroecosystem ... 6
1.4.1 Habitat Quality ... 6
1.4.2 Crop Pollination ... 7
1.4.3 Nutrient Cycling ... 7
1.4.4 Carbon Storage ... 8
1.5 Mapping ecosystem services in a spatial explicit way ... 9
1.6 The study area: the Montado system in the Alentejo ... 9
1.7 Goals ... 10
2 Methods ... 11
2.1 Study area ... 11
2.2 Land-use Land-cover mapping ... 11
2.3 Modeling ecosystem services ... 12
2.3.1 Habitat quality ... 12 2.3.2 Crop pollination ... 14 2.3.3 Carbon storage ... 14 2.3.4 Nutrients cycling ... 14 2.4 Data analysis... 15 3 Results ... 16
3.1 Mapping of the Land-use Land-cover types (LULC) ... 16
3.2 Modeling Ecosystem Services ... 18
3.2.1 Habitat quality ... 18
3.2.2 Crop pollination ... 22
3.2.3 Carbon storage ... 26
3.2.4 Nutrient Cycling ... 30
3.3 Ecosystem services overall comparison and potential trade offs ... 31
4 Discussion ... 33
4.1 Modeling Ecosystem Services ... 33
4.1.1 Habitat quality ... 33
4.1.2 Crop pollination ... 34
4.1.3 Carbon storage ... 35
4.1.4 Nutrient Cycling ... 36
4.2 Limitations ... 37
4.3 Ecosystem services overall comparison and potential trade offs ... 38
VIII
5 Final Remarks... 40
6 Bibliographic References ... 41
Appendix A. Pollinators database ... 47
Appendix B. Bird Species identified in the Monte Novo irrigation site ... 48
IX List of Figures
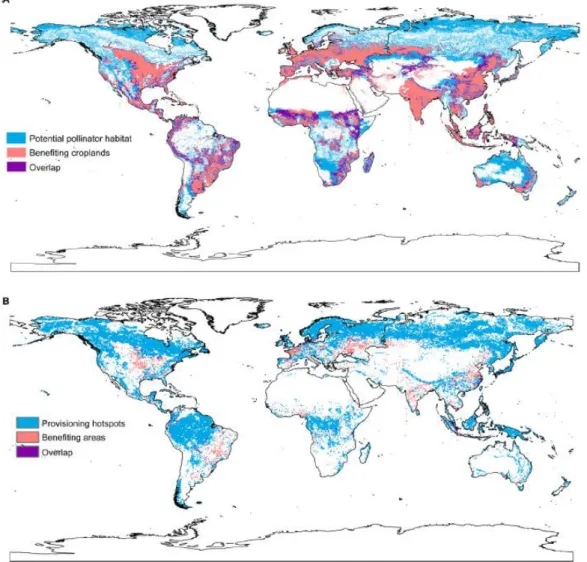
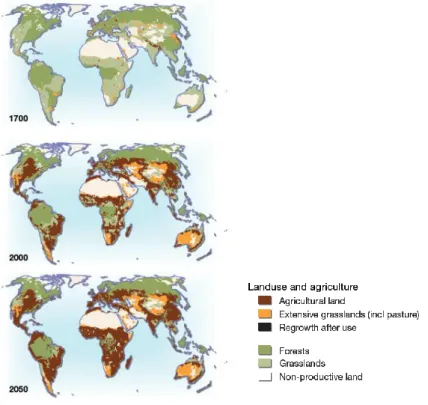
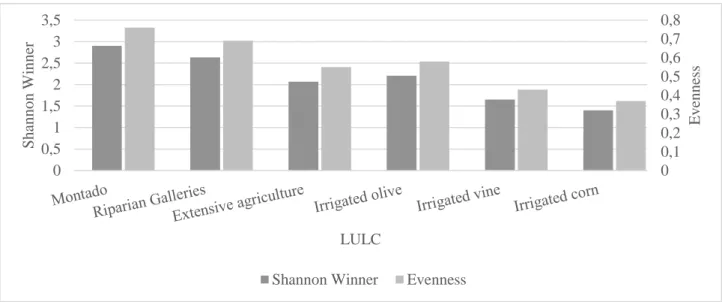
Figure 1.1.1 - Examples of ecosystem services flow. A - Crop Pollination service flow from habitat to cropland. B - Climate change regulation service flow. Spatial connections between vulnerable agricultural areas and hotspots for climate regulation services (Serna-Chavez et al. 2014). ... 2 Figure 1.2.1- Land converted to agriculture from 1700 to 2000 and projection of this variation till 2050 (Nelleman et al. 2009)) ... 3 Figure 1.2.2 - Agriculture related ecosystem services dynamics. Agriculture can suffer a feedback impact along a chain of effects, in which many ecosystem services important to sustain agriculture might be degraded by agriculture itself. ... 4 Figure 2.1.1 - Study area limits. The study area, the Monte Novo irrigation site, is situated around the village of São Manços, near the city of Évora. ... 11 Figure 3.1.1 – Distribution of the LULC on the Monte Novo irrigation site. A - before the site was irrigated – historical LULC map; B- after the site was irrigated (2015) – current LULC map. The areas presented in grey are the ones that were aggregated in an “other occupations” category due to the small area of occupation. ... 16 Figure 3.1.2 - Comparison of the historical areas with the current areas for each LULC. Each LULC is divided in two columns, being the first referent to the historical map and the second column referent to the current map. ... 17 Figure 3.2.1.1 - Diversity totals results – Total species of birds identified per LULC and total individuals of birds identified per LULC in the Monte Novo irrigation site. N= 3 per LULC type, except for irrigated corn: N=2, error bars represent the standard deviation. ... 18 Figure 3.2.1.2 - Diversity indexes results for birds per sampled LULC for the Monte Novo irrigation site ... 19 Figure 3.2.1.3 - InVest results for habitat quality service. The results for the habitat quality index vary between 0 and 1, being 1 the higher habitat quality and 0 the lowest. A- historical LULC map; B- current LULC map. ... 20 Figure 3.2.1.4 – Percentage of variation between the historical LULC map and the current LULC map that resulted from the InVest models. The increase in habitat quality score is shown in a scale of green, while the decrease in the habitat quality score is shown on a scale of red. ... 21 Figure 3.2.1.5 – Difference in the average habitat quality score for each LULC for the Monte Novo irrigation site. The areas that did not exist in historical map but occur in the current one are being compared to their equivalents – the “irrigated olive” is being compared to the “extensive olive” in the historical map, the “irrigated vine” is being compared with the “extensive vine” in the historical map and the irrigated crops (“irrigated cereal”, “irrigated forage”, “vegetable crops” and “corn” are being compared to the “irrigated crops” in the historical map) ... 21 Figure 3.2.2.1 - Diversity totals results – Total genera of pollinators identified per LULC and total individuals of pollinators identified per LULC in the Monte Novo irrigation site ... 22 Figure 3.2.2.2 – Diversity indexes results for pollinators per sampled LULC in the Monte Novo irrigation site ... 23
X
Figure 3.2.2.3 - InVest Crop Pollination model results for the Monte Novo irrigation site. The values shown refer to the pollinator abundance index, which was calculated for each cell of the map when the model was run, and varies from 0 to 1. A- historical LULC map; B- current LULC map. ... 24 Figure 3.2.2.4 - Percentage of variation of the pollinator abundance index between the historical LULC map and the current LULC map. The increase in pollinator abundance index is shown in a scale of green, while the decrease in the pollinator abundance index is shown on a scale of red. ... 25 Figure 3.2.2.5 - Comparison of the average pollinator abundance index per LULC for the Monte Novo irrigation site. The areas that did not exist in historical map but occur in the current one are being compared to their equivalents – the “irrigated olive” is being compared to the “extensive olive” in the historical map, the “irrigated vine” is being compared with the “extensive vine” in the historical map and the irrigated crops (“irrigated cereal”, “irrigated forage”, “vegetable crops” and “corn” are being compared to the “irrigated crops” in the historical map) ... 25 Figure 3.2.3.1 - InVest results for Carbon storage service (Mg/pixel). A pixel is 900m2. A- historical LULC map; B- current LULC map. ... 28 Figure 3.2.3.2 – Percentage of variation in the carbon storage between the historical LULC map and the current LULC map. The increase in carbon storage index is shown in a scale of green, while the decrease in the carbon storage is shown on a scale of red. ... 29 Figure 3.2.3.3 - Difference of total carbon stored (Gg) per LULC. The areas that did not exist in historical map but occur in the current one are being compared to their equivalents – the “irrigated olive” is being compared to the “extensive olive” in the historical map, the “irrigated vine” is being compared with the “extensive vine” in the historical map and the irrigated crops (“irrigated cereal”, “irrigated forage”, “vegetable crops” and “corn” are being compared to the “irrigated crops” in the historical map) ... 29 Figure 3.2.3.4 - Carbon per area for each LULC in the Monte Novo irrigation site. Based on the results from the InVest carbon storage model ... 30 Figure 3.2.4.1 - Tea bag index results. Variation of the average percentage weigh of the tea bags per LULC during the sampling period. ... 30 Figure 3.3.1 - Summary of the ecosystem service delivery distribution in the Monte Novo irrigation site. The map represents the sum of the provision of each ecosystem service studied for the different LULC in the area. The capacity of delivery ranges from red (lowest delivery capacity) to green (highest delivery capacity). ... 31 Figure 3.3.2 – Ecosystem service relative importance per LULC in the Monte Novo irrigation site for the current map. Each ecosystem service was scaled from 0 to 100 and then calculated for each LULC, therefore LULC with higher values for the ecosystem services than the others are more important in the provision of that ecosystem service. ... 32
XI List of tables
Table 1.2.1 – Ecosystem services to and from agriculture divided according to MEA categories. Adapted from Zhang et al (2007). ... 4 Table 2.3.1.1 - Summary of the impacts distances used for each threat in the habitat quality InVest model. ... 13 Table 2.3.1.2 - Habitat classification for each LULC in the InVest Habitat Quality model. For each LULC a value from 0 to 1 was attributed according to their capacity to be a habitat for the bio indicator group in use, birds. ... 13 Table 3.2.1.1 - Summary of the diversity index results per LULC ... 18 Table 3.2.1.2 - Mann Whitney U to compare the habitat quality score for LULC that occur in both historical and current LULC maps. N = Number of polygons of the LULC in the historical map + number of polygons of the LULC in the current map. ... 22 Table 3.2.2.1 - Summary of diversity totals and diversity indexes for pollinators for the sampled LULC. ... 23 Table 3.2.2.2 - Mann Whitney U to compare the habitat quality score for LULC that occur in both historical and current LULC type. N = Number of polygons of the LULC in the historical map + number of polygons of the LULC in the current map. ... 26 Table 3.2.3.1 - Average value for Carbon pools (Mg/ha) (Complete table – Appendix B) ... 27 Table 3.2.4.1 - Kruskal Wallis resuts for the comparison of the decomposition rate from the TBI protocol for different LULC in the Monte Novo irrigation site. ... 31
1 1 Introduction
1.1 Natural Capital and Ecosystem Services
Natural Capital, ecosystem services and natural resources are essential to human well-being and economic prosperity (Potts et al. 2015). Ecosystem services are the direct and indirect benefits that people derive from ecosystems and their biodiversity (Groot et al. 2010; EME 2012).
Society benefits in a multitude of ways from nature in the form of food production, the provisioning of clean drinking water, the recycling of wastes, and the pollination of crops amongst many others. One of the strengths of the ecosystem service concept is that it reveals a broad picture of the costs and benefits of different management choices (Daily et al. 2009). These ecosystem services are all underpinned by biodiversity, thus the conservation and sustainable use of biodiversity is a key challenge for all sectors of society (Potts et al. 2015). It is estimated that 60 percent of the world’s ecosystem are degraded or used unsustainably, which has led to a decline in the services that ecosystems provide us as well (Reidsma et al. 2006).
Ecosystem Services can be classified in several ways. Yet, the most common is the one used by the Millennium Ecosystem Assessment (MEA, 2005a), which states that ecosystem services can be divided in four main categories:
i) Provisioning Services – these are the products with market value obtained from ecosystems including food, fiber and fuel. Genetic resources, biochemical, natural medicines, pharmaceuticals, ornamental resources and fresh water are also included in this category; ii) Cultural Services – These are nonmaterial services people obtain from ecosystems through
spiritual enrichment, cognitive development, reflection, recreation and aesthetic experiences;
iii) Regulating Services – Are the benefits, with no market value, obtained from the regulation of ecosystem processes like air quality maintenance, climate and water regulation, erosion control, regulation of human diseases, biological control, pollination and storm protection; iv) Supporting Services – These are the ecosystem services, with no market value, that are necessary for production of all other ecosystem services. They differ from all other ecosystem services in that their impacts on people are either indirect or occur over a very long tie, whereas changes in the other categories have relatively direct or short-term impacts on people.
Europe uses the Common International Classification of Ecosystem Services (CICES) system, which is the same system that is used by the European Union Mapping and Assessment of Ecosystems and their Services framework (Maes et al. 2013). This system was proposed to minimize the problems that arose with the use of many different classifications of ecosystem services, especially when comparing different studies or integrating ecosystem services assessments with other data (Haines-Young & Potschin 2011). CICES classifies ecosystem services in three main groups:
i) Provisioning services: includes all material and energetic outputs from ecosystems
ii) Regulating and maintenance services: all the ways in which ecosystems control or modify biotic or abiotic parameters that define the environment of people. These ecosystem outputs are not consumed but affect the performance of other services
iii) Cultural and social services: includes all non-material ecosystem outputs that have symbolic, cultural or intellectual significance (Haines-Young & Potschin 2011).
Ecosystem services are not homogeneous across the landscape and they are not a static over time (Fisher et al. 2009). Areas that provide ecosystem services may in many cases differ from those which
2
benefit from those ecosystem services (Syrbe & Walz 2012). Because of this, it is possible to distinguish several types of spatial relations between ecosystem service providing areas and ecosystem service benefiting areas (Fisher et al. 2009). Divergences between ecosystem service provision and benefit can cause trade-offs associated with market failure and social imbalances (Figure 1.1.1) (Elmqvist et al. 2010).
Figure 1.1.1 - Examples of ecosystem services flow. A - Crop Pollination service flow from habitat to cropland. B - Climate change regulation service flow. Spatial connections between vulnerable agricultural areas and hotspots for climate regulation services (Serna-Chavez et al. 2014).
Ecosystem service maps are a useful tool for visualizing the effects of land use change on ecosystem services and the associated trade-offs (Goldstein & Manning 2008). Besides ecosystem service maps, a set of indicators facilitates the understanding of the effects of land use on change ecosystem services (Layke et al. 2012). The explicit quantification and mapping of ecosystem services are considered as one of the main requirements for the implementation of the ecosystem services concept into environmental institutions and decision making (Burkhard et al. 2012). This is necessary because ecosystem services provision depend on the location of each land-cover type. For example, causing an extra input of nitrogen for agriculture can be either exported outside the system if agriculture is done nearby a land already saturated with nitrogen (e.g. a corn field), or can be incorporated into the system if it is located nearby a non-saturated ecosystem (e.g. a forest) (Jackson et al. 2008). These trade-offs analysis can be done by mapping ecosystem services, which may also provide further information: 1) how to optimize ecosystem services while benefiting biodiversity (Willemen et al. 2013); 2) what are
3
the trends in provision of ecosystem services and how different drivers affect them over time (Malinga et al. 2015) ; 3) what are the synergies and trade-offs between multiple ecosystem services (Queiroz et al. 2015); 4) the costs and benefits of maximizing ecosystem services (Schägner et al. 2013); and 5) how supply and demand of these ecosystem services varies spatially (Schulp et al. 2014). Land use and related land cover modifications have a strong impact on ecological functioning. Alterations of ecological integrity lead to increasing or decreasing supplies of selected or bundles of ecosystem services, on which human societies depend (Burkhard et al. 2012). Worldwide, there has been an extensive conversion of land use over the past decades, with loss of natural habitat elements, being that agriculture has been the major responsible for this changes in the last 300 years (Arroita et al. 2013). The land-use changes due to agriculture are one of the most important drivers of biodiversity loss. Together with other environmental changes, such as climate change, pollution, and biotic invasions, these have degraded biodiversity to such an extent that the contribution of many ecosystem services to human well-being is becoming increasingly eroded (Hooper et al. 2005; MEA 2005b; UK National Ecosystem Assessment 2011).
1.2 Agroecosystems
Covering over a third of total global land area, agriculture (croplands and pastures) represents humankind’s largest engineered ecosystem (Zhang et al. 2007). The area of cultivated land increased globally 466% from 1700 to 1980, to such an extent that croplands and pastures have become one of the largest “biomes” on the planet (Figure 1.2.1) (Arroita et al. 2013). Agriculture can be, more or less intensive, that is with different agricultural practices and techniques that have different degrees of impacts on the environment (Bennett 1973). Intensification is a consequence of the so-called “Green-Revolution”, which promoted the expansion on high-yielding crops that depend on the use of synthetic fertilizers and pesticides, and on the implementation of irrigation and mechanization (Arroita et al. 2013) to consistently sustain their rates output (McLaughlin & Mineau 1995).
4
Modern agriculture has simplified traditional agroecosystems and replaced biological functions, originally provided by diverse communities of organisms, with increased external inputs of energy and agrochemicals. Industrial forms of modern agriculture aim to remove limitations to plant productivity mainly by irrigation and adding inorganic nutrients, by crop breeding to improve the genetic basis for plant productivity, mechanical loosening of the soil structure that allows for better root penetration and growth and replacing biological pest and weed control with pesticides (Tilman et al. 2001). These management practices can affect ecosystem conditions through impacts on, for example, soil erosion, water quality, or greenhouse gas emissions (Kragt & Robertson 2014). Industrial agriculture depends on expensive inputs from off the farm, many of which generate wastes that harm the environment. Synthetic chemical pesticides and fertilizers are polluting soil, water and air, harming both the environment and human health (Horrigan et al. 2002). One example of this was the discovery of the Haber Bosch process in 1913, that is still used today to produce ammonia (a reactive form of nitrogen that plants can use), which spurred a leap in global crop yields. However, all this reactive nitrogen then cycles from one polluting form to another: nitric acid, which causes acid rain; nitrates in waterways; urban ozone and soot particles which endanger respiratory health (Kaiser 2001). However, these practices made agriculture a major driver of environmental change, leading to environmental damage and degradation of several ecosystem services (Sandhu et al. 2010).
Natural ecosystems tend to have more niches, creating more opportunities for different species, compared to most managed agroecosystems which are simplified and have fewer predatory and parasitic species and lower genetic diversity within a species (Odum 1997). Still, the natural capital contained in agricultural landscapes not only supports the production of food, fiber and biofuels, but also provides a variety of public benefits to society such as carbon sequestration, aesthetic landscapes and biodiversity conservation (Swinton et al. 2007). Agricultural ecosystems are primarily managed to optimize the provisioning services of food, fiber and fuel (Zhang et al. 2007). This management should take in consideration that agrosystems both relies (input) and provides (output) ecosystem services (figure 1.1.2) (Zhang et al. 2007). On the input side, many ecosystem services, like crop pollination, provide direct benefits to agricultural production (Zhang et al. 2007). On the output side, agriculture supplies a range of “provisioning” ecosystem services that are traded in commodity markets. Agrosystems may further sustain supporting services and regulating services (MEA 2005b). In the process, besides sustaining some supporting and regulating services, agriculture also depends upon a wide variety of them such as soil fertility and pollination (Zhang et al. 2007), that determine the underlying biophysical capacity of agricultural ecosystems (Wood et al. 2000) (Table 1.2.1).
Figure 1.2.2 - Agriculture related ecosystem services dynamics. Agriculture can suffer a feedback impact along a chain of effects, in which many ecosystem services important to sustain agriculture might be degraded by agriculture itself.
5
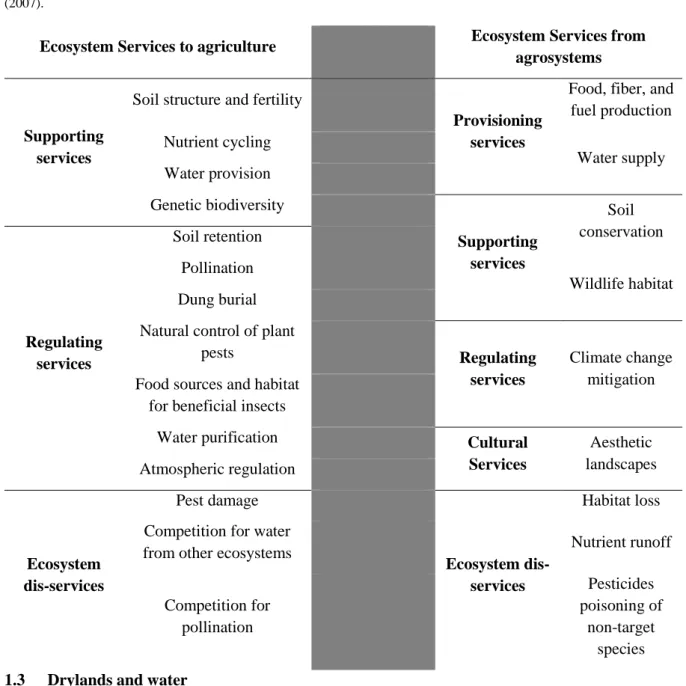
Table 1.2.1 – Ecosystem services to and from agriculture divided according to MEA categories. Adapted from Zhang et al (2007).
Ecosystem Services to agriculture Ecosystem Services from agrosystems
Supporting services
Soil structure and fertility
Provisioning services
Food, fiber, and fuel production Nutrient cycling Water supply Water provision Genetic biodiversity Supporting services Soil conservation Regulating services Soil retention Pollination Wildlife habitat Dung burial
Natural control of plant
pests Regulating
services
Climate change mitigation Food sources and habitat
for beneficial insects
Water purification Cultural
Services Aesthetic landscapes Atmospheric regulation Ecosystem dis-services Pest damage Ecosystem dis-services Habitat loss Competition for water
from other ecosystems Nutrient runoff
Competition for pollination Pesticides poisoning of non-target species 1.3 Drylands and water
Drylands are areas where plant production is limited by water availability; the dominant agriculture uses are livestock grazing and cultivation (MEA 2005a). They are many times thought to be unproductive and barren, yet they are where nearly 40% of the world’s population lives (White & Nackoney 2003). Freshwater resources in drylands are limited and variable in supply. This lack of water and its variability render the ecosystem goods and services in drylands provided by surface water, groundwater, and wetland habitats critically important (White & Nackoney 2003). The construction of dams for irrigation is one of the practices many times used to solve this limitation, therefore a large number of dams is found in dryland areas (MEA 2005b).
The benefits that result from the construction of dams are diverse, such as the provision of water and electricity in the long term, as well as opportunities for new economic activities and job creation. Other benefits that often occur are improved conditions for inland navigation, tourism development or aquaculture (Dias-Sardinha & Ross 2015). On the other hand, the installation of dams entails a number of negative consequences such as, the physical transformation of rivers and their natural flow, the profound shock imposed on the river basin ecosystems and human communities that live on its banks
6
and the loss of cultural heritage such as archaeological remains, having even the potential to alter local climate (Dias-sardinha & Ross 2015). Whether with the purpose of producing hydroelectric power or agricultural irrigation, dams irreversibly alter the landscape and create a new feature that enables the realization of, for example, nautical activities where previously it was not possible (Dias-sardinha & Ross 2015). It also leads to land use changes from extensive to more intensive types of agriculture. Irrigation schemes may imply several environmental problems from flooding of valleys and drainage of aquifers for water collection to a rise in the use of chemical compounds, and even loss of fallows in crop rotation (Perez 1990).
1.4 From extensive agroecosystems to irrigated agroecosystem
Agroecosystems are artificial systems altered to serve human purposes (FAOSTAT 2016). In the Mediterranean dryland area, the rain fed agriculture is the main form of crop production. This kind of system is highly diverse with a wide range of rain fed crops, including tree crops (like olives, fruits and nuts) and field crops (mainly wheat and barley) (Ryan et al. 2006). However, extensive natural areas are being converted for human use, and management practices are intensifying in already human-dominated lands. As a result, the irrigated surface has doubled during the last 50 years. Modern agricultural techniques result in increased productivity, but often at the high environmental cost leading to negative environmental alterations (Foley et al. 2005).
Biodiversity is highly related with some of the ecosystem services that are of great importance to agriculture. Therefore, biodiversity conservation is a major tool to promote these ecosystem services. Biodiversity is linked with ecosystem services on several levels: microorganisms are responsible for decomposition (recycling of wastes and detoxification service) and nutrient cycling; primary producers (plants) are responsible for biomass production (provisioning services) and carbon capture (carbon sequestration and storage service), top predators and parasites play an important role on population regulation (natural control of pests) and pollinators secure many food crops (crop pollination) (Mace et al. 2012).
Aiming at quantifying the trade-offs that occurred in the transition from an extensive to intensive agroecosystem, four ecosystem services were selected to be mapped and quantified: habitat quality, crop pollination, carbon storage and nutrient cycling. These four ecosystem services are highly related with agriculture and are important to support and sustain it.
1.4.1 Habitat Quality
Agriculture related ecosystem services are supplied by varied species and functional groups (groups of species with similar ecophysiological and life-history traits (Moonen & Bàrberi 2008)) over a range of scales and influenced by human activities both intentionally and unintentionally (Zhang et al. 2007). It is known that species diversity is affected by environmental drivers such as climate change, invasive species, land use change or pollution. These drivers lead to led options for management and increase the vulnerability of ecosystem services once these drivers have a direct impact on ecosystem services, and affect biodiversity. The loss biodiversity may decrease profitability of ecosystem services, mainly the ones provided by a specific group of species (Carpenter et al. 2009). Currently there are many evidences that biodiversity loss reduces the efficiency by which ecological communities capture biological essential resources, produce biomass, decompose and recycle biologically essential nutrients, therefore evaluating this losses is highly necessary (Cardinale et al. 2012). Because sampling and evaluating all the biodiversity for a given area is impracticable, biological indicators can be used to do this evaluation. Some groups of species are more suitable than others to evaluate changes on their environment. Birds have some characteristics that make them good indicators of biodiversity and sustainability: 1) They are high in the food chain, thus integrating changes at other levels; 2) They occupy a broad range of
7
ecosystems and have varied natural histories; 3) a wealth of data has been (or can be) collected by volunteers and professionals, and bird population sizes and trends, and conservation status, are often well known relative to other taxa; and 4) they are meaningful to a wide audience including the public (Heath & Rayment 2003).
1.4.2 Crop Pollination
The expansion of agriculture is leading to negative effects on yields of pollinator-dependent crops by isolating crop fields from the pollinators diversity that natural habitats harbors (Carvalheiro et al. 2011). In Europe, the majority of crops depend or benefit from insect pollination, being that an estimated 10% of the total economic value of European agricultural output for human food amounted to 22€ billion in 2005 was dependent upon insect pollination (Potts et al. 2015). However, pollinator species are disappearing and pollinator populations are declining (Potts et al. 2015).
Pollinators extinction drivers vary in space and time, interact synergistically, and affect species and/or functional groups differently (Nieto et al. 2014). The main threats identified were habitat loss as a result of agriculture intensification (e.g., changes in agricultural practices including the use of pesticides and fertilizers), urban development, increased frequency of fires and climate change (Nieto et al. 2014). Some life history traits were associated to the most threatened species: sociality (e.g., bumblebees), host-plant specialization (e.g. bee species associated to coastal areas). The species richness of bees increases from north to south in Europe, with the highest species richness being found in the Mediterranean climate zone. The Iberian, Italian and Balkan peninsulas are important areas of species richness. The largest numbers of threatened species are located in South-Central Europe and the pattern of distribution of Data Deficient species (for which there is insufficient information for conservation status) is primarily concentrated in the Mediterranean region (Nieto et al. 2014).
Declines in species richness of bumblebees have received particular attention, especially in Europe and North America. Many pollinator-dependent crops rely on bees for yield, and the threats that bees are facing have raised concerns that crop pollination might also be at risk (Bommarco et al. 2012). Legumes in general, and especially red clover, which are important nectar and pollen resources for bumblebees, have become much rarer in the landscape. This reduced availability and increased fragmentation of resources, is a probable reason why only generalist and highly mobile bumblebee species have been able to maintain large populations in intensively managed agricultural landscapes (Bommarco et al. 2012). It is important to consider that pollinators are known to be affected by distance to natural habitat, where they find refuge and nesting sites, and by floral diversity, where pollinators find their food resources (Carvalheiro et al. 2011). This distances can be used to produce pollination capacity maps in order to evaluate where pollinator promotor measures are prioritary.
The most widely managed pollinator in Europe is the honeybee (Apis mellifera), with most wild and feral colonies already lost (Potts et al. 2015). However, non-honeybee pollinators made an important indirect contribution to pollination by altering honeybee foraging patterns (Carvalheiro et al. 2011). Wild pollinators in Europe are dominated by approximately 2000 species of wild bees, like bumblebees and solitary bees, and hoverflies, with a smaller contribution of butterflies, beetles and other fly species (Potts et al. 2015).
1.4.3 Nutrient Cycling
Soils, the basic substrate for many ecosystems and human activities, have been considered a black-box within the ecosystem services framework because of their focus on what happens above ground (Dominati et al. 2010). Soils are an important determinant of the economic status of the nations, it is essential to include them in ecosystem service frameworks that inform decision-making and environmental policies (Dominati et al. 2010).
8
Soil properties can be divided in two major groups: inherent soil properties (these include properties like slope, depth, cation exchange capacity and clay types) and manageable soil properties (like soluble phosphate, mineral nitrogen, organic matter contents and macroporosity) (Dominati et al. 2010). The manageable properties assume more practical importance as they provide the opportunity for agronomists, farmers and other stake-holders to optimize the provision of ecosystem services from soils (Dominati et al. 2010). Variations in the soil natural capital can lead to very marked differences in land use and farming systems and associated environmental footprint (Dominati et al. 2010).
Anthropogenic drivers, such as land use, farming practices and technologies, also influence soil processes. The type of land use determines the type of disturbance as well as inputs applied to the soil. Farming practices determine the level of intensity of the disturbances and the amount of inputs to the soil (Dominati et al. 2010).
Soils provide many ecosystem services, and they fall into the provisioning, regulating and cultural ecosystem services categories. In this work we will focus primarily on the regulating services that can be obtained from the soil, mainly the recycling of wastes and detoxification and carbon storage (Dominati et al. 2010).
Soils can self-detoxify and recycle wastes. Soil biota degrades and decomposes dead organic matter into simpler forms, that organisms can reuse. Soils can also absorb (physically) or destroy chemical compounds that can be harmful to humans, or organisms useful to humans (Dominati et al. 2010). Decomposition can be altered due to plant growth being harvested and soil fertility maintained not through nutrient recycling, but fertilizers, since fertilizers can negatively impact soil organisms that are responsible for several processes, including decomposition (Altieri 1999). Therefore, land use-intensity can change soil decomposition capacity.
1.4.4 Carbon Storage
Perhaps one of the soil most important ecosystem service is the ability of soils to store carbon as stable organic matter which is a non-negligible benefit when talking about off-setting greenhouse gases emissions (Dominati et al. 2010). Changes in the vegetation can lead to the release of carbon from drier regions and they deserve consideration when discussing carbon balance at the global scale (Bonino 2006).
Carbon storage on terrestrial systems largely depends on the sizes of four carbon “pools”: aboveground biomass, belowground biomass, soil and dead organic matter. Aboveground biomass comprises all living plant material above the soil, belowground biomass encompasses the living root systems of aboveground biomass. Soil organic matter is the organic component of soil, and represents the largest terrestrial carbon pool. Dead organic matter includes litter as well as lying and standing dead wood (Tallis et al. 2011). Agriculture is defined as an anthropogenic manipulation of Carbon through uptake, fixation, emission and transfer of Carbon among these different pools (Lal 2004).
Land cover change involving changes in vegetation lead to modifications of the physiochemical characteristics of the soils, which can also include changes in the soil organic reserves (Bonino 2006). Therefore, should be considered that increasing soil organic matter improves soil nutrient availability and water holding capacity, thus increasing plant productivity and reducing surface runoff of water, which in turn decreases sediment loss and soil erosion (Teixeira et al. 2011). Decreasing water runoff and soil erosion have positive effects even outside the plot. Sediments, nutrients, organic matter and pesticides in water contribute to silting, eutrophication and contamination of surface waters (Teixeira et al. 2011).
9
in the carbon storage capacity since it leads to alterations in plant structure, both above and below ground and also to changes in soil structure (Tallis et al. 2011).
1.5 Mapping ecosystem services in a spatial explicit way
The Integrated valuation of Environmental services and Trade-offs (InVest) tool, developed by the Natural Capital Project, can be used to map and value the goods and services from nature (Tallis et al. 2011). This is a spatially explicit modeling tool, based on ecological production function and economic valuation methods (Nelson et al. 2009). InVest consists of a suite of models that use Land Use/Land Cover (LULC) patterns to estimate levels and economic values of ecosystem services, biodiversity conservation, and the market value of commodities provided by the landscape (Nelson et
al. 2009). It can be run at different levels of complexity, making it sensitive to the data availability and
an understanding of system dynamics (Nelson et al. 2009). 1.6 The study area: the Montado system in the Alentejo
The Alentejo region represents about a third of the Portuguese continental land (Fragoso & Marques 2007). Despite this great extension, the region accounts for only 7% of the total population of the country, and it has the highest ageing rates in Portugal (Dias-sardinha & Ross 2015). Alentejo is a Mediterranean-climate semi-arid region, with long dry summers where the temperatures reach 30-40 ºC. Precipitation during the wet season is irregularly distributed and shows great annual fluctuations, with frequent torrential rains in winter, varying from 500-650 mm, concentrated in the period October-March (Correia 1993)
The Montado is the main agro-silvo-pastoral system in the Alentejo region characterized by a savannah-like physiognomy, and is therefore sometimes designated as an open oak savannah (Pinto-Correia & Mascarenhas 1999; Correia 1993). The trees are cork and holm oaks (Quercus suber and Quercus rotundifolia), which can be found in monospecies or mixed stands. Generally, the tree cover does not follow a regular pattern, and the densities vary from 20 to 80 trees per hectare (Pinto-Correia & Mascarenhas 1999). This extensive oak forests are interspersed with scattered patches of productive or abandoned orchards, riparian vegetation and scrubland. This system is particularly important in terms of vertebrate conservation, due to the diverse wildlife that it supports (Rosalino et al. 2009). In the traditional Montado, the ground cover is a rotation of culture/fallow/pasture, with rotation periods depending mainly on the soil quality and on the main goal of the Montado exploitation (Pinto-Correia & Mascarenhas 1999).
Traditionally in the Alentejo region the low rainfall and open plains condition the agricultural practice usually governed around large estates, which in turn motivates high population dispersion (Dias-Sardinha & Ross 2015). Production activities in this area were characterize by extensive livestock grazing of cattle, sheep, goats, cattle and the Iberian pig. These were combined with cereal crops cultivated in long rotations with fallow (Pinto-Correia & Godinho 2013). There are two distinct trends in the current Montado system: extensification and intensification. Both trends can co-occur in a single holding, in parcels of land having different characteristics. Under extensification, crop cultivation has been abandoned and stocking rate is reduced, larger areas are used as pastures. On the other hand, in areas where intensification occurs, there may be an intensification in cultivation or in livestock production. If crop cultivation is the main objective, the tree density is often reduced and the cultivation depends on mechanization and deep ploughing (Pinto-Correia & Mascarenhas 1999).
The Alqueva Multi-purpose Dam (EFMA) project emerged in 1957 with the drafting of the Alentejo Irrigation Plan, which aimed at improving the farming conditions (Dias-Sardinha & Ross 2015). The EFMA project aimed to provide water for irrigation, urban and industrial uses, electricity production and the regulation of the Guadiana river flow (Ministério do Ambiente e do Ordenamento do Território
10
2001). Irrigation agriculture allows for increased productivity (EDIA 2005), and it is seen as one of the main drivers for the development of rural regions, allowing for better socio-economic conditions (EDIA 2005). It has a major role in the reduction of the vulnerability of the production systems because it promotes water storage, allowing a regulation of the water availability to the crops. This has particular importance in a place that is marked by climatic changes and extreme droughts phenomena.
Agricultural expansion and intensification are major drivers of biodiversity loss, biotic homogenization and changes in community composition and functional diversity (Mclaughlin & Mineau 1995a). Although current efforts to protect the agricultural resource base may have a positive influence on environmental quality and, by extension, on the wild biota in agricultural landscapes, this is no guarantee that biodiversity is being preserved (Mclaughlin & Mineau 1995a).
The Mediterranean drylands have been identified as one of the most prominent regions affected by climate change, being that an increase in drought events has been registered in this region over the past 40 years, and these events are expected to become more frequent in the future (Schroter et al. 2005). Water availability is directly connected with the provision of many ecosystem services, reinforcing that the implementation of dams can have great benefits in drylands (Groot et al. 2010). Changes in temperature, the most predictable of the climate change impacts, will increase water losses from lakes and reservoirs and raise evapotranspirative demand for water, while increasing atmospheric moisture content. Rising temperatures will therefore increase crop water demand, deplete soil moisture faster and increase irrigation demand (Turral et al. 2010). Therefore, irrigation impacts on the landscape will be extent to the new irrigated areas.
1.7 Goals
The aim of this work was to evaluate in a spatial explicit way the ecosystem services trade-offs due to land use changes from an extensive agro-forestry system to irrigated agriculture. This allowed to provide insights on how to optimize ecosystems service provision while maintaining biodiversity. This was done using as a case study located in Alentejo, South Portugal, in a plot that has been irrigated since the construction of the Alqueva dam. To do this several tasks were carried out: 1) Creation of land-cover map before and after the transition to agriculture; 2) Collect data related to the ecosystem services associated to each land-cover type identified. The ecosystem services that were accessed were habitat quality, crop pollinators, carbon storage and nutrient cycling (decomposition); 3) Whenever necessary (i.e. when no reliable bibliographic data is available) further data was collected in the field regarding the quantification of ecosystem services for each land-cover type; 4) Use of InVest model to determine the base-level (historical) and current ecosystem services, and determine what occurred in the transition; 5) Evaluate the trade-offs between the ecosystem services studied for the several LULC in the landscape; 6) Finally, we aim to suggest management practices according to our results in order to promote ecosystem services, agriculture and conservation of biodiversity.
11 2 Methods
2.1 Study area
This project was conducted in the Monte Novo irrigation plot (Alentejo, Portugal). Climate is typically Mediterranean with an annual rainfall of 400-600 mm, mostly falling in the wet season. Average temperature varies from 9.6 (January) to 24.1ºC (August), with an annual medium of 16,5ºC, temperature records ranging from -2.9 to 46ºC. (averages from 1981-2010, IPMA 2016a). Regarding the sampling year (2016), the temperature, was close to the average values, with an average minimum temperature of 10.0 ºC and an average maximum temperature of 22.1 ºC. When it comes to the precipitation, the month of May had an average 95.5 mm of precipitation. All the values where collected in the Évora meteorological station (IPMA 2016b).
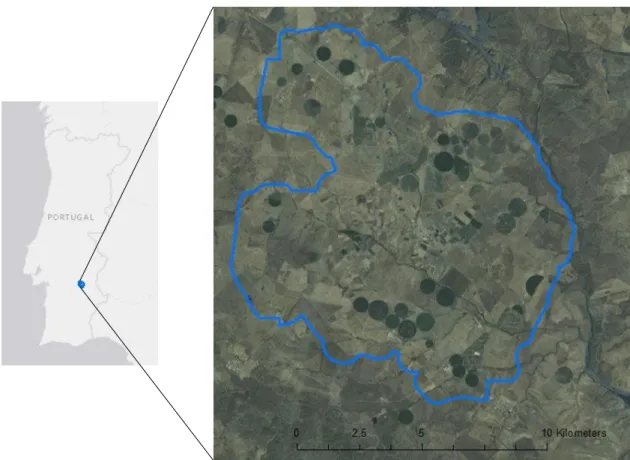
The area is being irrigated by water from the Alqueva dam since 2009 (EDIA 2011). The Alqueva dam is located in the Guadiana River and it’s the largest water reservoir in Portugal and Western Europe, with 250 Km2 (Bettencourt & Grade 2009) (Figure 2.1.1). The Monte Novo irrigation site has a total surface of 25 000 ha, of which 7 100 ha are occupied by irrigated agriculture (Santos et al. 2011).
Figure 2.1.1 - Study area limits. The study area, the Monte Novo irrigation site, is situated around the village of São Manços, near the city of Évora.
2.2 Land-use Land-cover mapping
Current and historical Land-Use Land-Cover (LULC) maps were created in a geographic information system. Two base-maps with local cartography were provided by the local administration (EDIA). A pre-treatment of those maps was necessary because LULC classes did not correspond between dates (1990 and 2015). This was done by reclassifying some LULC types adopting the more recent terminology. To reduce complexity when comparing LULC over time (i.e. in order not to create multiple very small polygons), and after verifying in aerial photography, we considered that some LULC types
12
did not change between dates: riparian galleries and artificial areas (including main roads and urban area).
In order to select the LULC to be sampled in the field, we calculated the total area occupied by each LULC and a selection was made based on the total area occupied (See Results Figure 3.2.2) and on the importance of the cultures for the region. The LULC selected were Montado, Montado with crops, Extensive crops, Irrigated crops, Extensive olive, Irrigated olive, Pine and Eucalyptus plantations, Extensive vine. Irrigated vine, Riparian galleries, Corn, Irrigated forage, Vegetable crops, Irrigated cereal.
2.3 Modeling ecosystem services
InVest (Tallis et al. 2011) was used for modeling ecosystem services in the historical and current situation. InVest is composed of several modules, each one running a separate model. The data-base for each InVest module was created using both bibliographic research and field work. The field data was collect only for the LULC selected before. To ensure that the bibliographic data collected was a good representation of our study area, some criteria were implemented for the bibliographic research: the study area should be similar to ours regarding LULC type (irrigated area), climate (dryland) and should be as recent as possible (bibliography sources from 1995 to 2016).
For field work some criteria were also implemented to ensure a good representation: the area to sample (polygon) should be the largest of each culture type and for the nutrient cycling service all should have the same type of soil. To ensure these we used the land cover maps provided by EDIA and the Soil categories from SNIAmb. Also, for all InVest models raster’s with 30m resolution cells were used as input LULC maps. Because each InVest model has its own requirements, they are presented separately below.
2.3.1 Habitat quality
To evaluate the habitat quality ecosystem service, bird diversity was used as a biological indicator. To model habitat quality using InVest two important metrics are important: the abundance of birds per LULC type and the effect of threats on bird’s population (including the strength and distance of impact). For field work the LULC selected were Riparian galleries, Montado, Extensive agriculture, Irrigated Olive, Irrigated Vine and Corn. On one plot per LULC, birds were counted within four hours after sunrise using a single 10 min point count per patch. Both auditive and visual contacts were recorded (Bibby et al. 2000; (Sutherland et al. 2004). This allowed us to characterize species from each LULC type and their abundance. Note that for the non-sampled LULC types data from the bibliography were used.
After bibliographic analysis and taking into consideration the local LULC and species found during field-work (see Results), three threats were selected to run the model: paved roads, pesticides and presence of urban areas. Threats were considered to impact the overall bird community, and were not species specific.
Paved roads are known to affect negatively the presence of biodiversity near them. In the case of birds some reasons have been proposed for this. One of them is the traffic noise, since it can interfere with the acoustic communication on which birds depend for establishment and maintenance of territories and for intra-pair and adult-young communication (Summers et al. 2011). Other causes of disturbance by roads may be related to vehicle lights and motion or could be direct mortality because of collisions with traffic (Summers et al. 2011).
Pesticides may lead to a decline on birds in a given area acting in three different ways. First, insecticides may deplete or eliminate arthropod food supplies, which are exploited by adults and their dependent
13
young during the breeding season and, in doing so, reduce breeding productivity. Secondly, herbicides may reduce the abundance of non-crop plants that are the hosts for arthropods taken as food by farmland birds during the breeding season, thereby also reducing breeding productivity. Finally, herbicides may also deplete or eliminate weed species, which provide either green matter or seeds for herbivorous and granivores species, respectively, thereby reducing survival of those birds that rely on those food supplies (Boatman et al. 2004). Therefore, pesticides have a negative impact both in herbivorous and in insectivorous birds.
The presence of urban areas affects the biomass and the richness of the avian community in a given area (Chace & Walsh 2004). Taxonomically bird communities in distinctly different habitats are most different in the least disturbed sites (more richness) and the most similar in the most urbanized sites (less richness) (Chace & Walsh 2004). Urbanization selects for omnivorous, granivores, cavity and branch nesting, feed on the ground and medium size species (Chace & Walsh 2004; Pinho et al. 2016). All the threats selected for the model were based on bibliographic research, being that the impact distance for each threat was also based on bibliographic research (table 2.3.1.1).
Table 2.3.1.1 - Summary of the impacts distances used for each threat in the habitat quality InVest model.
Threat Impact distance (Km)
Paved roads 0.95
Pesticides 0.10
Urban areas 0.50
To run the model, the LULC needed to be classified from 0 to 1 according to habitat suitability for the group of organisms that are being used in the model (table 2.3.1.2). Accordingly, to results Montado and the Riparian galleries presented the highest number of species and abundance (see Results) and were thus classified with the maximum value.
Table 2.3.1.2 - Habitat classification for each LULC in the InVest Habitat Quality model. For each LULC a value from 0 to 1 was attributed according to their capacity to be a habitat for the bio indicator group in use, birds.
LULC Habitat
Montado 1
Montado with crops 0.9 Extensive crops 0.7 Irrigated crops 0.35 Extensive olive 0.6 Pine and Eucalyptus
plantations 0.6 Extensive Vine 0.6 Riparian galleries 1 Irrigated Olive 0.5 Corn 0.35 Irrigated forage 0.35 Vegetable crops 0.35 Irrigated Vine 0.5 Irrigated cereal 0.4 Urban areas 0.2
14 2.3.2 Crop pollination
To calculate pollination service, the Apidae family was used. This is the main taxa responsible for the pollination service (Carvalheiro et al. 2011) and the InVest model was design for it. To fine tune the model to our study area, we needed to know which genera were dominant. For field work the LULC selected and sampling sites were the same as for the Habitat Quality. The numbering of sampling sites per LULC varied from 1 to 3. In each sampling site, we used pan traps method. For this, colored dishes (white, yellow and blue) and a trap liquid were placed during early morning and collected at sunset. In laboratory, all insects captured were sorted for the target family. These individuals were then identified to the genera.
Afterwards, bibliographic research was done to associate nest requirements of each genus to the characteristics of each LULC type. Bibliographic research also allowed us to determine the flowering season typical of the plants normally found on each LULC type, and the flight season and maximum flight distance for each genus identified (Appendix A).
Note that the field work performed for this model was only used to identify some of the bee genera present in the study area. No data regarding in which LULC the genera were found or their abundance was used to run the model. The abundance index resulting from the InVest model was calculated based on the nest availability on the study area, flight season and flowering seasons.
2.3.3 Carbon storage
Bibliographic data was collect for all the four carbon pools defined in the model, and for each of the LULC. A special care was taken to use data from studies made in sites with similar ecosystems as the one we worked in regarding land-use, climate and soil types. Whenever multiple data was available for the same LULC/pool, the mean value was used as InVest input (See Results table 1.2.4). Regarding the soil carbon pool the depth from where the soil was collected in most papers was from a depth up to 30 cm, being that only one paper referred a depth of 60 cm.
2.3.4 Nutrients cycling
For the nutrient cycling service, the LULC selected were Riparian galleries, Montado, Irrigated Forage, Extensive crops (sp: Tricale) and Vegetable crops.
The international available method for evaluating the potentiation for soil decomposition was used as a proxy of nutrients cycling, the Tea Bag Index (Keuskamp et al. 2013). The Tea Bag Index is determined through a litter bag experiment, followed by the measurement of mass loss after incubation (decomposed material). To do this soil was collected from 1 site per type of LULC. Within each site a composite sample was made collecting the first 30 cm of soil from 5 nearby locations. The collected soil was divided, being that 12 samples per LULC were prepared, each one with 1 tea bag in it. The bags were dried in an incubator at 70ºC degrees and weighted before being incubated in the soil placed in pots, at an 8 cm depth. Tea bags were then removed sequentially from each treatment after the beginning of the incubation: two weeks, four weeks, eight weeks and twelve weeks. Pots were watered in a regular basis, ensuring that the total precipitation given during the incubation period was the same as for their original location. For that the monthly normal averages were retrieved (IPMA 2016a) and used to calculate the watering.
After collected, the tea bags were dried and then open and the remaining tea was collected from inside the bags and stored in paper labeled containers. Separating the tea from the bags was done to ensure that debris (such as small roots that grow outside the tea bags) were removed prior to weighting. The bags and tea were then weighed. Then the percentage of tea that was not decomposed was calculated (Equation 2.3.4.1)
15
% 𝑜𝑓 𝑛𝑜𝑡 𝑑𝑒𝑐𝑜𝑚𝑝𝑜𝑠𝑒𝑑 𝑡𝑒𝑎 = (𝐼𝑛𝑖𝑡𝑖𝑎𝑙 𝑡𝑒𝑎 𝑏𝑎𝑔 𝑤𝑒𝑖𝑔ℎ𝑡 − 𝑏𝑎𝑔 𝑤𝑒𝑖𝑔ℎ𝑡) − (𝑓𝑖𝑛𝑎𝑙 𝑡𝑒𝑎 𝑏𝑎𝑔 𝑤ℎ𝑒𝑖𝑔ℎ𝑡 − 𝑏𝑎𝑔 𝑤𝑒𝑖𝑔ℎ𝑡) 𝐼𝑛𝑖𝑡𝑖𝑎𝑙 𝑡𝑒𝑎 𝑏𝑎𝑔 𝑤𝑒𝑖𝑔ℎ𝑡 − 𝑏𝑎𝑔 𝑤𝑒𝑖𝑔ℎ𝑡 𝑥 100 Equation 2.3.4.1 – Expression to determine the percentage of not decomposed tea
2.4 Data analysis
For the habitat quality and crop pollination services the Shannon Wiener index and the evenness index were calculated in order to evaluate diversity. After running each one of the ecosystem services modules within InVest, the habitat scores obtain for some of the LULC were compared using the Mann-Whitney U test.
Regarding the nutrient cycling service, to evaluate if there were any differences in the decomposition rate for the different LULC a Kruskall-Wallis H test was performed for each of the measure periods (2, 4, 8 and 12 weeks). In case the test showed differences, a Mann-Whitney U test was performed comparing the LULC pairwise. All the statistical analysis were performed using the Microsoft Excel and IBM SPSS software and a confidence interval of 95% (α=0.05) was used for all statistical analysis. For all the InVest model results, raster calculation was used to compare the historical result to the current one, resulting on the differences between both for each ecosystem service.
After all results were gathered, the values for each ecosystem service were scaled (0-1) in order to evaluate their relative importance for each LULC. These relativize values were then represented in a radar plot, grouping all ecosystem services. To obtain an overall index of the ecosystem services provided the relative values of the ecosystem services were then summed (assuming that they all value the same) and then the LULC were ranked according to this and mapped.
16 3 Results
3.1 Mapping of the Land-use Land-cover types (LULC)
The first task of this project was the production of two maps, one corresponding to the LULC that was present before the area was irrigated (Figure A) and another with the current LULC (Figure 3.1.1-B).
Figure 3.1.1 – Distribution of the LULC on the Monte Novo irrigation site. A - before the site was irrigated – historical LULC map; B- after the site was irrigated (2015) – current LULC map. The areas presented in grey are the ones that were aggregated in an “other occupations” category due to the small area of occupation.
To compare both maps it is important to understand the alterations in the size of each LULC and which are the most representative for each time (figure 3.1.2). It could be verified that in the historical map the LULC that occupied most of the area were the extensive crops, and in the current map a decrease of the extensive crop area was observed, with an increase of most of the irrigated LULC. Some of the LULC
A