ISSN 0103-8478
Correlation and path analysis of yield and its components and plant traits in wheat
1Lauro Akio Okuyama2 Luiz Carlos Federizzi3 José Fernandes Barbosa Neto3
Correlação e análise de trilha de rendimento e seus componentes e caracteres de planta em trigo
1Extraído de parte da tese de doutorado do primeiro autor.
2Engenheiro Agrônomo, Doutor, Instituto Agronômico do Paraná (IAPAR), CP 481, 86001-970, Londrina, Paraná. E-mail:
[email protected]. Autor para correspondência.
3Engenheiro Agrônomo, PhD, Professor da Faculdade de Agronomia da Universidade Federal do Rio Grande do Sul, CP 776, 91501-970,
Porto Alegre, Rio Grande do Sul.
ABSTRACT
This study was aimed to characterize yield components and plant traits related to grain yield. Correlation and path analysis were carried out in wheat genotypes grown under irrigated and non-irrigated field conditions. In the path coefficient analysis, grain yield represented the dependent variable and the number of spikes m-2, number of grains spike-1, kernel weight, days
to anthesis, above-ground biomass m-2 and plant height were the
independent ones. In both years, periods without rain occurred from early milk to grain ripening and from flag leaf sheath opening to grain ripening for first and second sowing dates, respectively. Character associations were similar in both water regimes. Grain yield showed positive phenotypic correlation with above-ground biomass, number of spikes m-2 and number of grains per spike.
Path analysis revealed positive direct effect and moderate correlation of number of spike m-2 and number of grains per spike
with grain yield. These results indicated that the number of spikes m-2 and the number of grains per spike followed by the
above-ground biomass were the traits related to higher grain yield, under irrigated and late season water stress conditions
Key words: Triticum aestivum, water stress, higher grain yield.
RESUMO
Este trabalho teve como objetivo avaliar os componentes de rendimento e os caracteres da planta relacionados ao rendimento de grãos. Análises de correlação e de trilha foram realizadas em genótipos de trigo cultivados no campo, sob condições irrigada e não-irrigada. Na análise de trilha, o rendimento de grãos m-2 foi considerado como variável resposta
e o número de espigas m-2, número de grãos espiga-1, peso de grão,
dias para antese, matéria seca da parte aérea e estatura de planta como variáveis explicativas. Períodos sem precipitação pluvial ocorreram em ambos os anos, do estádio de grão leitoso a maturação de grãos e do estádio da bainha da folha bandeira abrindo a maturação de grãos, para a primeira e segunda época de semeadura, respectivamente. As associações dos caracteres foram similares em ambos os regimes hídricos. O rendimento de grãos apresentou correlação fenotípica positiva com a matéria seca da parte aérea, o número de espigas m-2 e o número de
grãos espiga-1. A análise de trilha indicou efeito direto positivo
e correlação moderada do número de espigas m-2 e do número
de grãos espiga-1 com o rendimento de grãos. Esses resultados
evidenciaram que o numero de espigas m-2 e o número de grãos
espiga-1, seguido de matéria seca da parte aérea foram os
caracteres relacionados com o maior rendimento de grãos, sob condições irrigada e de estresse hídrico no final do ciclo.
Palavras-chave: Triticum aestivum, estresse hídrico, maior rendimento de grãos.
INTRODUCTION
Water is the main abiotic limiting factor in many wheat production areas around the world. Due to erratic spatial and temporal distribution of rainfall, it is important to have cultivars with superior yield performance under limiting and non-limiting soil moisture conditions. Grain yield is the result of many developmental and physiological events occurring throughout the growing cycle. It is determined by three major components, namely, number of spikes per unit area, number of grains per spike and kernel weight. The importance of each one of these yield components to grain yield depends on the growth stage when water stress occurs (HOCHMAN, 1982; MCMASTER et al., 1984) and management (BLUE et al., 1990).
timings of water stress (SIMANE et al., 1993). Under conditions resulting in low tillering (late planting, low seeding rate, low P rate) kernel weight is extremely important to yield determination, while under high tillering conditions the number of spikes m-2 is the most important yield component (BLUE et
al., 1990).
Wheat plant is more sensitive to water stress between booting and grain filling than any other period (FISCHER et al., 1977; HOCHMAN, 1982). On the other hand, it is more important to prevent water stress during tillering and jointing than during heading and grain filling period (THOMPSON & CHASE, 1992). Yield components and plant trait contribution on grain yield may be important for breeding strategies. Simple correlation analysis that relates grain yield to a single variable may not provide a complete understanding of the importance of each component in determining grain yield (DEWEY & LU, 1959; SINGH et al., 1979). Path coefficient analysis allows an effective means of partitioning correlation coefficients into unidirectional pathway and alternate pathways. This analysis permits a critical examination of specific factors that produce a given correlation and can be successfully employed in formulating an effective selection strategy. Through correlation and path coefficient analysis, KUMAR & HUNSHAL (1998) observed in durum wheat that harvest index, total dry matter, effective tillers, number of grains per spike and grain weight per spike were the most important components of grain yield. With terminal moisture stress, longer grain-filling period, number of spikes m-2 and number of kernels
per spike were traits associated with drought tolerance in durum wheat (SIMANE et al., 1998).
The objectives of this study were: (i) to evaluate associations between yield components and plant traits with grain yield, (ii) to determine direct and indirect effects of yield components and plant traits on grain yield in wheat genotypes grown under irrigated and non-irrigated conditions.
MATERIAL AND METHODS
Field experiments were conducted at the Esperimental Station of IAPAR (Instituto Agronômico do Paraná), in Londrina (latitude 23o23’S, longitude 50o01’W, altitude 556 m). The soil
is a Typic Haplorthox, characterized by a deep profile, fine texture, and very deep water table. Fertility is constrained by low organic matter and phosphorus contents. The region has a subtropical humid climate characterized by long hot summers and mild sunny
winters. Experiments were sown in two planting dates, in 1994 and 1995. The field design for each sowing date was a split-plot arrangement of treatments within a randomized complete block with six replications. Water regimes, irrigated and non-irrigated (rainfed), were allocated to the main plots and cultivars to the subplots. Each subplot consisted of six rows with five meters in length, spaced 17cm apart and seeded at a rate of 350 seed m-2.
The experiments included 10 spring wheat (Triticum aestivum L.) cultivars, one durum wheat (Triticum durum L.) and one triticale (X Tritosecale Wittimack). These materials represent a range of phenotypic variation in maturity, date to heading, height, adaptation zone, yield potential and date of release. Tillage of all plots was performed prior to each sowing date. Each year, before sowing, eight kg ha-1of N, 26kg ha-1 of P and 20kg ha-1 of K were
broadcast on the surface and tilled into the soil. Around 25 days after plant emergence, 10kg ha-1 of
N was applied through foliar spraying. Irrigation needs were controlled with tensiometers installed 30cm depth, between the rows, and the plots were irrigated when the water tension was greater than 50kPa. The major wheat diseases were spot blotch (Bipolaris sorokiniana), leaf rust (Puccinia recondita tritici) and powdery mildew (Erysiphe graminis) and were controlled by foliar spray with the fungicide tebuconazole. The number of days to anthesis, days to physiological maturity, plant height and lodging were recorded in each subplot. The values of above-ground biomass, kernel weight, number of spikes, number of grains per spike and grain yield was determined from 1 linear m sample obtained in each subplot. The number of days from emergence to anthesis was recorded when half of the heads in the plot shed pollen. The number of days to physiological maturity was estimated when 75% of the glumes of the primary spike turned yellow in 50% of the plants. Plant height was measured as the average distance from the soil surface to the tips of spikes, awns excluded. Lodging values were based on visual estimates of the percentage lodged straw in each subplot. Above-ground biomass m-2 was obtained by
weighing an unthreshed bundle from 1m row and a subsample of grain and straw were weighed and oven-dried at 60oC for moisture correction. Individual
kernel weight was estimated using a subsample of 300 kernels. Number of spikes m-2 was determined
by weighing the total grain weight of 1m row, correcting the moisture to 13%. Data were analyzed using analysis of variance and path coefficients procedure described by Genes (CRUZ, 1997). Path analysis was performed using genotypic correlation considering grain yield as the response variable and number of spike m-2, number of grains per spike,
kernel weight, number of days to anthesis, above-ground biomass m-2 and plant height as predictor
variables. To satisfy the assumption of additivity for the path-coefficient analysis, yield and yield component data were logarithmically transformed prior to analysis. Tests of significance of water treatments by F test and phenotypic correlation coefficients of yield and its components and plant traits by t-test were obtained through the Statistical Analysis System (SAS, 1990).
RESULTS AND DISCUSSION
Water shortage conditions allowed the comparisons of irrigated and non-irrigated treatments. The period without rain in 1994 ranged from 81 to 124 and 58 to 109 days after plant emergence for first and second sowing dates, respectively. In 1995, the period without rain ranged from 86 to114 and 60 to 103 days after plant emergence for first and second sowing dates, respectively. In general, for both years, periods without rain occurred from early milk to grain ripening and from flag leaf sheath opening to grain ripening for first and second sowing dates, respectively. Rainfall water availability and irrigation plus precipitation on plants from sowing to grain maturity were respectively: 338,8/477,4mm for first sowing of 1994, 333,7/539,3mm for second sowing of 1994, 187,8/342,2mm for first sowing of 1995 and 155,5/353,9mm for second sowing of 1995. Lower rainfall was observed in the second sowing date in 1995, when most of the water available to the plants was concentrated in the period from sowing to 35 days after emergence. Higher rainfall water availability was verified at the first sowing in 1994, when plenty of water was available from before sowing until early milk stage.
Increment of grain yield in irrigated water regime over non-irrigated treatments was verified in experiments conducted in 1994 (first and second sowing dates) and in 1995 second sowing date (Table 1). In the first sowing of 1995, grain yield was lower in the irrigated compared to the non-irrigated water regime, due to the higher lodging occurred in the irrigated treatment (49.9% versus 9.2%). In the
second sowing date of 1995, in spite of 44 days without rainfall (60 to 103 days after plant emergence) there were no apparent differences among water regimes. This probably was due to high water availability in the soil at the beginning of the period without rain, as well as the late sowing and higher temperature that decreased plant growth, as can be observed by the lower production of above-ground biomass (Table 1). Reduction in the length of the plant cycle under rainfed conditions is one of primary effects of the water deficit (THOMPSON & CHASE, 1992), even when it occurs late in the season as observed in this study.
In both years, water stress in the first sowing was less severe than in the second sowing (Table 1). In the first sowing of 1994, there were significant differences among irrigated and non-irrigated water regimes for grain yield, kernel weight and number of days to anthesis. In the first sowing of 1995, all characters revealed significant differences. Positive effects of irrigation were observed for number of grains per spike, number of days to anthesis and plant height, while a negative effect was present for grain yield, number of spikes m-2, kernel weight and
above-ground biomass. For the second sowing date, which had a longer period of water deficit, in 1994 all characters revealed significant differences among irrigated and non-irrigated water regimes, except for kernel weight. In 1995, the irrigated water regime was significantly superior to the non-irrigated for grain yield, number of days to anthesis and above-ground biomass. The other traits did not show any significant differences among water regimes.
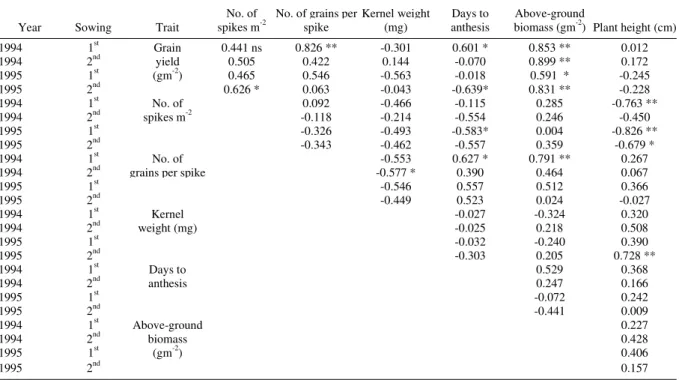
The irrigated and non-irrigated water regimes presented similar phenotypic correlation (Tables 2 and 3). In general, grain yield correlated positively with number of spike m-2, number of grains
per spike and above-ground biomass. The number of spikes m-2, correlated negatively with plant height,
similarly as obtained by DEWEY & LU (1959). According to these authors, high productivity of spikes in tall plants is difficult to be obtained. The number of grains per spike correlated negatively with kernel weight and positively with above-ground biomass and number of days to anthesis. The above-ground biomass correlated positively with grain yield. As this trait correlated positively with plant height, consequently, selection of taller plants leads to the largest amount of above-ground biomass. However, as higher plants present smaller number of spikes m-2 and higher lodging, the choice of taller
Table 1 - Biometrical and phenological characters of wheat genotypes under irrigated (I) and non-irrigated (NI) conditions.
Experiment
Year Sowing Water regime
Grain yield (gm-2)
No. of spikes m-2
No . of grains per spike
Kernel weight (mg)
Days to anthesis
Above-ground biomass (gm-2)
Plant height (cm)
1994 1st I 458.0 a1 361.0 a 37.0 a 35.9 a 78.5 a 1011.4 a 82.4 a
1994 1st NI 431.8 b 346.5 a 37.2 a 34.8 b 76.9 b 961.6 a 83.5 a
1994 2nd I 432.5 a 385.7 a 39.9 a 29.1 a 80.9 a 999.3 a 85.1a
1994 2nd NI 329.0 b 319.3 b 37.7 b 27.9 a 77.5 b 756.8 b 80.8 b
1995 1st I 304.4 b 266.4 b 37.6 a 31.4 b 74.6 a 749.6 b 84.8 a
1995 1st NI 434.9 a 380.9 a 31.6 b 37.2 a 69.8 b 921.0 a 80.4 b
1995 2nd I 277.7 a 317.1 a 37.0 a 24.5 a 70.4 a 763.8 a 85.2 a
1995 2nd NI 243.3 b 299.5 a 34.9 a 24.0 a 69.8 b 690.9 b 83.3 a
1
For sowing period, means within the same column followed by same letter are not significantly different at 0.05 probability level by F test. Table 2 - Phenotypic correlation coefficients among grain yield, yield components, and plant traits of wheat genotypes under irrigated field
condition.
Year Sowing Trait No . of spikes m-2 N
o
. of grains
perspike Kernel weight(mg) anthesisDays to biomass (gmAbove-ground-2) Plant height(cm)
1994 1st Grain 0.126 ns 0.811 ** -0.169 0.692 * 0.845 ** 0.058
1994 2nd yield 0.520 0.168 -0.004 -0.548 0.384 -0.294
1995 1st (gm2) 0.595 * 0.750 ** -0.695 * 0.306 0.649 * -0.139
1995 2nd 0.650 * -0.164 0.207 -0.563 0.742 ** -0.039
1994 1st No . of -0.123 -0.325 -0.154 -0.074 -0.721 **
1994 2nd spikes m-2 -0.074 -0.486 -0.313 0.134 -0.634 *
1995 1st 0.070 -0.594 * -0.363 -0.039 -0.589 *
1995 2nd -0.427 -0.236 -0.501 0.405 -0.519
1994 1st No . of -0.572 0.617 * 0.768 ** 0.160
1994 2nd grains per spike -0.690 * 0.459 0.603 * 0.052
1995 1st -0.735 ** 0.709 ** 0.672 * 0.061
1995 2nd -0.586 * 0.474 -0.449 -0.213
1994 1st Kernel -0.042 -0.165 0.308
1994 2nd weight (mg) -0.444 -0.411 0.326
1995 1st -0.297 -0.234 0.427
1995 2nd -0.322 0.555 0.778 **
1994 1st Days to 0.751 ** 0.394
1994 2nd anthesis 0.362 0.181
1995 1st 0.528 0.244
1995 2nd -0.281 -0.018
1994 1st Above-ground 0.384
1994 2nd biomass 0.369
1995 1st (gm-2) 0.598 *
1995 2nd 0.393
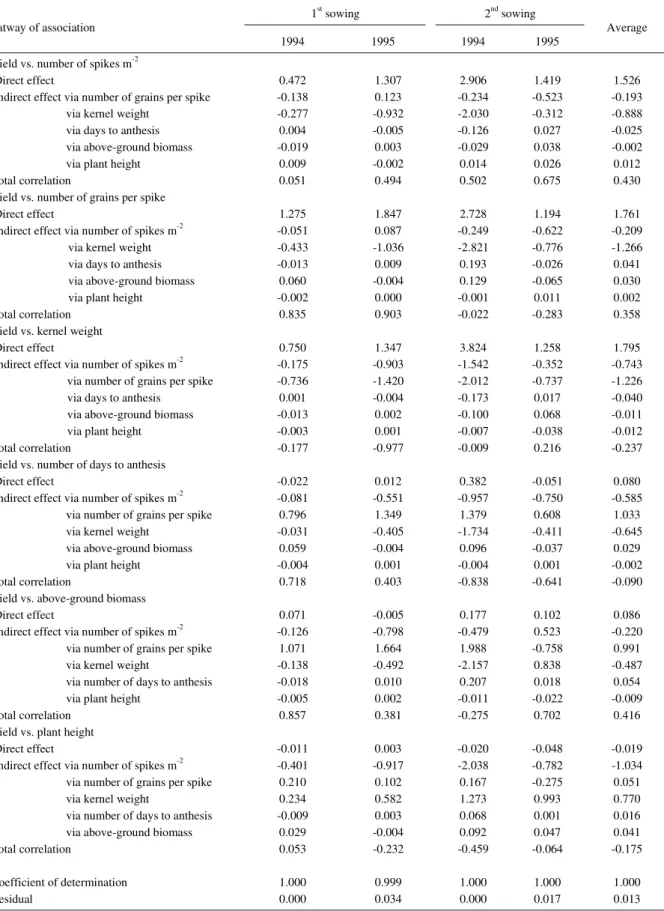
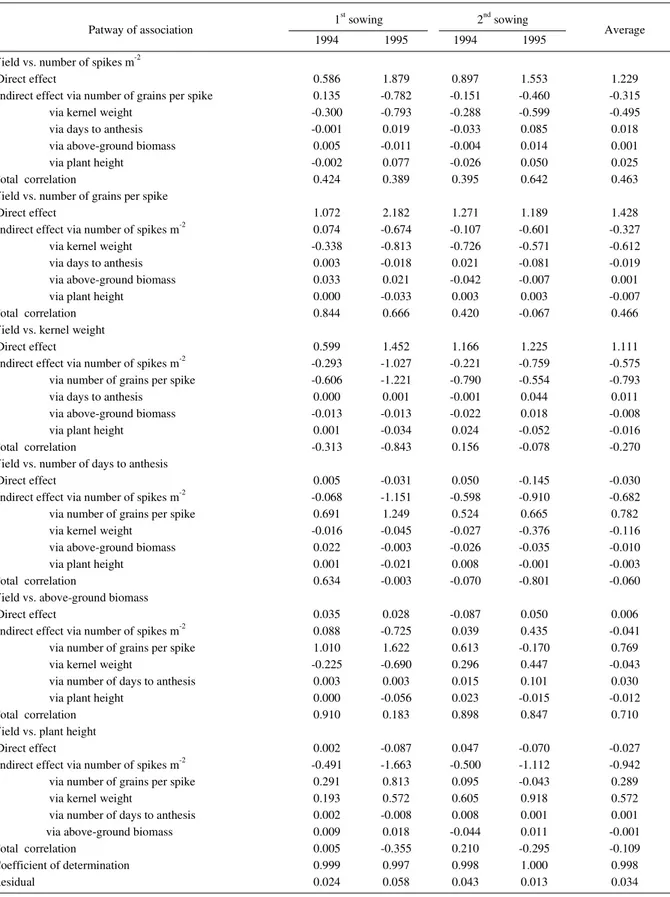
In irrigated and non-irrigated water regimes, the direct effects of the number of spikes m-2 and number
of grains per spike on grain yield were positive and of high magnitude and the total correlation coefficients of grain yield with number of spike m-2 and number of
grains per spike were positive and of intermediate value (Tables 4 and 5). In these cases, direct selection for higher number of spike m-2 and/or larger number of grains per
spike would be enough to increase grain yield. These results are similar to those obtained by SHAMSUDDIN (1987), SIMANE et al. (1998), and DEL BLANCO et al. (2001). Kernel weight had high positive direct effect on yield that was nullified by the negative indirect effects of number of grains per spike and number of spikes m-2,
resulting in low or insignificant negative total correlations. Association studies between kernel weight and grain yield indicated a tendency of kernel weight to decrease with increasing of number of spikes m-2 and
number of grains per spike. Similar result was also verified by SIDWELL et al. (1976), where negative associations were verified between kernel weight and tiller number, and between kernel weight and number of grains per spike. The direct effect of number of days to anthesis and plant height on grain yield was negative or close to zero, and the total correlation between these
traits and grain yields were of small magnitude. This is an indication that these two traits had small effect on grain yield. The direct ground biomass had negligible direct effects on grain yield in spite of positive correlation coeficients, which occurred mainly due to the positive indirect effect of number of grains per spike.
A more detailed study of the relationships obtained by path analysis showed that the relation between grain yield and its components and plant traits are somewhat different from that presented in the simple analysis of correlation. In the correlation study, the above-ground biomass was the main plant trait related to grain yield increase, while in the path analysis its importance was secondary. The apparent divergence is due to the analytical approach. While correlation simply identifies the mutual associations among the parameters, path analysis allows determination of the relative magnitude of each effect. When the objective is to establish relationships among the variables that affect grain yield, path coefficient analysis is a more efficient method than the correlation analysis (DEWEY & LU, 1959). Thus, the results reported in this paper show that number of spikes m-2 and number of grains per spike, followed by
above-ground biomass m-2 should be considered as selection
criteria for wheat yield improvement.
Table 3 - Phenotypic correlation coefficients among grain yield, yield components, and plant traits of wheat genotypes under non-irrigated field condition.
Year Sowing Trait
No. of spikes m-2
No. of grains per spike
Kernel weight (mg)
Days to anthesis
Above-ground
biomass (gm-2) Plant height (cm)
1994 1st Grain 0.441 ns 0.826 ** -0.301 0.601 * 0.853 ** 0.012
1994 2nd yield 0.505 0.422 0.144 -0.070 0.899 ** 0.172
1995 1st (gm-2) 0.465 0.546 -0.563 -0.018 0.591 * -0.245
1995 2nd 0.626 * 0.063 -0.043 -0.639* 0.831 ** -0.228
1994 1st No. of 0.092 -0.466 -0.115 0.285 -0.763 **
1994 2nd spikes m-2 -0.118 -0.214 -0.554 0.246 -0.450
1995 1st -0.326 -0.493 -0.583* 0.004 -0.826 **
1995 2nd -0.343 -0.462 -0.557 0.359 -0.679 *
1994 1st No. of -0.553 0.627 * 0.791 ** 0.267
1994 2nd grains per spike -0.577 * 0.390 0.464 0.067
1995 1st -0.546 0.557 0.512 0.366
1995 2nd -0.449 0.523 0.024 -0.027
1994 1st Kernel -0.027 -0.324 0.320
1994 2nd weight (mg) -0.025 0.218 0.508
1995 1st -0.032 -0.240 0.390
1995 2nd -0.303 0.205 0.728 **
1994 1st Days to 0.529 0.368
1994 2nd anthesis 0.247 0.166
1995 1st -0.072 0.242
1995 2nd -0.441 0.009
1994 1st Above-ground 0.227
1994 2nd biomass 0.428
1995 1st (gm-2) 0.406
1995 2nd 0.157
Table 4 - Direct and indirect effects of factors influencing grain yield in wheat genotypes under irrigated field conditions.
1st sowing 2nd sowing
Patway of association
1994 1995 1994 1995
Average
Yield vs. number of spikes m-2
Direct effect 0.472 1.307 2.906 1.419 1.526
Indirect effect via number of grains per spike -0.138 0.123 -0.234 -0.523 -0.193
via kernel weight -0.277 -0.932 -2.030 -0.312 -0.888
via days to anthesis 0.004 -0.005 -0.126 0.027 -0.025
via above-ground biomass -0.019 0.003 -0.029 0.038 -0.002
via plant height 0.009 -0.002 0.014 0.026 0.012
Total correlation 0.051 0.494 0.502 0.675 0.430
Yield vs. number of grains per spike
Direct effect 1.275 1.847 2.728 1.194 1.761
Indirect effect via number of spikes m-2 -0.051 0.087 -0.249 -0.622 -0.209
via kernel weight -0.433 -1.036 -2.821 -0.776 -1.266
via days to anthesis -0.013 0.009 0.193 -0.026 0.041
via above-ground biomass 0.060 -0.004 0.129 -0.065 0.030
via plant height -0.002 0.000 -0.001 0.011 0.002
Total correlation 0.835 0.903 -0.022 -0.283 0.358
Yield vs. kernel weight
Direct effect 0.750 1.347 3.824 1.258 1.795
Indirect effect via number of spikes m-2 -0.175 -0.903 -1.542 -0.352 -0.743
via number of grains per spike -0.736 -1.420 -2.012 -0.737 -1.226
via days to anthesis 0.001 -0.004 -0.173 0.017 -0.040
via above-ground biomass -0.013 0.002 -0.100 0.068 -0.011
via plant height -0.003 0.001 -0.007 -0.038 -0.012
Total correlation -0.177 -0.977 -0.009 0.216 -0.237
Yield vs. number of days to anthesis
Direct effect -0.022 0.012 0.382 -0.051 0.080
Indirect effect via number of spikes m-2 -0.081 -0.551 -0.957 -0.750 -0.585
via number of grains per spike 0.796 1.349 1.379 0.608 1.033
via kernel weight -0.031 -0.405 -1.734 -0.411 -0.645
via above-ground biomass 0.059 -0.004 0.096 -0.037 0.029
via plant height -0.004 0.001 -0.004 0.001 -0.002
Total correlation 0.718 0.403 -0.838 -0.641 -0.090
Yield vs. above-ground biomass
Direct effect 0.071 -0.005 0.177 0.102 0.086
Indirect effect via number of spikes m-2 -0.126 -0.798 -0.479 0.523 -0.220
via number of grains per spike 1.071 1.664 1.988 -0.758 0.991
via kernel weight -0.138 -0.492 -2.157 0.838 -0.487
via number of days to anthesis -0.018 0.010 0.207 0.018 0.054
via plant height -0.005 0.002 -0.011 -0.022 -0.009
Total correlation 0.857 0.381 -0.275 0.702 0.416
Yield vs. plant height
Direct effect -0.011 0.003 -0.020 -0.048 -0.019
Indirect effect via number of spikes m-2 -0.401 -0.917 -2.038 -0.782 -1.034
via number of grains per spike 0.210 0.102 0.167 -0.275 0.051
via kernel weight 0.234 0.582 1.273 0.993 0.770
via number of days to anthesis -0.009 0.003 0.068 0.001 0.016
via above-ground biomass 0.029 -0.004 0.092 0.047 0.041
Total correlation 0.053 -0.232 -0.459 -0.064 -0.175
Coefficient of determination 1.000 0.999 1.000 1.000 1.000
Table 5. Direct and indirect effects of factors influencing grain yield in wheat genotypes under non-irrigated field conditions.
1st sowing 2nd sowing Patway of association
1994 1995 1994 1995 Average
Yield vs. number of spikes m-2
Direct effect 0.586 1.879 0.897 1.553 1.229
Indirect effect via number of grains per spike 0.135 -0.782 -0.151 -0.460 -0.315
via kernel weight -0.300 -0.793 -0.288 -0.599 -0.495
via days to anthesis -0.001 0.019 -0.033 0.085 0.018
via above-ground biomass 0.005 -0.011 -0.004 0.014 0.001
via plant height -0.002 0.077 -0.026 0.050 0.025
Total correlation 0.424 0.389 0.395 0.642 0.463
Yield vs. number of grains per spike
Direct effect 1.072 2.182 1.271 1.189 1.428
Indirect effect via number of spikes m-2 0.074 -0.674 -0.107 -0.601 -0.327
via kernel weight -0.338 -0.813 -0.726 -0.571 -0.612
via days to anthesis 0.003 -0.018 0.021 -0.081 -0.019
via above-ground biomass 0.033 0.021 -0.042 -0.007 0.001
via plant height 0.000 -0.033 0.003 0.003 -0.007
Total correlation 0.844 0.666 0.420 -0.067 0.466
Yield vs. kernel weight
Direct effect 0.599 1.452 1.166 1.225 1.111
Indirect effect via number of spikes m-2 -0.293 -1.027 -0.221 -0.759 -0.575
via number of grains per spike -0.606 -1.221 -0.790 -0.554 -0.793
via days to anthesis 0.000 0.001 -0.001 0.044 0.011
via above-ground biomass -0.013 -0.013 -0.022 0.018 -0.008
via plant height 0.001 -0.034 0.024 -0.052 -0.016
Total correlation -0.313 -0.843 0.156 -0.078 -0.270
Yield vs. number of days to anthesis
Direct effect 0.005 -0.031 0.050 -0.145 -0.030
Indirect effect via number of spikes m-2 -0.068 -1.151 -0.598 -0.910 -0.682
via number of grains per spike 0.691 1.249 0.524 0.665 0.782
via kernel weight -0.016 -0.045 -0.027 -0.376 -0.116
via above-ground biomass 0.022 -0.003 -0.026 -0.035 -0.010
via plant height 0.001 -0.021 0.008 -0.001 -0.003
Total correlation 0.634 -0.003 -0.070 -0.801 -0.060
Yield vs. above-ground biomass
Direct effect 0.035 0.028 -0.087 0.050 0.006
Indirect effect via number of spikes m-2 0.088 -0.725 0.039 0.435 -0.041
via number of grains per spike 1.010 1.622 0.613 -0.170 0.769
via kernel weight -0.225 -0.690 0.296 0.447 -0.043
via number of days to anthesis 0.003 0.003 0.015 0.101 0.030
via plant height 0.000 -0.056 0.023 -0.015 -0.012
Total correlation 0.910 0.183 0.898 0.847 0.710
Yield vs. plant height
Direct effect 0.002 -0.087 0.047 -0.070 -0.027
Indirect effect via number of spikes m-2 -0.491 -1.663 -0.500 -1.112 -0.942
via number of grains per spike 0.291 0.813 0.095 -0.043 0.289
via kernel weight 0.193 0.572 0.605 0.918 0.572
via number of days to anthesis 0.002 -0.008 0.008 0.001 0.001
via above-ground biomass 0.009 0.018 -0.044 0.011 -0.001
Total correlation 0.005 -0.355 0.210 -0.295 -0.109
Coefficient of determination 0.999 0.997 0.998 1.000 0.998
REFERENCES
BLUE, E.N. et al. Influence of planting date, seeding rate, and phosphorus rate on wheat yield. Agronomy Journal, Madison. v.82, n.4, p.762-768, 1990.
CRUZ, C.D. Programa genes: aplicativo computacional em genética e estatística. Viçosa : UFV, 1997. 442p.
D E L B L A N C O , I . A . et al. A g r o n o m i c p o t e n t i a l o f synthetic hexaploid wheat-derived populations. Crop Science, Madison, v.41, n.3, p.670-676, 2001. DEWEY, D.R.; LU, K.H. A correlation and path-coefficient a n a l y s i s o f c o m p o n e n t s o f c r e s t e d w h e a t g r a s s s e e d production. Agronomy Journal, Madison, v.51, n.8, p.515-518, 1959.
FISCHER, R.A. et al. Irrigation of dwarf wheats in the Yaqui Valley of Mexico. Experimental Agriculture,New York, v.13, n.4, p.353-367, 1977.
H O C H M A N , Z . E f f e c t o f w a t e r s t r e s s w i t h p h a s i c d e v e l o p m e n t o n y i e l d o f w h e a t g r o w n i n a s e m i - a r i d environment. Field Crops Research, Amsterdam, v.5, n.1, p.55-67, 1982.
KUMAR, A.B.N.; HUNSHAL, C.S. Correlation and path coefficient analysis in durum wheats (Triticum durum Desf.) under different planting dates. Crop Research Hisar,v.16, n.3, p.358-361, 1998.
MCMASTER, G.C. et al. Irrigation and culm contribution to yield and yield components of winter wheat. Agronomy Journal, Madison, v.86, n.6, p.1123-1127, 1984.
SAS INSTITUTE INC. SAS - Procedures Guide;version 6. 3.ed. Cary : SAS Institute, 1990. 705p.
SHAMSUDDIN, A.K.M. Path analysis in bread wheat. Indian Journal of Agricultural Sciences,New Delhi, v.57, n.1, p.47-49, 1987.
SIDWELL, R.J. et al. Inheritance and interrelationships of grain yield and selected yield related traits in a hard red winter wheat cross. Crop Science, Madison, v.16, n.5, p.650-654, 1976.
SIMANE, B. et al. Ontogenetic analysis of yields components and yield stability of durum wheat in water-limited environments.
Euphytica, Dordrecht, v.71, n.3, p.211-219, 1993.
SIMANE, B. et al. Growth and yield component analysis of durum wheat as an index of selection to terminal moisture stress. Tropical Agriculture, Guildford, v.75, n.3, p.363-368, 1998.
SINGH, D. et al. Correlation and path coefficient analysis among flag leaf area, yield and yield attributes in wheat (Triticum aestivum L.). Cereal Research Communications, Szeged, v.7, p.145-152, 1979.
THOMPSON, J.A.; CHASE, D.L. Effect of limited irrigation on growth and yield of a semi-dwarf wheat in southern new south wales.