Cell proliferation markers in the transplanted canine transmissible venereal tumor
[Marcadores de proliferação celular no tumor venéreo transmissível canino transplantado]
F.G.A. Santos, L. Moro*, G.D. Cassali, T.A. Paixão, P.P. Campos, S.S. Silva, A.C. Vasconcelos
Instituto de Ciências Biológicas - Universidade Federal de Minas Gerais Caixa Postal 486
31270-901 - Belo Horizonte, MG
ABSTRACT
Adult male mongrel dogs were subcutaneously transplanted with the canine transmissible venereal tumor (TVT) on the hypogastric region. Twelve specimens of tumors were collected, half during the proliferative phase and the other half during the regressive phase. Fragments of the tumor were fixed in 10% buffered formalin and routinely processed for light microscopy. Sections of 4µm were stained by Schorr or AgNOR or either immunostained for MIB1 (Ki67). Schorr stain, AgNOR and MIB1 showed an increased proliferative activity through mitotic index, nuclear argyrophilic protein stain and cycling tumoral cells in the growing tumors, respectively. All of the three cell proliferation markers were able to distinguish the TVT in both evolution phases. MIB1 monoclonal antibody was the best in the morphologic evaluation of growth and regression of TVT. This resulted in higher values than AgNORs counting and mitotic index. MIB1 immunostaining was the most effective parameter of the proliferative activity of TVT. However, a significant correlation has been detected only between mitosis counting and AgNORs.
Keywords: dog, venereal tumors, MIB1, AgNOR
RESUMO
Cães machos, adultos, mestiços, foram transplantados com células do tumor venéreo transmissível canino (TVTC), na região hipogástrica. Foram coletados doze espécimes do TVTC, sendo metade durante a fase proliferativa e metade durante a fase regressiva. Fragmentos do tumor foram fixados em formol a 10%, tamponado e processado rotineiramente para microscopia de luz. Secções de 4µm foram coradas pelo Shorr, ou pela AgNOR, ou ainda, imunocorado para MIB 1 (Ki67). As colorações pelo Shorr, AgNOR, ou MIB 1 mostraram um aumento do índice mitótico, coloração da proteína argirofílica nuclear e células tumorais ciclando em tumores em crescimento, respectivamente. Todos os três marcadores de proliferação celular foram capazes de distinguir o TVTC em ambas as fases de evolução. O anticorpo monoclonal MIB 1 foi o melhor na avaliação morfológica, de crescimento e regressão do TVTC. Isto resultou em um valor maior que a contagem de AgNOR e do índice mitótico. A imunomarcação com MIB1 foi o parâmetro mais efetivo da atividade proliferativa. No entanto, só foi observada uma correlação positiva entre a contagem de mitose e a AgNOR.
Palavras-chave: cão, tumor venéreo, MIB 1, AgNOR
INTRODUCTION
The canine transmissible venereal tumor (TVT) is an undifferentiated neoplasm of round cells that is sexually transmitted and installs primarily in the genital organs of both sexes. Studies using
Recebido em 10 de março de 2011 Aceito em 28 de setembro de 2011
*Autor para correspondência (corresponding author) E-mail: [email protected]
to tumors of 3-6mm after 2-3 weeks. The development of the tumor is very quick in the beginning and slows down as time passes.
A major characteristic of the TVT cells is their high proliferative capacity (Robenhorst et al., 1993; Kreipe et al., 1995). The number of proliferative cells constitutes an important parameter in the prognosis of several different tumors (Quinn and Wright, 1990; Robenhorst et al., 1993). Among the methods developed to evaluate the growth of a neoplasia are the determination of the mitotic index and the detection of proliferative markers through histochemical and immunohistochemical reactions. They are the most useful and commonly applied methods (Robenhorst et al., 1993).
Determining the number of mitoses through the traditional morphological approach in routine stained slides is still very important for the prognosis (Kreipe et al., 1995).
Histochemically, the argyrophilic nucleolar organizing regions (AgNOR) technique has been frequently used in oncology. The silver impregnation results in dark brownish dots that can be counted and their areas estimated within the nucleus. The number and area of the AgNORs represent parameters that reflect the degree of the proliferative activity of the cells. Both of them are increased in malignant neoplasias (Chung et al., 1994). Therefore, AgNORs contribute to the diagnosis and prognosis of the tumor pathology (Crocker et al., 1989; Ploton, 1994; Rüschoff et al., 1994).
The use of the Ki-67 (MIB1) as a proliferative cell marker shows an almost accurate evaluation of the cellular growth fraction (Löhr et al., 1997). MIB1 identifies the Ki-67 antigen epitopes that are formalin and paraffin resistant. MIB1 augments the practical applicability of the Ki-67 antigen as a method to evaluate the cellular proliferation in tumors (Schmitt and Ferreira, 1995).
The aim of this paper was to investigate and compare the use of some cell proliferation markers such as mitotic index, number and area of AgNORs and immunolabeling for MIB1 during the growing and regression phases of the TVT.
MATERIAL AND METHODS
The tumor cells were obtained from two mongrel adult male dogs with TVT of natural occurrence, according to Santos et al. (2008). Imprints of the tumors were fixed in methanol and stained with May Grünwald-Giemsa (Luna, 1968) to confirm the cytology of the TVT.
The TVT cells were transplanted in adult mongrel male clinically healthy dogs that were obtained from a Center of Zoonosis. Animals were fed with commercial food and water was given ad libitum. Each dog was inoculated subcutaneously with 107 viable cells/ml in the hypogastric region in four different places, 10cm apart from each other (Koike et al., 1979). Tumors were measured daily with a caliper, their volumes were calculated through the formula [length x width x height x /4(cm3)] proposed by
Liao et al. (2003).
After six months, twelve specimens of tumors were collected: (1) six with growing tumors and (2) six with regressive tumors. All procedures with the animals were carried out in accordance to the International Guiding Principles for Biomedical Research Involving Animals.
The TVT fragments were fixed in 10% buffered formalin and routinely processed. Sections of 4µm stained by Schorr trichromic (Luna, 1968) were used for the quantification of the mitotic index and for evaluation of the histological pattern of the tumor. Only the cells with unequivocal mitosis were counted, according to Schmitt and Ferreira (1995). The total number of mitosis was counted in 10 consecutive fields using the magnification of 400X. Hyperchromatic apoptotic nuclei and lymphocyte infiltrate were not included, as previously cited by Elston and Ellis (1991). The mitotic index was calculated using the following formula: Mit= of mitotic cells/ of total cells per field.
slide in the magnification of 1000X. By densitometry, AgNORs numbers and areas were obtained within the nuclei (Santos et al., 1998).
Another set of 4µm thick sections were used in immunohistochemistry. The sections were deparaffinized, hydrated and submitted to antigen retrieval using the retrieval solution (DAKO) in water bath (1000C). Peroxidase was
quenched with 3% hydrogen peroxide. The sections were treated with normal serum (UV block) followed by the primary monoclonal antibody MIB1 and incubated in a humid chamber. The secondary antibody (Biotiny Goat Anti-Polyvalent - UltraVision Large Volume Detection System Anti-Polyvalent, HRP - LabVision) was applied and slides were again incubated in a humid chamber. The reaction was developed by diaminobenzidine (DAB peroxidase reagent); the slides were counter
stained with Harris’s hematoxilyn and mounted.
The immunostaining by MIB1 was measured in 1000 cells (15 to 34 fields, depending on its cellularity) with a 100X objective. Only the labeled cells were considered for the histological and morphometrical analysis. The result was expressed as the immunolabeling index for MIB1 (MIB). The calculation of the MIB was carried out using the following formula: MIB = Σ of the immunolabeled cells/Σ of the total cells inside
that field.
The experimental design was entirely randomized. The proliferative indexes (PI) (i.e. Mit, AgNORn, AgNORa and MIB) of each tumor underwent ANOVA. The experimental unit was the dog. One tumor of each animal was evaluated for each treatment. The treatments
were analyzed through Fisher’s test (P<0.05) (Sampaio, 1998).
RESULTS
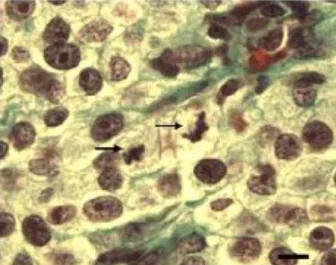
Mitotic figures were easily recognized as dense dark plaques of chromosomes with brush borders. The nuclear envelope was absent and the cytoplasm was lightly eosinophilic or colorless. The aspect of the chromatin lumps allows the identification of the mitotic phases, such as metaphases, anaphases and telophases (Figure 1).
The number of mitotic figures varied from 2-19/field in the growing TVTs and 0-7/field in the regressive ones. The average number of mitosis in 10 consecutive fields was 8.10 (SD = 3.47) for the growing and 2.80 (SD = 1.80) for the regressive TVTs. The ANOVA of the Mit showed differences (P<0.05%) between the growing and the regressive phases.
The AgNORs were identified as dark brownish dots that varied in shape, size and distribution. Additionally, they were more frequent and intense in the growing phase than in regressive TVTs. The dots were found isolated or aggregated, round or irregularly shaped, diffusely distributed inside the nucleus or around the nucleolus, resembling satellites (Figure 2A and 2B). The morphometry showed that TVTs in both evolution phases had the same shape, size and distribution AgNORs patterns.
ANOVA showed that growing tumors had a higher average number and area of the AgNORs within the nucleus than the regressive TVTs (Table 1).
Table 1. Statistical analysis of the AgNORs number and area in TVT cells nuclei of the growing and regressive phases
Variables * Growing Regressive P < 0.05 AgNORn 15.35 4.00b 9.96 3.71a 0.01 AgNORa 6.04 1.54b 2.57 1.34a 4.24E-06
*AgNORn: densitometric quantification of AgNORs within the nuclei; AgNORa: densitometric measurement of the total AgNORs area within the nuclei.
Growing tumors did not present correlation between the number and the area of the AgNORs within the nucleus (P>0.05%). However, the same correlation was shown to be positive within the regressive tumors.
Figure 1. Transplanted canine venereal tumor during the growing phase. Observe the mitosis figures (arrows) (Schorr, bar = 10m).
Figure 2. Micrography of a transplanted canine transmissible venereal tumor (TVT): (A) TVT in the growing phase. Observe that AgNORs are distributed diffusely and in higher quantity inside the nuclei and nucleoli (arrows). (B) TVT in the regressive phase with AgNORs that are more frequent inside the nucleoli (arrows) (Silver nitrate, bar = 10m).
The fraction of the MIB1 immunolabeling in growing and regressive tumors is presented in table 2. The variance analysis in MIB1 percentage of immunolabeled cells showed difference between both TVT evolution phases (P < 0.05).
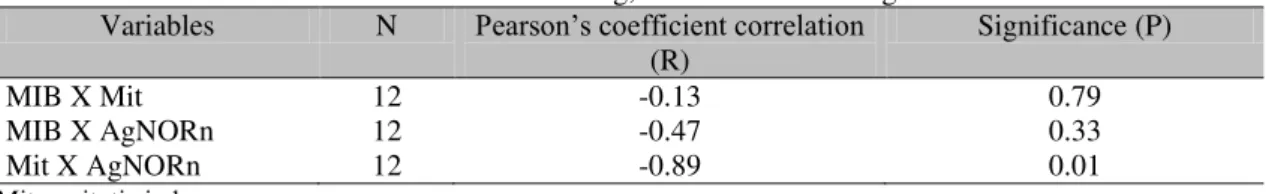
The correlation between MIB1 immunolabeling and other proliferation markers are summarized in table 3.
A correlation between MIB and Mit patterns was not observed (r = - 0.1370). The result was
confirmed by the Pearson’s correlation test (P =
0.79 %). The same occurred considering MIB and AgNORn (r = - 0.47; P = 0.33%). On the other hand, a positive correlation was evident between Mit and AgNORn (r = 0.8990; P < 0.05%).
Table 2. Variance analysis and descriptive statistic of the percentage of MIB1 immunolabeled cells in growing and regressive TVTs
Phases Variables
Minimum Maximum Average P
Growing 40.20 87.16 59.3216.59 0.002
Regressive 8.38 41.86 25.9011.58
Table 3.Correlation between MIB1 immunolabeling, mitotic index and AgNORn Variables N Pearson’s coefficient correlation
(R) Significance (P)
MIB X Mit 12 -0.13 0.79
MIB X AgNORn 12 -0.47 0.33
Mit X AgNORn 12 -0.89 0.01
Mit – mitotic index
DISCUSSION
Traditionally, the counting of mitotic figures has been utilized to evaluate the cellular proliferation in tumor sections stained by HE (Kreipe et al., 1995). Here, the mitotic index was higher in growing phases than in regressive phases of the TVT. This result differs from that presented by Cohen and Steel (1972), who did not succeed in distinguishing both TVT evolution phases through mitotic index. A major stimulus for the evaluation of proliferation indexes is the conviction that it could provide data to support a more accurate procedure with the patient. Until recently, the knowledge of the biological, biochemical and molecular events that precede or regulate mitosis was scarce. Consequently, the cellular proliferation was estimated by counting the mitotic figures. However counting mitotic cells is only possible during the cellular cycle phase of mitosis. Cells in interphase cannot be considered in this analysis, although this phase corresponds to a very long period of the cellular cycle (Robenhorst et al., 1993). According to van Diest et al. (1998), the counting of mitotic cells can be a tool for diagnosis and prognosis in tumor pathology, mainly when it is correlated to other proliferation markers.
Both TVT evolution phases presented similar distribution patterns, organization and shape of the AgNORs inside the nuclei and around the nucleoli. The AgNORs were found isolated or grouped forming agglomerates under a cordon shape, or under circular shape inside the nucleus. They were also found in satellite shape around the nucleolus and as necklaces in the nucleolus, as described by others (Crocker et al., 1989; Rüschoff et al., 1989; Toikkanen and Joensuu, 1993). The number and the total area of AgNORs in the nucleus were higher in growing TVTs than in regressive ones. Both parameters were utilized by Santos et al. (1998) to show the difference between genital and extra genital TVTs of natural occurrence. Harmelin et al. (1995) compared the number and the area of AgNORs in the nucleus between genital TVTs and their metastasis. They found that metastasis had significantly higher averages than the genital TVTs.
indexes. AgNORs technique may be also used to estimate the cellular cycle length. The shorter the cellular cycle the more ribosomes and proteins can be produced and more AgNORs per unit of time are presented (Derenzini and Ploton, 1991; Trerè, 1993; Rüschoff et al., 1994).
Again, there was a positive correlation between the number and the area of AgNORs in the regressive TVTs. Growing TVTs did not show the same correlation. It may suggest that growing TVTs present a morphological and distribution pattern of AgNORs different from that showed by regressive TVTs. Additionally, growing TVTs have an AgNOR pattern similar to malignant tumors (Underwood and Giri, 1988; Derenzini and Ploton, 1991; Trerè, 1993; Rüschoff et al., 1994; Löhr et al., 1997; Santos et al., 1998).
MIB1 immunolabeled cells were found scattered in the growing TVTs and occurred as isolated groups in regressive tumors. Besides, growing TVTs presented more immunolabeled cells than the regressive ones, suggesting that in the regressive TVTs the cellular proliferation activity was decreased.
Regressive TVTs had less MIB1 immunolabeled cells and mitotic figures than the growing ones. Similar results were observed during TVT spontaneous (Pérez et al., 1998) and chemotherapy (Gonzalez et al., 2000) induced regression of natural occurrence. This result summed up to the highest apoptotic index observed and this phase (Santos et al., 2008) plays an important role in the natural involution of the TVT.
A correlation between MIB1 immunolabeling and mitotic index was not found, although both methods differentiated well the two TVT evolution phases. Conversely, according to Schmitt and Ferreira (1995), the correlation between both markers has been used and described in women breast cancer. In addition, Van Diest et al. (1998) reported a partial correlation between MIB1 immunolabeling and mitotic index. Griffey et al. (1999) also found a positive correlation between both cellular proliferation markers. They also observed that the correlation decreased when the counting of mitotic cells was made out of the MIB1 immunolabeling area. In spite of that, the
correlation still remained significant. Alves et al. (1999) proposed that the AgNORs evaluation could give an estimation of the cell cycling velocity. The association of methods used to calculate the growth fraction (MIB1) and the generation time (AgNOR) could help the estimation of the proliferate activity of a neoplasia. It could also be used to select faster proliferating tumors more accurately (Alves et al., 1999).
However, MIB1 immunolabeling did not correlate with the proliferation index obtained with AgNORs counting. Similar results were showed by Chung et al. (1994) with squamous cell carcinoma of the cervix. They have also found a correlation between both proliferation markers and the histological grade of the tumor. Löhr et al. (1997) verified that the MIB1 immunolabeling had better prognostic importance when associated with histopathologic, clinic, macroscopic and anamnestic patterns than the AgNOR technique.
In this study, MIB1 presented higher values than number and area of AgNORs and Mit. Chung et al. (1994) concluded that a higher MIB1 average compared to the number of AgNORs was correlated to the tumor recurrence. Recurrence was not evaluated in the present study. Dervan et al. (1989) found a high correlation (P < 0.001) between AgNORs and MIB1 in malignant lesions. However, the correlation was significant between groups with benign lesions (P = 0.02).
The usefulness and the reliability of cellular cycle markers are linked to the number of studies that associate marker detection with cellular proliferation and compare them with other methods already standardized (Robenhorst et al., 1993). The present paper characterized the use of different cellular proliferation markers during different evolution phases of the TVT.
REFERÊNCIAS BIBLIOGRÁFICAS
ALVES, V.A.F.; BACCHI, C.E.; VASSALO, J. (Ed.) Manual de imuno-histoquímica. São Paulo: Sociedade Brasileira de Patologia, 1999. p.182-194.
AUBELE, M.; BIESTERFELD, S.; DERENZINI, M. et al. Guidelines of AgNOR quantitation. Zentralbl. Pathol., v.40, p.107-108, 1994.
COHEN, D.; STEEL, G.G. Thymidine labeling studies in a transmissible venereal tumour of the dog. Br. J. Cancer, v.26, p.413-419, 1972. CHUNG, T.K.; CHEUNG, T.H.; WONG, F.W. et al. Ki67 and AgNORs staining in squamous cell carcinoma of the cervix: a comparison. Gynecol. Obstet. Invest., v.37, p.127-120, 1994.
CROCKER, J.; BOLDY, D.A.R.; EGAN, M.J. How should we count AgNORs? Proposal for a standardized approach. J. Pathol., v.158, p.185-188, 1989.
DAS, U.; DAS, A.K. Review of canine transmissible venereal sarcoma. Vet. Res. Comunic., v.24, p.545-556, 2000.
DERENZINI, M.E.; PLOTON, D. Interphase nucleolar organizer regions in cancer cells. Int. J. Exper. Pathol., v.32, p.149-192, 1991.
DERVAN, P.A.; GILMARTIN, L.G.; LOFTUS, B.M. et al. Argyrophilic nucleolar organizer region counts correlate with Ki-67 scores. Am. J. Clin. Pathol., v.92, p.401-407, 1989.
ELSTON, C.W.; ELLIS, I.O. Pathological prognostic factors in breast cancer. I. The value of histological grade in breast cancer: experience from a large study with long-term follow-up. Histopathol., v.19, p.403-410, 1991.
GONZALEZ, C.M.; GRIFFEY, S.M.; NAYDAN, D.K. et al. Canine transmissible venereal tumour: a morphological and immunohistochemical study of 11 tumours in growth phase and during regression after chemotherapy. J. Comp. Pathol., v.122, p.241-248, 2000.
GRIFFEY, S.M.; KRAEGEL, S.A., MADEWELL, B.R. Proliferation indices in spontaneous canine lung cancer: proliferating cell nuclear antigen (PCNA), Ki-67 (MIB1) Mitotic counts. J. Comp. Pathol., v.120, p.321-332, 1999.
HARMELIN, A., ZUCKERMAN, A., NYSKA, A. Correlation of AgNOR protein measurements with prognosis in canine transmissible venereal tumour. J. Comp. Pathol., v.112, p.429-433, 1995.
KOIKE, T.; KUDO, T.; OTOMO, K. et al. Successively transplanted canine transmissible sarcoma. Gann, v.70, p.115-118, 1979.
KREIPE, H.; ZEIDLER, R.; FISCHER, L. et al. Immunocytochemical assessment of cell proliferation. Virchows Arch., v.427, p.324-326, 1995.
LIAO, K.-W.; HUNG, S.-W.; HSIAO, Y.-W. et al. Canine transmissible venereal tumor cell depletion of B lymphocytes: molecule(s) specifically toxic for B cells. Vet. Immunol. Immunopathol., v.92, p.149-162, 2003.
LÖHR, C.V.; TEIFKE, J.P.; FAILING, K. et al. Characterization of the proliferation state in canine mammary tumors by the standardized AgNOR method with postfixation and immunohistologic detection of Ki-67 and PCNA. Vet. Pathol., v.34, p.212-221, 1997.
LUNA, L.G. Manual of histologic staining methods of the Armed Forces Institute of Pathology. 3.ed., New York: McGraw-Hill, 1968. p.234-235.
MORO, L.; VASCONCELOS, A.C.; SANTOS, F.G.A. et al. Determination of the minimal representative number of microscopic fields to quantify apoptosis in canine lymph nodes. Arq. Bras. Med. Vet. Zootec., v.56, p.408-410, 2004.
NIELSEN, S.W.; KENNEDY, P.C. Tumors of the genital system. In: MOULTON, JE Tumors in domestic animals. 3.ed., Berkeley: University of California Press, 1990. p.498-502.
PÉREZ, J.; DAY, M.J.; MOZOS, E. Immunohistochemical study of the local inflammatory infiltrate in spontaneous canine transmissible venereal tumour at different stages of growth. Vet. Immunol. Immunopathol., v.64, p.133-147, 1998.
PLOTON, D.; MENAGER, M.; JEANNESSON, P. et al. Improvement in the staining and the visualization of the argyrophilic proteins of nuclear organizer regions at the optical level. Histoch. J., v.18, p.5-14, 1986.
QUINN, C.M.; WRIGHT, N. The clinical assessment of proliferation and growth in human tumours: evaluation of methods and applications as prognostic variables. J. Pathol., v.160, p.93-102, 1990.
ROBENHORST, S.H.; BURINI, R.C.; SCHMITT, F.C.L. Marcadores de proliferação celular. Rev. Bras. Patol. Clin., v.29, p.24-29, 1993.
ROGERS, K.S. Transmissible venereal tumor. Cont. Educ. Artic., v.19, p.1036-1044, 1997.
RÜSCHOFF, J.; FAUSER, G.; KNÜCHEL, R. et al. AgNOR quantification with special reference to staining patterns. Zentralbl. Pathol., v.140, p.23-30, 1994.
RÜSCHOFF, J.; PLATE, K.; BITTINGER, A. et al. Nucleolar organizer regions (NORs): basic concepts and practical application in tumor pathology. Pathol. Res. Pract., v.185, p.878, 1989.
SAMPAIO, I.B.S. Estatística aplicada à experimentação animal. Belo Horizonte: Fundação de Ensino e Pesquisa em Medicina Veterinária e Zootecnia, 1998. 221p.
SANTOS, F.G.A.; GUEDES, R.M.C.; CASSALI, G.D. et al. Caracterização e quantificação de regiões organizadoras de nucléolos coradas pela prata (AgNORs) em tumor venéreo transmissível canino, genital e extragenital. Arq. Bras. Med. Vet. Zootec., v.50, p.665-672, 1998.
SANTOS, F.G.A.; VASCONCELOS, A.C.; NUNES, J.E.S. et al. Apoptosis in the transplanted canine transmissible venereal tumor during growth and regression phases. Arq. Bras. Med. Vet. Zootec., v.60, p.607-612, 2008.
SCHMITT, F.C.; FERREIRA, M.P. MIB1 is a suitable marker of proliferative activity in formalin-fixed, paraffin-embedded sections of breast cancer. Int. J. Surg. Pathol., v.2, p.287-294, 1995.
TOIKKANEN, S.; JOENSUU, H. AgNOR counts have no prognostic value in breast cancer. J. Pathol., v.169, p.251-254, 1993.
TRERÈ, D. AgNOR quantification in tumour pathology: What is actually evaluated? J. Clin. Pathol., v.46, p.189, 1993.