Estimating the development of landrace and improved
maize cultivars as a function of air temperature
Estimativa do desenvolvimento de cultivares crioulas e melhoradas de milho em função da temperatura do ar
Josana Andreia LangnerI Nereu Augusto StreckII* Genei Antonio DalmagoIII Lia Rejane Silveira ReinigerII Angelica DurigonII Stefanía Dalmolin da SilvaI
Isabel LagoII Lúcio Gabriel ScheffelII Anderson Haas PoerschII ISSN 1678-4596
ABSTRACT
The objective of this study was to determine the maximum development rates for the phases of emergence, vegetative and reproductive, and to test the performance of the Wang and Engel (WE) model for simulating the development of landrace and improved maize cultivars sown on different
dates. Model calibration was with data collected from a field
experiment with a sowing date on December 13, 2014, and the model was tested with independent data from experiments with
five sowing dates (August 20 and November 4, 2013, February 3 and August 15, 2014, and January 7, 2015) in Santa Maria, RS.
The experiment was a complete randomized block design with
four replicates. The dates of emergence (EM), silking (R1), and physiological maturity (R6) of two landraces (‘Cinquentinha’ and ‘Bico de ouro’) and two improved maize cultivars (‘BRS Planalto’ and ‘AS 1573PRO’) were recorded. Maximum daily developmental
rates varied among cultivars from 0.2400 to 0.3411 d-1 for the
emergence phase, from 0.0213 to 0.0234 d-1 for the vegetative phase, and from 0.0254 to 0.0298 d-1 for the reproductive phase. The WE model adequately estimated the developmental stages
of landraces and improved maize cultivars with a mean error of
3.7 days. The cardinal temperatures used in the WE model were
appropriate to estimate the developmental stages of landraces and improved maize cultivars.
Key words: Zea mays L., modeling, phenology, developmental stages.
RESUMO
O objetivo neste trabalho foi obter as taxas máximas
de desenvolvimento para as fases de emergência, vegetativa e reprodutiva, e testar o desempenho do modelo de Wang e Engel (WE) para estimar o desenvolvimento de cultivares crioulas
e melhoradas de milho em diferentes datas de semeadura. A
calibração foi realizada com dados de um experimento de campo semeado em 13/12/2014, e a validação com dados independentes de
experimentos semeados em 20/08/2013, 04/11/2013, 03/02/2014, 15/08/2014 e 07/01/2015 em Santa Maria, RS. O delineamento foi blocos ao acaso com quatro repetições. Foram registradas as datas de emergência (EM), espigamento (R1) e maturidade fisiológica (R6) de duas cultivares crioulas (‘Cinquentinha’ e ‘Bico de ouro’) e duas melhoradas (‘BRS Planalto’ e ‘AS 1573PRO’). As taxas máximas de desenvolvimento diário diferiram entre as cultivares
variando de 0,2400 a 0,3411 dia-1 para a fase de emergência,
de 0,0213 a 0,0234 dia-1 para a fase vegetativa e de 0,0254 a 0,0298 dia-1 para a fase reprodutiva. O modelo WE estimou adequadamente os estágios de desenvolvimento de cultivares crioulas e melhoradas de milho, com um erro médio de 3,7 dias. As
temperaturas cardinais utilizadas no modelo WE são apropriadas
para estimar os estágios de desenvolvimento de cultivares crioulas
e melhoradas de milho.
Palavras-chave: Zea mays L., modelagem, fenologia, estágios
de desenvolvimento.
INTRODUCTION
Maize (Zea mays L.) cultivars can be
classified as local, traditional, or landrace cultivars
(LTlCs), which are all open-pollinated (OP) varieties, or as improved cultivars, which include hybrid varieties (MORRIS et al., 2003). Landrace cultivars are adapted to local growing conditions through selection exerted by natural biotic and abiotic pressures, as well as by
artificial pressures by farmers (BERG, 2009). Improved
IPrograma de Pós-graduação em Engenharia Agrícola, Universidade Federal de Santa Maria (UFSM), Santa Maria, RS, Brasil.
IIDepartamento de Fitotecnia, Universidade Federal de Santa Maria (UFSM), Av. Roraima, 1000, 97105-900, Santa Maria, RS, Brasil.
E-mail: [email protected]. *Corresponding author.
IIICentro Nacional de Pesquisa de Trigo, Empresa Brasileira de Pesquisa Agropecuária (EMPRAPA), Passo Fundo, RS, Brasil.
cultivars are those that developed in a formal breeding program and marketed under registered names and/or
under intellectual property protection through a patent
system (VIANA, 2011).
Models for estimating crop developmental
stages can be used to assist growers in management practices, such as choosing the best sowing date, and
as an aid for selecting cultivars better adapted to each region (ALBERTO et al., 2009). Crop development depends on the interaction of environmental factors, which are determined by the location and date of sowing, and the genetic variability of the cultivar (JAME & CUTFORTH, 2004).
Air temperature is the main meteorological variable that drives development in maize (STRECK et
al., 2008; 2009). Models based on air temperature can be divided into two groups: linear models, which use
the concept of thermal time or degree days, and non-linear models, such as the Wang and Engel (WE) model (WANG & ENGEL, 1998). The former ones are simpler from an operational point of view, but they assume a linear
relationship between temperature and crop development,
which is not entirely realistic (STRECK et al., 2007). In the WE model, the temperature response function [f(T)] is non-linear and described by a beta function varying from zero to one, with three coefficients which have biological
meaning (lower base, optimal, and upper base cardinal
temperatures) and operational definition (ALBERTO et al., 2009). The f(T) is zero when temperature is lower
base or upper base, and one when temperature is equal to
the optimal temperature (STRECK et al., 2008). The f(T)
is multiplied by the maximum development rate (rmax)
to calculate the daily development rate (STRECK et al.,
2008; 2009).
The phenology of the ‘BRS Missões’, an
improved maize cultivar, was simulated with the linear
(thermal time) and WE (non-linear) models (STRECK et al., 2008) and the WE model simulated better the silking (R1) date and the date of physiological maturity (R6) compared to the thermal time approach (STRECK et al., 2008). However, no reports on the use of the WE model to simulate phenology of landrace maize cultivars were found. The objective of this study was to determine the maximum development rates for the phases of emergence, vegetative and reproductive, and to test the performance of the WE model for simulating the development of landrace and improved maize cultivars sown on different dates.
MATERIALS AND METHODS
Data used in this study were from field
experiments with maize conducted in Santa Maria, Rio
Grande do Sul, Brazil (latitude: 29º 43΄S, longitude: 53º 43΄W, and altitude: 95m) during the 2013/2014
and 2014/2015 growing seasons, with several sowing dates (Table 1). Soil type at the experimental site was
a Rhodic Paleudalf (SOIL SURVEY STAFF, 2010). The climate of the region is humid subtropical, Cfa according to the Köppen’s System, with hot summers
and no dry season.
Soil tillage was with one plowing and two
diskings. Soil was corrected by incorporating limestone to reach a pH of 6.0 (CQFS-RS/SC, 2004). Fertilizer
was applied at sowing at an average rate of 450kg ha-1
of commercial 5-20-20 fertilizer (NPK). Nitrogen was
top dressed at V3 and V8 stages (115kg ha-1 N) using
urea (46% N). Plots were drip irrigated to prevent water stress and weeds were manually controlled.
The experimental design was a complete
randomized block design with four replicates, each replicate consisting of five rows 5m long. Plant
spacing was 0.90m among rows and 0.20m among plants. The two outer rows were used as a border. Two
landrace maize cultivars (‘Cinquentinha’ and ‘Bico de ouro’) and an improved cultivar (‘AS 1573PRO’
hybrid) were used in the 2013/2014 and 2014/2015 growing seasons (Table 1). In the 2014/2015 growing season, the improved open pollinated (OP) cultivar
‘BRS Planalto’ was also used (Table 1).
The date of emergence (EM) was defined when 50% or more of the plants were visible above
the soil. In the plots with landrace cultivars, 45 plants
were tagged with colored wires because of their greater
Table 1 - Sowing dates of maize cultivars ‘Cinquentinha’,‘Bico de ouro’,‘BRS Planalto’,and ‘AS 1573PRO’ in the 2013/2014 and 2014/2015 growing seasons, in Santa Maria, Rio Grande do Sul, Brazil.
Growing season Cultivars Sowing dates ‘Cinquentinha’
‘Bico de ouro’ 2013/2014
‘AS 1573PRO’
08/20/2013, 11/04/2013, 02/03/2014
‘Cinquentinha’ ‘Bico de ouro’ ‘AS 1573PRO’ 2014/2015
‘BRS Planalto’
08/15/2014, 12/13/2014*,
01/07/2015
*Sowing date used to calibrate the WE model; the other sowing
genetic variability, whereas in the plots with improved cultivars, 15 plants were tagged. On the tagged plants,
the timing of the silking stage (R1), when 50% or more of the plants in each plot had stigmas visible on the ear (RITCHIE et al., 1993), and the physiological maturity stage (R6) were determined. The R6 of landrace cultivars was considered when the leaf at the base of the ear was 100% senescent, and for the improved cultivars when the chaff that covered the ear was 100% senescent. These different morphological criteria corresponded to the onset of a dark layer in the kernels. Daily minimum (Tmin) and maximum (Tmax) air temperature data were from an automatic weather station of the Brazilian National Weather Service (INMET) located 100m from the plots.
The developmental cycle of the maize crop was divided into three phases (RITCHIE et al., 1993; STRECK et al., 2008): emergence, from sowing (SE) until emergence (EM); vegetative, from emergence (EM) to silking (R1); and reproductive, from silking (R1) to physiological maturity (R6). It was first calculated the daily rate of development (r). Then, the developmental stage (DS) was obtained by the accumulation of the daily rate of development (DS=∑r). The DS was defined as -1.0 at the time of sowing and 0.0 at the EM, 1.0 at R1, and 2.0 at R6 (COSTA & BARROS, 2001).
The general equations to model the phases
are (WANG& ENGEL, 1998): emergence (SE-EM): r=rmax, e f(T){d
-1}; vegetative (EM-R1): r=r
max,v f(T)
{d-1}; reproductive (R1-R6): r=r
max,f f(T) {d-1}, where
rmax,e, rmax,v, and rmax,r are the maximum rates of daily development (d-1) for the emergence, vegetative, and reproductive phases, respectively. The f(T) was the temperature response function , which varied from zero to one (WANG & ENGEL, 1998) and is
equal to: , when
Tb≤ T ≤ TB, and equal to f(T) = 0 when T < Tb or
T > TB, with: , where Tb,
Tot, and TB were the cardinal temperatures (ºC)
(lower base, optimal, and upper base, respectively)
for maize development, and T was the minimum or maximum daily air temperature (°C). The f(T)
was calculated with the minimum temperature and with the maximum temperature, and the arithmetic
mean of the daily f(T)s was obtained (STRECK et
al., 2008; 2009).
The cardinal temperatures for the emergence phase were Tb = 10.0°C, Tot = 29.3°C, and TB = 40.2°C, and for the vegetative and reproductive phases were Tb = 6.2°C, Tot = 30.8°C, and TB = 42.0°C (SÁNCHEZ et al., 2014). The
rates rmax,e, rmax,v, and rmax,r were genotype dependent
and were estimated for each plot with observed data from the December 13, 2014 sowing date (Table 1). This sowing date was chosen for model calibration because all cultivars completed all stages of
development. Rates were estimated by the minimum
squares approach (ERPEN et al., 2013). The rates were subjected to analysis of variance (ANOVA) and the Tukey’s Test at 5% error. Model evaluation was with independent data from the other five sowing
dates (Table 1) using the statistics Root Mean Square
Error (RMSE), Normalized Root Mean Square Error NRMSE, BIAS index and correlation coefficient (r) (LOAGUE & GREEN, 1991; ERPEN et al., 2013).
RESULTS AND DISCUSSION
The estimates of rmax,e, rmax,v, and rmax,r were
different (Table 2). For the emergence phase, rmax,e was
similar among cultivars, with only the ‘Cinquentinha’ and the ‘AS 1573PRO’ cultivars showing statistical
differences (Table 3). For the vegetative stage, rmax,v
rates were similar for the ‘Cinquentinha’ and ‘BRS Planalto’ cultivars, and the ‘Bico de ouro’ cultivar did not differ from the ‘AS 1573PRO’ cultivar, which in turn did not differ from the ‘BRS Planalto’ cultivar
(Table 3). For the reproductive phase, rmax,r was
similar for the ‘BRS Planalto’ and the ‘AS 1573PRO’ cultivars (Table 3). The ‘BRS Planalto’ cultivar had
the highest rmax,r (0.0298 d-1) and the ‘Bico de ouro’
cultivar had the lowest value (0.0254 d-1). A greater
rmax indicates a shorter period to complete a given developmental phase, whereas a lower rmax indicates a
longer duration of the developmental phase.
In a study conducted with the improved
‘BRS Missões’ maize cultivar (STRECK et
al., 2008), a greater value for rmax,v (0.0254 d
-1)
was reported compared to this study (Table 3),
indicating that the ‘BRS Missões’ is early for
silking. For rmax,r a value of 0.0289 d
-1 was reported (STRECK et al., 2008), which is an intermediate
value compared to the cultivars used here, being
closer to the improved ‘BRS Planalto’ and ‘AS 1573PRO’ cultivars (Table 3).
cultivars that varied from approximately 123 to 154 d. This fact was confirmed by a NRMSE of 5.3% error in the estimate of the developmental stages (Figure 1). Previous studies have used the WE model to simulate the development of other agricultural crops. For example, for winter wheat, STRECK et al. (2003) obtained an RMSE of 3 to 8 d. For Brazilian wheat genotypes, ALBERTO et al. (2009) reported a slightly higher RMSE of up to 12 d. For potatoes, STRECK et al. (2007) obtained an average RMSE of 10.4 d, and for cultivated rice and weedy red rice, the RMSE ranged from 4.3 to 10.9 d with the WE model (STRECK et al., 2011).
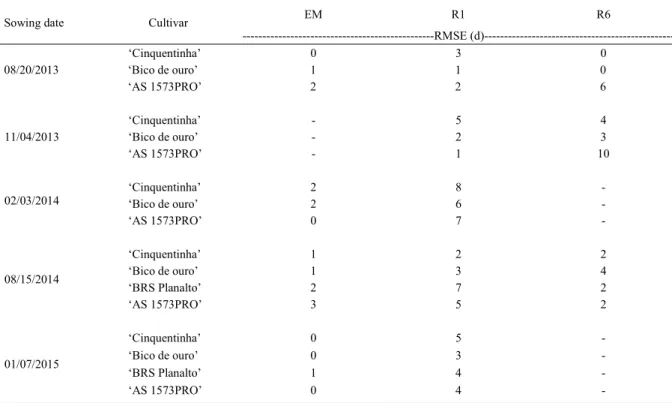
Decomposing the RMSE into cultivars and sowing dates (Table 4), for the EM stage, the RMSE ranged from 0 to 2 d, with greater error (3 d) for the ‘AS 1573PRO’ cultivar in the August 15, 2014 sowing date. For R1, the RMSE was less than or equal to 5 d, except in the February 3, 2014 sowing date for the ‘Cinquentinha’,‘Bico de ouro’, and ‘AS 1573PRO’cultivars, and in August 15, 2014 sowing date for ‘BRS Planalto’, which had
RMSE values varying between 6 and 8 (Table 4). For R6, the RMSE ranged from 0 to 4 d for all cultivars and sowing dates, with the exception of ‘AS 1573PRO’, which had a RMSE equal to 6 d for the August 20, 2013 sowing date and 10 d for the November 4, 2013 sowing date (Table 4). Variations in RMSE values among sowing dates and stages of development were also reported by STRECK et al. (2008) with the improved cultivar ‘BRS Missões’, which had a smaller RMSE for R1 (2.7 d) compared to R6 (4.8 d). Among sowing dates, the largest RMSE for the vegetative phase was 5 d and the largest RMSE for the reproductive phase was 7 d (STRECK et
al., 2008). These values were similar to those reported in the present study (Table 4).
The non-linear WE model was able to estimate the stages of development when the
plants were exposed to near-optimal temperature conditions, within the recommended period,
but also during unfavorable conditions, such as when sowing dates occurred before or after the
Table 2 - Results of the analysis of variance (ANOVA) for rmax,e (day-1), rmax,v (d-1) and rmax,r (d-1) variables.
Source of variance DF SS MS Fc Prob>F
---Variable rmax,e (d-1
)---Model 3 2.3 x 10⁻² 7.6 x 10⁻³
Residual 12 2.1 x 10⁻² 1.7 x 10⁻³ 4.414 0.0260
---Variable rmax,v (d-1
)---Model 3 1 x 10⁻⁵ 3 x 10⁻⁶
Residual 12 3 x 10⁻⁶ 2.7 x 10⁻⁸ 12.086 0.0006
---Variable rmax,r (d1
)---Model 3 4.6 x 10⁻⁶ 1.5 x 10⁻⁵
Residual 12 1.4 x 10⁻⁶ 1 x 10⁻⁶ 12.879 0.0005
DF = Degrees of Freedom; SS = Sum of squares; MS = Mean square; rmax,e = maximum daily development for the emergence phase; rmax,v =
maximum daily development for the vegetative phase; rmax,r = maximum daily development for the reproductive phase.
Table 3 - Maximum rate of development coefficients for sowing to emergence stage (rmax,e), emergence to silking stage (rmax,v) and silking
to physiological maturity stage (rmax,r) of ‘Cinquentinha’, ‘Bico de ouro’, ‘BRS Planalto’, and ‘AS 1573PRO’ maize cultivars.
The values in parentheses are one standard deviation of the mean.
Cultivar rmax, e(d-1) rmax, v(d-1) rmax, r(d1)
‘Cinquentinha’ 0.2400 (± 0.0147) b 0.0234 (± 0.0005) a 0.0264 (± 0.0014) bc ‘Bico de ouro’ 0.2723 (± 0.0287) ab 0.0213 (± 0.0004) c 0.0254 (± 0.0004) c ‘BRS Planalto’ 0.3067 (± 0.0572) ab 0.0229 (± 0.0006) ab 0.0298 (± 0.0010) a ‘AS 1573PRO’ 0.3411 (± 0.0506) a 0.0223 (± 0.0006) bc 0.0282 (± 0.0012) ab
CV (%) 14.3 2.31 3.96
*Means followed by at least one letter in the column do not differ from each other by the Tukey’s Test at 5% probability; CV = coefficient
recommended period according to the agricultural
zoning of maize for the state of Rio Grande do Sul. The choice of a simulation model is based on a number of factors that include ease of obtaining
input data, simplicity in obtaining maximum
rates of development, and practical applications. The WE model fulfills these requirements as a tool that can be used in the scientific arena as well as for assisting farmers and extensionists to
improve management practices related to each
stage of maize development.
CONCLUSION
The maximum rmax,e, rmax,v, and rmax,r rates
of daily development differ among maize cultivars depending on the length of the developmental cycle.
The Wang and Engel model, based on air temperature, is suitable for estimating the development of landraceand improved maize varieties. The cardinal temperatures used in the WE model were appropriate for estimating the stages of development of landrace
and improved maize cultivars.
Figure 1 - Days after sowing (DAS) estimated (by the Wang and Engel model) and observed for emergence (EM), silking (R1), and physiological maturity (R6), for the ‘Cinquentinha’, ‘Bico de ouro’, and ‘AS 1573PRO’ cultivars, for sowing dates 08/20/2013, 11/04/2013, 02/03/2014, 08/15/2014, and 01/07/2015, and for ‘BRS Planalto’ on the sowing dates 08/15/2014 and 01/07/2015, in Santa Maria, Rio Grande do Sul, Brazil. RMSE: Root Mean Square Error, NRMSE: Normalized Root Mean Square Error, r: Correlation Coefficient, BIAS: Bias index.
Table 4 - Root Mean Square Error (RMSE) of the simulation of emergence (EM), silking (R1), and physiological maturity (R6) of ‘Cinquentinha’, ‘Bico de ouro’, ‘BRS Planalto’, and ‘AS 1573PRO’ maize cultivars using the Wang and Engel model on five sowing dates in Santa Maria, Rio Grande do Sul, Brazil.
EM R1 R6
Sowing date Cultivar
---RMSE
(d)---‘Cinquentinha’ 0 3 0
‘Bico de ouro’ 1 1 0
08/20/2013
‘AS 1573PRO’ 2 2 6
‘Cinquentinha’ - 5 4
‘Bico de ouro’ - 2 3
11/04/2013
‘AS 1573PRO’ - 1 10
‘Cinquentinha’ 2 8
-‘Bico de ouro’ 2 6
-02/03/2014
‘AS 1573PRO’ 0 7
-‘Cinquentinha’ 1 2 2
‘Bico de ouro’ 1 3 4
‘BRS Planalto’ 2 7 2
08/15/2014
‘AS 1573PRO’ 3 5 2
‘Cinquentinha’ 0 5
-‘Bico de ouro’ 0 3
-‘BRS Planalto’ 1 4
-01/07/2015
‘AS 1573PRO’ 0 4
ACKNOWLEDGEMENTS
To Conselho Nacional de Desenvolvimento Cientifico e Tecnológico (CNPq) for scholarships (Proc. N 832493/1999-6).
REFERENCES
ALBERTO, C.M. et al. Modeling wheat development considering different cardinal temperatures and methods for the temperature response function calculation. Pesquisa Agropecuária Brasileira, v.44, n.6, p.545-553, 2009. Available from: <http://www.scielo. br/pdf/pab/v44n6/a01v44n6.pdf>. Accessed: Jul. 01, 2015. doi: 10.1590/S0100-204X2009000600001.
BERG, T. Landraces and folk varieties: a conceptual reappraisal of terminology. Euphytica, v.166, n.3, p.423-430, 2009. Available from: <http://link.springer.com/article/10.1007/ s10681-008-9829-8#close>. Accessed: Jul. 01, 2015. doi: 10.1007/s10681-008-9829-8.
CQFS-RS/SC (COMISSÃO DE QUÍMICA E DE FERTILIDADE DO SOLO). Manual de adubação e de calagem para os estados do Rio Grande do Sul e de Santa Catarina. 10.ed. Porto Alegre: SBCS/NRS, 2004. 400p.
COSTA, L.C.; BARROS, A.H.C. Development and testing of a growth simulation model development and yield of maize. Revista Brasileira de Agrometeorologia, v.9, p.75-82, 2001.
ERPEN, L.et al. Estimating cardinal temperatures and modeling the vegetative development of sweet potato. Revista Brasileira de Engenharia Agrícola e Ambiental, v.17, n.11, p.1230-1238, 2013. Available from: <http://www.scielo.br/ pdf/rbeaa/v17n11/v17n11a15.pdf>. Accessed: Jul. 01, 2015. doi: 10.1590/S1415-43662013001100015.
LOAGUE, K.; GREEN, R. E. Statistical and graphical methods for evaluating solute transport models: Overview and application. Journal of Contaminant Hydrology, v.7, p.51-73, 1991. Available from: <http://www.sciencedirect.com/science/ article/pii/0169772291900383>. Accessed: Jul. 01, 2015. doi: 10.1016/0169-7722(91)90038-3.
MORRIS, M. et al. Impacts of CIMMYT maize breeding research. In: In: EVENSON, R.E.; GULLIN, D. Crop Variety Improvement and Its Effect on Productivity: The Impact of International Agricultural Research, Eds: R.N. CABI Publishing, USA. 2003. Cap.8, p.135-158.
RITCHIE, S.W. et al. How a corn plant develops. Ames: Iowa State University of Science and Technology, 1993. 21p. (Special Report, 48).
SÁNCHEZ, B. et al. Temperatures and the growth and development of maize and rice: a review. Global Change Biology, v.20, p.408-417, 2014. Available from: <http:// onlinelibrary.wiley.com/doi/10.1111/gcb.12389/pdf>.Accessed: July. 01, 2015.doi: 10.1111/gcb.12389.
STRECK, N.A. et al. Improving predictions of developmental stages in winter wheat: a modified Wang and Engel model. Agricultural and Forest Meteorology, v.115, p.139-150, 2003. Available from: <http://www.sciencedirect.com/science/ article/pii/S0168192302002289>. Accessed: July. 01, 2015.doi: 10.1016/S0168-1923(02)00228-9.
STRECK, N.A. et al. Simulating the development of field grown potato (Solanumtuberosum L.). Agriculturaland Forest Meteorology, v.142, p.1-11, 2007. Available from: <http://www. sciencedirect.com/science/article/pii/S0168192306002826>. Accessed: July 01, 2015. doi: 10.1016/j.agrformet.2006.09.012.
STRECK, N.A. et al. Simulating maize phenology as a function of air temperature with a linear and a nonlinear model. Pesquisa Agropecuária Brasileira, v.43, n.4, p.449-455, 2008. Available from: <http://www.scielo.br/pdf/pab/v43n4/ a02v43n4.pdf>. Accessed: Ago. 01, 2015. doi: 10.1590/S0100-204X2008000400002.
STRECK, N.A. et al. Comparing two versions of a non-linear model for simulating leaf number and developmental stages in maize based on air temperature. Ciência Rural, v.39, p.642-648, 2009. Available from: <http://www.scielo.br/pdf/cr/ v39n3/a89cr787.pdf>. Accessed: Ago. 01, 2015. doi: 10.1590/ S0103-84782008005000089.
STRECK, N.A. et al. Modeling the development of cultivated rice and weedy red rice. Transactions of the ASAE, v.54, p.371-384, 2011. Available from:<https://elibrary.asabe.org/toc_journals.asp ?volume=54&issue=1&conf=t&confalias=t2&orgconf=t2011>. Accessed: Ago. 01, 2015. doi: 10.13031/2013.36234.
SOIL SURVEY STAFF. Keys to Soil Taxonomy. Natural resources conservation service. 11.ed. Washington, 2010. 338p.
VIANA, A.A.N. A proteção de cultivares no contexto da ordem econômica mundial. In: BRASIL. Ministério da Agricultura, Pecuária e Abastecimento. Proteção de Cultivares no Brasil/ Ministério da Agricultura, Pecuária e Abastecimento. Secretaria de Desenvolvimento Agropecuário e Cooperativismo. Brasília: Mapa/ACS, 2011.202p.