A.J. Zanon et al.
AbstrAct: There was a change in the genetics of soybeans grown in southern Brazil from the 2000s, which requires investment in basic and detailed studies about growth and development. The purpose in this paper was to characterize the overlap period of vegetative and reproductive phases, growth in height and the emission of nodes after the beginning of flowering in determinate and indeterminate cultivars in different sowing dates and soybean regions in Rio Grande do Sul. Field experiments were conducted during the growing seasons of 2012/2013 and 2013/2014, in Santa Maria, Itaqui, Frederico Westphalen, Capão do Leão, Júlio de Castilhos and in 3 commercial soybean crops in Restinga Sêca,
crop production And MAnAgeMent -
Article
Growth habit effect on development of modern
soybean cultivars after beginning of bloom in
Rio Grande do Sul
Alencar Junior Zanon1, Nereu Augusto Streck1*, Thiago Schmitz Marques da Rocha1, Cleber Maus Alberto2,
Alex Cristiano Bartz2, Gizelli Moiano de Paula3, Regina Tomiozzo3, Liege Camargo da Costa4, Cesar Augusto
Fensterseifer1, Eduardo Lago Tagliapietra1, Ânthony Paz Cardoso1, Patric Scolari Weber1, Kelin Pribs Bexaira1
1. Universidade Federal de Santa Maria - Departamento de Fitotecnia - Centro de Ciências Rurais - Santa Maria (RS), Brazil. 2. Universidade Federal do Pampa - Departamento de Agronomia - Itaqui (RS), Brazil.
3. Universidade Federal de Santa Maria - Frederico Westphalen (RS), Brazil. 4. Fundação Estadual de Pesquisa Agropecuária - Júlio de Castilhos (RS), Brazil.
*Corresponding author: [email protected] Received: Nov. 6, 2015 – Accepted: Mar. 28, 2016
Tupanciretã and Água Santa. Overlap determination (in days) of vegetative and reproductive phases, difference in the number of nodes and height in R8 and R1 were estimated. The cultivars with indeterminate growth had higher overlap period of vegetative and reproductive phases, height growth and emission of nodes after the beginning of flowering in comparison with the determinate cultivars. The magnitude of the overlap values of vegetative and reproductive phases and of the increase in height and number of nodes after R1 ranged with the type of growth, maturity group, location, and sowing date.
introduction
In southern Brazil, the use of soybean cultivars with indeterminate growth habit and maturity group (MG) between 4.5 and 6.5 has increased since 2000 (Zanon et al. 2015b). In Rio Grande do Sul (RS) State, this new group of cultivars represented more than 90% of the area cultivated with soybeans in the last 5 growing seasons and allowed many farmers to anticipate (September and early October) or delay (January and early February) the sowing date (EMATER 2015). These changes in soybean genetics and sowing date demand investment in basic and detailed studies on growth and development so that management practices can be adapted to the new cultivars. The overl ap of veget at ive and repro duc t ive developmental phases in soybean is an important variable since a longer overlapping period means more competition for photoassimilates between vegetative (leaves and stems) and reproductive (pods and seeds) structures (Setiyono et al. 2011). The overlapping period is influenced by temperature and photoperiod and is associated with soybean growth habit, which is defined as the time of termination of the main stem growth after the beginning bloom (R1) developmental stage (Bernard 1972).
Bernard et al. (1998) accessed the soybean germplasm bank of the United States Department of Agriculture (USDA) and classified the cultivars from “1” (very determinate) to “5” (very indeterminate) according to the period after which the plants cease to grow vegetatively, after the R1 stage. Cultivars with values lower than 2.0 were classified as determinate, i.e. they showed none or a slight growth in stem height after the R1 stage. Cultivars with values between 2.0 and 2.5 were classified as semi-determinate and those with values ≥ 2.5 were classified as indeterminate since the stem elongation and node appearance continue after the R1 stage until nearly the grain filling stage. However, when soybean cultivars are sown before or after the recommended period, the duration of the overlapping period varies with weather conditions during the development cycle, which may change the growth habits (Bernard 1972; Heatherly and Smith 2004).
A limited number of environments and genotypes were studied by comparing different growth habits, and most of the observations resulted from experiments conducted outside Brazil during the 1970s, 1980s and 1990s (Fehr
et al. 1971; Bernard 1972; Bernard et al. 1998; Ashlock and Purcell 2000). However, new soybean cultivars are released annually, and farmers in southern Brazil are currently using cultivars with indeterminate growth habit and MG less than 6.5 in different production systems. Therefore, it is worthy to resume studies to characterize the duration of the overlapping period node appearance, and stem height growth after R1. This information can assist agronomists and farmers in choosing the most appropriate sowing date, cultivars (MG), row spacing, seeding density and other management practices to exploit the genetic potential of each cultivar.
The objective of this study is to determine the duration of the overlapping period between vegetative and reproductive phases, the growth in plant height and the node appearance after the beginning bloom stage in determinate and indeterminate soybean cultivars in different sowing dates and locations across the RS State.
MAteriAL And MetHods
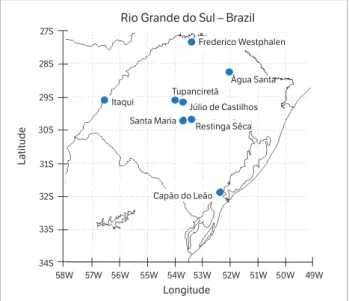
Field experiments were conducted during 2 growing seasons (2012/2013 and 2013/2014) in 8 locations where soybean is predominantly grown in RS (Figure 1). The experimental sites were located at the Universidade Federal de Santa Maria (Santa Maria and Frederico Westphalen), Universidade Federal de Pelotas (Capão do
Figure 1. Map of the State of Rio Grande do Sul, Brazil. Solid circles indicate experimental sites, during the 2012/2013 and 2013/2014 growing seasons.
Rio Grande do Sul – Brazil
Longitude
Latitude
Frederico Westphalen
Água Santa
Restinga Sêca
Capão do Leão Santa Maria Itaqui 27S
28S
29S
30S
31S
32S
33S
34S
58W 57W 56W 55W 54W 53W 52W 51W 50W 49W Tupanciretã
Leão), Universidade Federal do Pampa (Itaqui), Fundação Estadual de Pesquisa Agropecuária - FEPAGRO Sementes (Júlio de Castilhos), and 3 commercial soybean fields located at the counties of Restinga Sêca, Tupanciretã, and Água Santa. The climate in RS is subtropical humid with hot summers and no dry season. Five types of soils were observed in the experimental sites, from very deep, over 2.50 m, up to shallow, less than 1.0 m. In southern and western RS, the experiments were conducted in areas traditionally cultivated with rice (lowlands), where most soils have low water storage capacity and low hydraulic conductivity, compared with those of the highlands in northern RS (Streck et al. 2008).
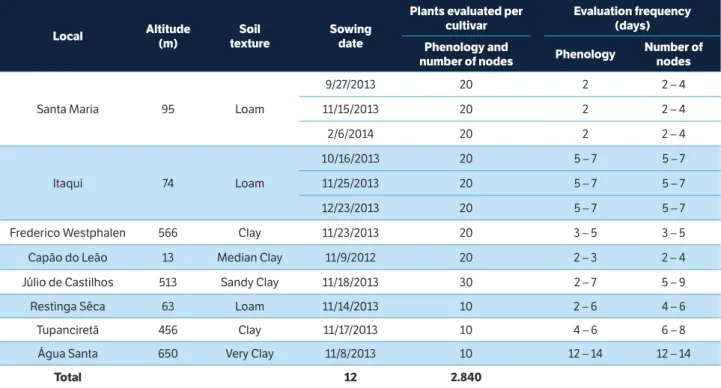
The soybean cultivars were selected due to the different growth habits, and the range of relative maturity represent all the MGs currently cultivated in RS (Table 1). In Santa Maria, sowings were conducted before (September), during (November) and after (February), the recommended soybean sowing date in RS. In Itaqui, sowings occurred before (October and November) and during (December) the recommended period; in all other places, sowings were conducted during the recommended period, totaling 12 sowing dates (Table 2). The fertilization, inoculation of seeds with Bradyrhizobium japonicum, treatment
of seeds with fungicides and insecticides, as well as control of weeds, pests and diseases were performed according to the technical recommendations for the crop. In Santa Maria, the experiments were irrigated so that the plants developed without water deficit. In the other areas, the experiments were conducted under rainfed conditions, which represent most soybean farms in RS. Experiments in Santa Maria, Itaqui, Capão do Leão and Frederico Westphalen were conducted in a completely randomized blocks design, with 4 replications. Each block had 17 rows, with 2 border rows on each side. Each 3-m-long row contained 1 cultivar. In Júlio de Castilhos, the experiment had 3 replications, and the plots had four 5-m-long rows of each cultivar. In the commercial soybean fields (Restinga Sêca, Tupanciretã, and Água Santa), the experiments were conducted as demonstrative plots (without repetition), and each plot consisted of four 3-m-long rows of each cultivar. In all experiments, the row spacing used was 0.45 m, with
30 plants∙m−2, which represents the row spacing and
density used in most soybean farms in RS (EMATER 2015). The emergence was defined when the cotyledons of 50% of the plants were above the soil surface. Shortly after the appearance of the first pair of unifoliate leaves, the plants used to assess the number of nodes (NN), phenology, and plant height (H) were marked with colored wire. The date of the final number of nodes was set when no new nodes appeared on the main stem. The evaluations for identifying reproductive stages, R1; R3; R4; R5; R6; R7, and R8, followed the scale of Fehr et al. (1971). Table 2 shows detailed information about the experimental protocol.
The duration, in days, of the emergence phase to the beginning bloom (R1), emergence of the final number of nodes, beginning bloom to maturity (R8), and the total cycle were determined. Stem height (distance from the ground to the growth apex, in cm) was measured in R1 and R8 stages. Statistical analysis was performed for the overlapping period (OP), in days, and for the difference in NN and stem height observed in R1 and R8 stages. Data analysis was performed for each sowing date in all sites, according to Heatherly and Smith (2004). The means were compared by Tukey’s test (p < 0.05). Contrast analysis was performed to compare cultivars with different growth habits. Because the commercial soybean fields had no replications, only the means of the variables for table 1. Soybean cultivars, maturity group and growth habits used
in the experiments in Santa Maria, Itaqui, Frederico Westphalen, Capão do Leão, Júlio de Castilhos, Restinga Sêca, Tupanciretã and Água Santa, Rio Grande do Sul.
cultivars Mg growth habit
NS 4725 RR* 4.7 Indeterminate NS 4823 RR 4.8 Indeterminate TMG 7161 RR Inox 5.4 Indeterminate BMX Energia RR 5.5 Indeterminate
TEC 5936IPRO 5.5 Indeterminate BMX Turbo RR 6.0 Indeterminate NS 6262 RR** 6.2 Indeterminate NA 5909 RR 6.3 Indeterminate
IAS 5 6.4 Determinate
Igra RA 518 RR 6.6 Indeterminate BMX Potência RR 6.7 Indeterminate
Fepagro 36 RR 7.2 Determinate
BRS 246 RR 7.2 Determinate
Bragg 7.3 Determinate
CD 219 RR 8.2 Determinate
each cultivar were analyzed. All statistical analyzes were performed using the SAS statistical software.
resuLts And discussion
Weather characterization
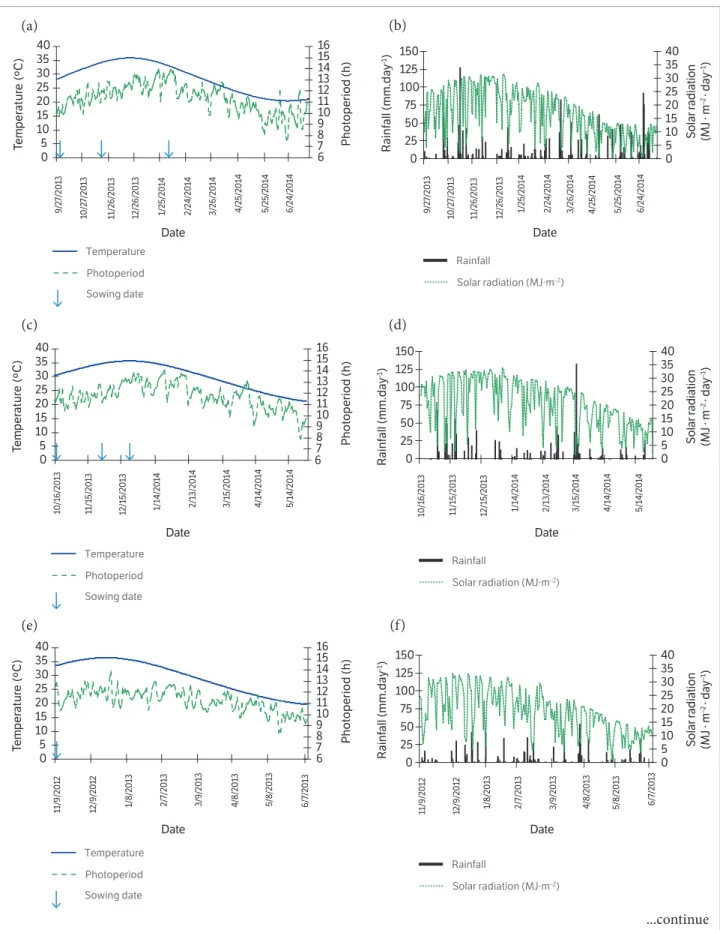
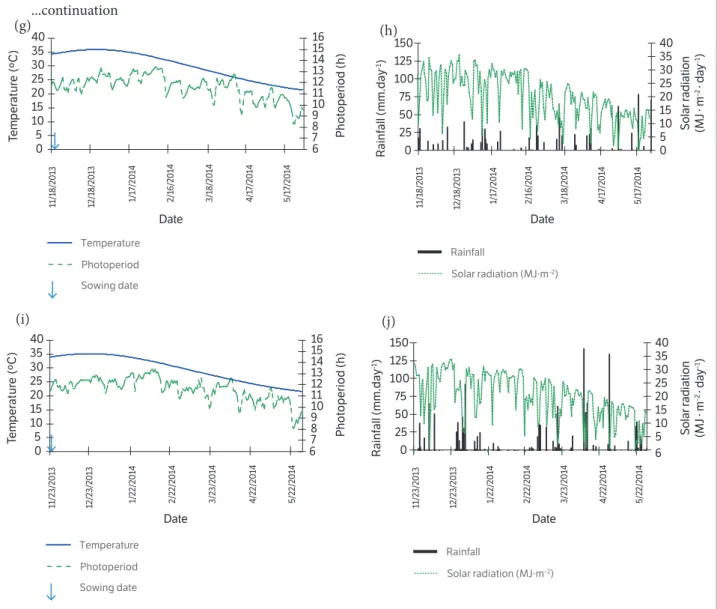
The weather throughout the soybean development cycle in the 8 locations and 12 sowing dates represented almost all the situations that may occur in commercial soybean fields in RS (Figure 2). In most sites and sowing dates, mean daily temperature, photoperiod, and solar radiation increased at the beginning and decreased in the rest of the developmental cycle. These facts indicate that sowings were performed before and during the sowing window in RS. The sowings in Itaqui and Santa Maria occurred on 12/23/2013 and 2/6/2014, respectively, and the weather variables decreased throughout the growing season in these 2 places, indicating that the sowings were performed after the recommended period. The variation of the availability of meteorological variables as a function of sowing date and local changed the overlapping period, stem height, and number of nodes after R1 between growth habits and MG (Figures 3,4,5,6).
Experiments with irrigation
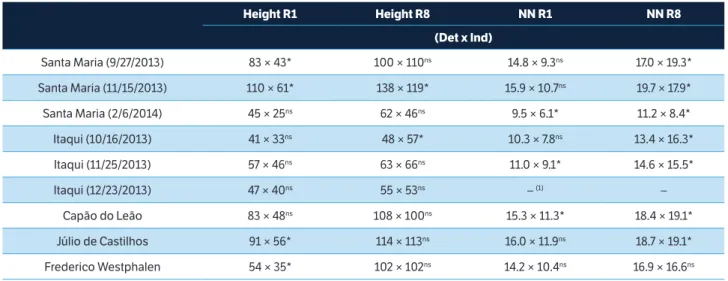
Stem height and NN in R1 was higher for determinate soybean cultivars (Table 3). Similarly, Heatherly and Smith (2004) and Zanon et al. (2015a) reported that determinate cultivars have higher growth rate up to the R1 stage while the indeterminate ones have slower initial growth, which ceases only at the beginning of grain filling. The stem height at R8 was not significantly different between growth habits, except for November sowing, when determinate cultivars were taller. This result demonstrates the soybean breeding in the last 15 years, as the cultivars with indeterminate growth habit, which currently represent the majority of the cultivars sowed in southern Brazil, were inexpressive in soybean farms until the 2000s. The increased height of these plants caused lodging and, consequently, reduced productivity (Mundstock and Thomas 2005). The lower NN at R8 for determinate cultivars sown in September is associated with their growth habit, i.e. the short photoperiod in late September and early October induced early flowering and ceased the appearance of nodes a few days after R1. On the other hand, the indeterminate cultivars continued to produce nodes up to the beginning of grain filling, Local Altitude
(m)
soil texture
sowing date
plants evaluated per cultivar
evaluation frequency (days)
phenology and
number of nodes phenology
number of nodes
Santa Maria 95 Loam
9/27/2013 20 2 2 – 4
11/15/2013 20 2 2 – 4
2/6/2014 20 2 2 – 4
Itaqui 74 Loam
10/16/2013 20 5 – 7 5 – 7
11/25/2013 20 5 – 7 5 – 7
12/23/2013 20 5 – 7 5 – 7
Frederico Westphalen 566 Clay 11/23/2013 20 3 – 5 3 – 5
Capão do Leão 13 Median Clay 11/9/2012 20 2 – 3 2 – 4
Júlio de Castilhos 513 Sandy Clay 11/18/2013 30 2 – 7 5 – 9
Restinga Sêca 63 Loam 11/14/2013 10 2 – 6 4 – 6
Tupanciretã 456 Clay 11/17/2013 10 4 – 6 6 – 8
Água Santa 650 Very Clay 11/8/2013 10 12 – 14 12 – 14
total 12 2.840
Figure 2. Mean daily air temperature (°C), photoperiod (h∙d-1), rainfall (mm∙d−1) and solar radiation (MJ∙m−²∙d−1) during the experiments in Santa Maria (a, b), Itaqui (c, d), Capão do Leão (e, f), Júlio de Castilhos (g, h) and Frederico Westphalen (i, j).
6 7 8 9 10 11 12 13 14 15 16
0 5 10 15 20 25 30 35 40
Photoperiod (h)
Te
m
per
a
tur
e
(
º
C
)
11/9/2012 12/9/2012 1/8/2013 2/7/2013 3/9/2013 4/8/2013 5/8/2013 6/7/2013 11/9/2012 12/9/2012 1/8/2013 2/7/2013 3/9/2013 4/8/2013 5/8/2013 6/7/2013
Temperature
Photoperiod
Sowing date
6 7 8 9 10 11 12 13 14 15 16
0 5 10 15 20 25 30 35 40
Photoperiod (h)
Te
m
per
a
tur
e
(
º
C
)
10/16/2013 11/15/2013 12/15/2013 1/14/2014 2/13/2014 3/15/2014 4/14/2014 5/14/2014 10/16/2013 11/15/2013 12/15/2013 1/14/2014 2/13/2014 3/15/2014 4/14/2014 5/14/2014
Temperature
Photoperiod
Sowing date
6 7 8 9 10 11 12 13 14 15 16
0 5 10 15 20 25 30 35 40
Photoperiod (h)
Te
m
per
a
tur
e
(
º
C
)
9/27/2013
10/27/2013 11/26/2013 12/26/2013 1/25/2014 2/24/2014 3/26/2014 4/25/2014 5/25/2014 6/24/2014 9/27/2013 10/27/2013 11/26/2013 12/26/2013 1/25/2014 2/24/2014 3/26/2014 4/25/2014 5/25/2014 6/24/2014
Temperature
Photoperiod
Sowing date
Rainfall
Solar radiation (MJ·m–2)
0 5 10 15 20 25 30 35 40
0 25 50 75 100 125 150
Solar radiation (MJ ·
m
–2
· day
–1)
Rainfall (mm.day
-1)
Rainfall
Solar radiation (MJ·m–2)
0 5 10 15 20 25 30 35 40
0 25 50 75 100 125 150
Solar radiation (MJ ·
m
–2
· day
–1)
Rainfall (mm.day
-1)
Rainfall
Solar radiation (MJ·m–2)
0 5 10 15 20 25 30 35 40
0 25 50 75 100 125 150
Solar radiation (MJ ·
m
–2
· day
–1)
Rainfall (mm.day
-1)
Date Date
Date Date
Date Date
...continue
(a) (b)
(c) (d)
...continuation
Figure 2. Mean daily air temperature (°C), photoperiod (h∙d-1), rainfall (mm∙d−1) and solar radiation (MJ∙m−²∙d−1) during the experiments in Santa Maria (a, b), Itaqui (c, d), Capão do Leão (e, f), Júlio de Castilhos (g, h) and Frederico Westphalen (i, j).
Photoperiod (h)
67 8 910 11 12 13 14 15 16
0 5 10 15 20 25 30 35 40
Photoperiod (h)
Te
m
per
a
tur
e
(
º
C
)
11/23/2013 12/23/2013 1/22/2014 2/22/2014 3/23/2014 4/22/2014 5/22/2014
6
11/23/2013 12/23/2013 1/22/2014 2/22/2014 3/23/2014 4/22/2014 5/22/2014
Temperature
Photoperiod
Sowing date
6 7 8 9 10 11 12 13 14 15 16
0 5 10 15 20 25 30 35 40
Te
m
per
a
tur
e
(
º
C
)
4/17/2014
3/18/2014
2/16/2014
1/17/2014
12/18/2013
11/18/2013 5/17/2014 11/18/2013 12/18/2013 1/17/2014 2/16/2014 3/18/2014 4/17/2014 5/17/2014
Temperature
Photoperiod
Sowing date
Rainfall
Solar radiation (MJ·m–2)
0 5 10 15 20 25 30 35 40
0 25 50 75 100 125 150
Rainfall (mm.day
-1)
Rainfall
Solar radiation (MJ·m–2)
5 10 15 20 25 30 35 40
0 25 50 75 100 125 150
Solar radiation (MJ ·
m
–2 · day –1)
Rainfall (mm.day
-1)
Solar radiation (MJ ·
m
–2
· day
–1)
Date Date
Date Date
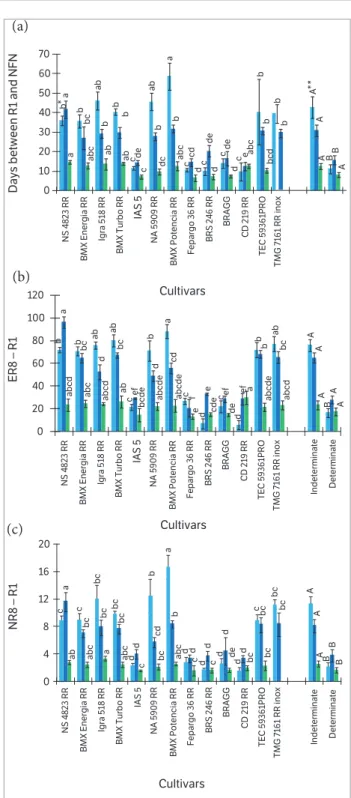
although they also had been induced to flowering (Zanon et al. 2015b).
The overlapping period, stem height, and NN between R1 and R8 were higher on average for cultivars with indeterminate compared to determinate growth. However, the values decreased for delayed sowing date in indeterminate cultivars and remained almost unchanged in determinate cultivars (Figure 3). Stem height, number of nodes, and overlapping period in most determinate cultivars differed from the first studies on soybean growth habits (Egli and Leggett 1973), when vegetative growth ceased after R1. Thus, further studies are necessary to understand and reclassify, according to growth habit, the cultivars currently sown by farmers in southern Brazil.
Furthermore, it is suggested that cultivars currently classified as determinate should be reclassified as semi-determinate growth.
Stem height after R1 in indeterminate and determinate cultivars varied, on average, from 122 to 481% and 4 to 40%, for September sowing, from 58 to 370% and 18 to 33%, for November sowing, and from 57 to 129% and 34 to 49%, for February sowing, respectively. The increase in NN after R1 for September, November, and February sowings varied from 8 to 26%; 19 to 31% and 17 to 21%, in determinate cultivars, and from 79 to 163%; 43 to 170%, and 23 to 52% in indeterminate cultivars, respectively. This wide variation in growth and development after R1 up to the appearance of the (g)
(i) (j)
Figure 3. (a) Overlap, in days, between beginning bloom (R1) and final number of nodes (FNN); (b) Stem height difference, in cm, between R8 and R1 (E R8 − R1); (c) NN difference between R8 and R1 (N R8 − R1) for soybean cultivars sown on 27/09/2013, 15/11/2013 and 6/2/2014 in Santa Maria, RS.
**Means followed by the same uppercase letters do not differ by contrast
analysis at 5%
*Means followed by the same lowercase letters (comparison between cultivars sowed on the same date) do not differ by Tukey’s test 0 10 20 30 40 50 60 70 ab b A B c b c b b ab a b c c c b bc A B de b de b b b b a
cd de e
ab abc A A c ab d bcd abc abc dc a d d 0 20 40 60 80 100 120 ab b A B c ab d b ab b a b c c d d bc A A ef bc e b bc d cd a
f ef ef
abcd abc A A bcde ab cde abcde a abcde abcde abcd e de abcd 0 4 8 12
NR8 – R1
NS 4823 RR
BMX Energia RR
Igra 518 RR
BMX Turbo RR
IAS 5
NA 5909 RR
BMX Potencia RR
Fepargo 36 RR
BRS 246 RR
BRAGG
CD 219 RR
TEC 59361PRO
TMG 7161 RR inox
NS 4823 RR
BMX Energia RR
Igra 518 RR
BMX Turbo RR
NA 5909 RR
BMX Potencia RR
Fepargo 36 RR
BRS 246 RR
BRAGG
CD 219 RR
TEC 59361PRO
TMG 7161 RR inox
16 20
Cultivars Cultivars Cultivars
ER8 – R1
IAS 5
NS 4823 RR
BMX Energia RR
Igra 518 RR
BMX Turbo RR
NA 5909 RR
BMX Potencia RR
Fepargo 36 RR
BRS 246 RR
BRAGG
CD 219 RR
TEC 59361PRO
TMG 7161 RR inox
Indeterminate Determinate
Indeterminate Determinate
IAS 5
Days between R1 and NFN
bc c A B d bc d c bc b a c d d d de bc bc A B d bc d bc bc cd b a d d d a abc A B c abc
c bc bc
abc
bc
ab c
*
**
last node is associated with the MG range (4.7 to 8.2), sowing season date (September to February), and growth habits. From these results, it is clear that management practices need to be adapted to the cultivar growth habit, MG, and depend on the sowing date.
Previous studies at higher (38°N; Egli and Leggett 1973) and similar (33°N; Heatherly and Smith 2004) latitudes showed that determinate cultivars reached more than 70% of the final height and 80% of the NN, while indeterminate cultivars reached less than 50% of the final height and 60% of the final NN, at R1, respectively. These results are different from ours in RS climate conditions, indicating the complex genotype versus environment interaction for soybean. Therefore, agronomists and farmers should be very careful when extrapolating results of studies conducted in other locations to decide about the best management practices for their crops.
Experiments under rainfed conditions
Plant height and NN at R1 were higher for determinate cultivars, following the same trend of the results in Santa Maria (irrigated experiments). NN at R8 was higher for indeterminate cultivars, except in Frederico Westphalen. Height at R8 did not differ for growth habits, except for October sowing in Itaqui, where the indeterminate cultivars were taller (Table 3).
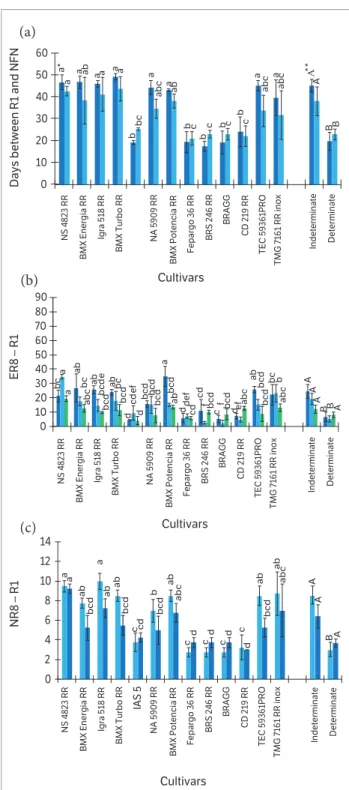
Indeterminate cultivars showed, on average, longer overlapping, higher stem growth for October and November sowings, and higher NN for October sowing, in Itaqui (Figure 4). The overlapping period ranged from 18 to 24% and 40 to 49%, for October sowing, from 21 to 25% and 32 to 44%, for November sowing, for determinate and indeterminate cultivars, respectively. The height difference between R8 and R1 ranged from 11 to 22% and 49 to 109%, for October sowing, from 3 to 20% and 29 to 114%, for November sowing, from 9 to 28% and 19 to 68%, for December sowing, for determinate and indeterminate cultivars, respectively. On the other hand, the difference between NN in R8 and R1, in determinate and indeterminate cultivars, ranged from 23 to 49% and 82 to 212%, for October sowing, and from 25 to 39% and 48 to 151%, for November sowing, for determinate and indeterminate cultivars, respectively. There were no significant differences between determinate and indeterminate cultivars within the same sowing date for the overlapping period, stem height, and number of nodes after the R1 stage.
(a)
(b)
In Itaqui, the rainfall between sowing date and R7 was 753, 726, and 741 mm for the October, November, and December sowing dates, respectively. It is hypothesized that the water shortage periods that occurred during the developmental cycle — resulted from low water storage capacity of the soil and the small soil volume explored by the roots (< 0.5 m) — explain the small and no difference, in absolute values, of variables between cultivars of different and same growth habit, respectively, compared to the experiments in Santa Maria. The low hydraulic conductivity associated with high rainfall in early November and mid-March (Figure 2d) caused stress in plants by excess water in the soil. When the sowing was performed in the recommended season, indeterminate cultivars had longer overlapping period, higher NN after R1 in Capão do Leão and Júlio de Castilhos, and higher stem growth after R1 in Júlio de Castilhos (Figure 5). The cultivar NS 4823 RR of MG 4.8 had the longest overlapping period as well as the largest increase in NN and height after R1, compared with other indeterminate and determinate cultivars.
Experiments in commercial soybean farms
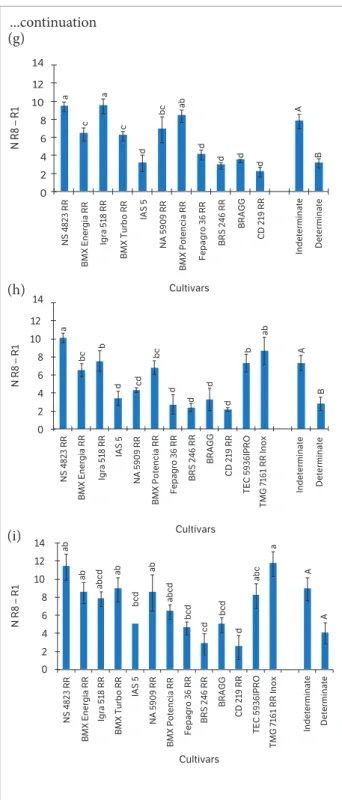
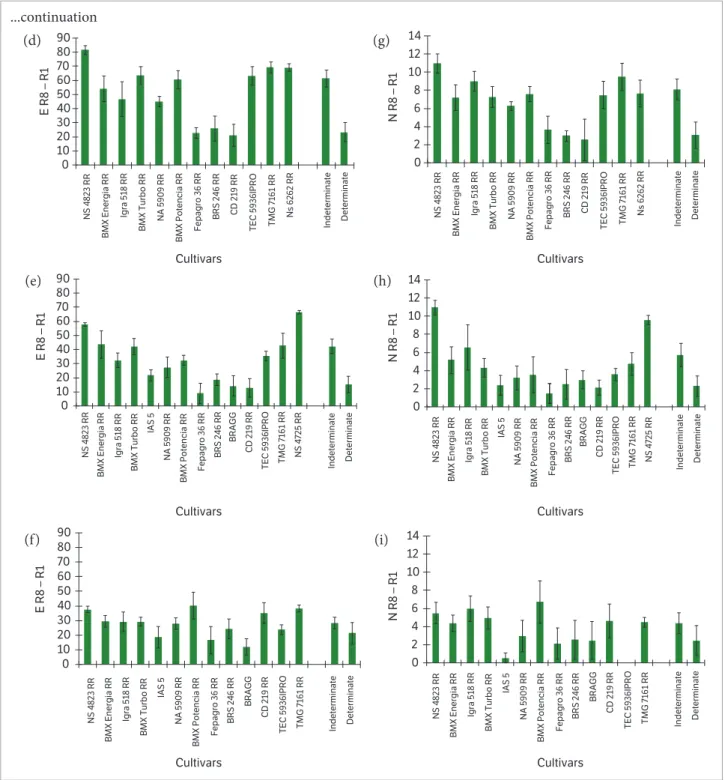
In the experiments conducted in commercial soybean farms, the increase in stem height and NN after R1 as well as the overlapping period showed the same trend of the other sites (Figure 6). In Restinga Sêca, the difference between determinate and indeterminate cultivars was higher, probably because no morphological symptoms of water deficit were observed. In Água Santa, the small differences between growth habits are associated with delayed sowing date (December), which reduced growth and development cycle. Soybean is a short-day plant, and a late sowing date induced it to bloom faster than the plants that were sowed in Restinga Sêca and Tupanciretã (November), which were exposed to increasing photoperiod for a longer period (Sinclair et al. 2005; Zanon et al. 2015b). Thus, as sowing is delayed, the differences in growth and development of soybean cultivars with different growth habits tends to be smaller.
Joint analysis of the experiments
Based on the differences in the overlapping periods, stem height, and NN between R1 and R8 for determinate and indeterminate cultivars regarding sowing date and local, it is clear that there is genotypic variability and patterns of growth and development
Figure 4. (a) Overlap, in days, between beginning bloom (R1) and final number of nodes (FNN); (b) Stem height difference, in cm, between R8 and R1 (E R8 − R1); (c) NN difference between R8 and R1 (N R8 − R1) for soybean cultivars sown on 27/09/2013, 15/11/2013 and 6/2/2014 in Itaqui, RS.
NR8 – R1
Cultivars Cultivars Cultivars
ER8 – R1
Days between R1 and NFN
NS 4823 RR
BMX Energia RR
Igra 518 RR
BMX Turbo RR
NA 5909 RR
BMX Potencia RR
Fepargo 36 RR
BRS 246 RR
BRAGG
CD 219 RR
TEC 59361PRO
TMG 7161 RR inox
NS 4823 RR
BMX Energia RR
Igra 518 RR
BMX Turbo RR
NA 5909 RR
BMX Potencia RR
Fepargo 36 RR
BRS 246 RR
BRAGG
CD 219 RR
TEC 59361PRO
TMG 7161 RR inox
NS 4823 RR
BMX Energia RR
Igra 518 RR
BMX Turbo RR
NA 5909 RR
BMX Potencia RR
Fepargo 36 RR
BRS 246 RR
BRAGG
CD 219 RR
TEC 59361PRO
TMG 7161 RR inox
Indeterminate Determinate Indeterminate Determinate Indeterminate Determinate IAS 5 0 10 20 30 40 50 60 a a A B b a b a a a a a* b b b a a b A B a bc a c a
bc abc
c
a
b
a
bc c c
** 0 10 20 30 40 50 60 70 80 90 a b a b A B bc d a b cd ab bc d a bc
d c d
bc d e bc A B c d e f bc f b bcd bcd bcd a f ef def a bc a A A bcd d bcd abc bcd ab bc d bc d cd abc bcd 0 2 4 6 8 10 12 14 a ab A B c ab c ab ab b ab a c c c ab bcd A A bcd bcd d bcd abc cd abc a d d d (a) (b) (c)
**Means followed by the same uppercase letters do not differ by contrast
analysis at 5%
Br
agantia, C
ampina
s, v
. 7
5, n. 4, p
.44
6-45
8, 2
01
6
anon et al.
e 5
.
(a) Ov
erlap
, in da
ys, bet
w
een beginning bloom (R
1)
and final number of nodes
(FNN
);
(b
) S
tem height diff
er enc e, i n cm, betw een R8 R1 (E R8 − R1 ); (c
) NN diff
er enc e, betw een R8 and R1 (N R8 − R1 ) f or so ybe an cultiv ar s so wn in C apão do L eão (a, d, g), Júlio de C astilhos
, e, h) and F
rederic
o W
estphalen (c, f
, i), RS
, in the 2
01 3/ 201 4 gr o wing se ason. *Me ans follo wed b
y the same lo
wer
ca
se letter
s (comparison between cultiv
ar
s so
wed in the same loc
al) do not differ b
y T uke y’ s test **Me ans follo wed b
y the same upper
ca
se letter
s do not differ b
y contr
ast analy
sis at 5%
a bcd A A b efg bcd gh bcde h def bc cdef cdef fg NS 4823 RR
BMX Energia RR
Igra 518 RR
BMX Turbo RR
NA 5909 RR
BMX Potencia RR
Fepagro 36 RR
BRS 246 RR
BRAGG
CD 219 RR
TEC 5936IPRO
TMG 7161 RR Inox
Indeterminate Determinate Cultivars b bc a bcd bcd bcd cde def ef ef f f A A a b b b cd de ef def f ef A B bc b NS 4823 RR
BMX Energia RR
Igra 518 RR
IAS 5
NA 5909 RR
BMX Potencia RR
Fepagro 36 RR
BRS 246 RR
BRAGG
CD 219 RR
TEC 5936IPRO
TMG 7161 RR Inox
Indeterminate
Determinate
Cultivars
Cultivars
NS 4823 RR
BMX Energia RR
Igra 518 RR
IAS 5
NA 5909 RR
BMX Potencia RR
Fepagro 36 RR
BRS 246 RR
BRAGG
CD 219 RR
TEC 5936IPRO
TMG 7161 RR Inox
Indeterminate
Determinate
Cultivars
0 10 20 30 40 50 60 Days between R1 and NFN 0 10 20 30 40 50 60
Days between R1 and NFN 0 10 20 30 40 50 60
Days between R1 and NFN
E R8 – R1 a* a a b A** b b a b b a a B
0 10 20 30 40 50 60 70 80 90 E R8 – R1
0 10 20 30 40 50 60 70 80 90 E R8 – R1
0 10 20 30 40 50 60 70 80 90
a b b c A c c b b b b b A NS 4823 RR
BMX Energia RR
Igra 518 RR
BMX Turbo RR
IAS 5
NA 5909 RR
BMX Potencia RR
Fepagro 36 RR
BRS 246 RR
BRAGG
CD 219 RR
Indeterminate
Determinate
Cultivars
NS 4823 RR
BMX Energia RR
Igra 518 RR
BMX Turbo RR
IAS 5
NA 5909 RR
BMX Potencia RR
Fepagro 36 RR
BRS 246 RR
BRAGG
CD 219 RR
Indeterminate Determinate Cultivars a a A A abcd bcde a f abc ef abcd ab bcde def cdef NS 4823 RR
BMX Energia RR Igra 518 RR
BMX Turbo RR
NA 5909 RR
BMX Potencia RR
Fepagro 36 RR
BRS 246 RR
BRAGG
CD 219 RR
TEC 5936IPRO
TMG 7161 RR Inox
Figure 5. (a) Overlap, in days, between beginning bloom (R1) and final number of nodes (FNN); (b) Stem height difference, in cm, between R8 and R1 (E R8 − R1); (c) NN difference, between R8 and R1 (N R8 − R1) for soybean cultivars sown in Capão do Leão (a, d, g), Júlio de Castilhos (b, e, h) and Frederico Westphalen (c, f, i), RS, in the 2013/2014 growing season.
*Means followed by the same lowercase letters (comparison between cultivars sowed in the same local) do not differ by Tukey’s test **Means followed by the same uppercase letters do not differ by contrast analysis at 5%
Figure 6. (a, b, c) Overlap, in days, between beginning bloom (R1) and final number of nodes (FNN); (d, e, f) Stem height difference, in cm, between R8 and R1 (E R8 − R1); (g, h, i) NN difference, between R8 and R1 (N R8 − R1) for soybean cultivars sown in commercial farms in Restinga Sêca (a, d, g), Tupanciretã (b, e, h) and Água Santa (c, f, i), RS, in the 2013/2014 growing season.
NS 4823 RR
BMX Energia RR
Igra 518 RR
BMX Turbo RR
IAS 5
NA 5909 RR
BMX Potencia RR
Fepagro 36 RR
BRS 246 RR
BRAGG
CD 219 RR
TEC 5936IPRO
TMG 7161 RR Inox
Cultivars
ab
abcd
A
A
ab
bcd
a
cd
abc
d
abcd
ab
ab
bcd
bcd
NS 4823 RR
BMX Energia RR
Igra 518 RR
IAS 5
NA 5909 RR
BMX Potencia RR
Fepagro 36 RR
BRS 246 RR
BRAGG
CD 219 RR
TEC 5936IPRO
TMG 7161 RR Inox
Cultivars
d
a
bc A
B
cd
d
d
d d
ab
b
bc
b
N R8 – R1
0 2 4 6 8 10 12 14
N R8 – R1
0 2 4 6 8 10 12 14
N R8 – R1
2 0 4 6 8 10 12 14
NS 4823 RR
BMX Energia RR
Igra 518 RR
BMX Turbo RR
IAS 5
NA 5909 RR
BMX Potencia RR
Fepagro 36 RR
BRS 246 RR
BRAGG
CD 219 RR
Indeterminate Determinate
Indeterminate Determinate Indeterminate Determinate
Cultivars
a a
ab
d
A
d
d
bc
d
d
c
c
B
0 10 20 30 40 50 60 0 10 20 30 40 50 60 0 10 20 30 40 50 60
Days between R1 and NFN
Days between R1 and NFN
Days between R1 and NFN
NS 4823 RR
BMX Energia RR
Igra 518 RR
BMX Turbo RR
IAS 5
NA 5909 RR
BMX Potencia RR
Fepagro 36 RR
BRS 246 RR
BRAGG
CD 219 RR
TEC 5936IPRO TMG 7161 RR Indeterminate
Determinate
NS 4823 RR
BMX Energia RR
Igra 518 RR
BMX Turbo RR
NA 5909 RR
BMX Potencia RR
Fepagro 36 RR
BRS 246 RR
BRAGG
CD 219 RR
TEC 5936IPRO TMG 7161 RR
NS 4725 RR
Indeterminate Determinate Cultivars
Cultivars
Cultivars
NS 4823 RR
BMX Energia RR
Igra 518 RR
BMX Turbo RR
NA 5909 RR
BMX Potencia RR
Fepagro 36 RR
BRS 246 RR CD 219 RR TEC 5936IPRO TMG 7161 RR
Ns 6262 RR
Indeterminate Determinate
...continuation
...continue after R1, among cultivars, regardless of growth habit. These results indicate that breeding programs can select populations with different overlapping periods, stem height growth, and NN after R1, based on the desired traits depending on the sowing
(a) (g)
(h)
(i)
(b)
Figure 6. (a, b, c) Overlap, in days, between beginning bloom (R1) and final number of nodes (FNN); (d, e, f) Stem height difference, in cm, between R8 and R1 (E R8 − R1); (g, h, i) NN difference, between R8 and R1 (N R8 − R1) for soybean cultivars sown in commercial farms in Restinga Sêca (a, d, g), Tupanciretã (b, e, h) and Água Santa (c, f, i), RS, in the 2013/2014 growing season.
0 10 20 30 40 50 60 70 80 90
0 10 20 30 40 50 60 70 80 90
0 2 4 6 8 10 12 14
NS 4823 RR
BMX Energia RR
Igra 518 RR
BMX Turbo RR
IAS 5
NA 5909 RR
BMX Potencia RR
Fepagro 36 RR
BRS 246 RR
BRAGG
CD 219 RR
TEC 5936IPRO TMG 7161 RR
NS 4823 RR
BMX Energia RR
Igra 518 RR
BMX Turbo RR
IAS 5
NA 5909 RR
BMX Potencia RR
Fepagro 36 RR
BRS 246 RR
BRAGG
CD 219 RR
TEC 5936IPRO TMG 7161 RR Indeterminate Determinate 0
10 20 30 40 50 60 70 80 90
0 2 4 6 8 10 12 14
NS 4823 RR
BMX Energia RR
Igra 518 RR
BMX Turbo RR
IAS 5
NA 5909 RR
BMX Potencia RR
Fepagro 36 RR
BRS 246 RR
BRAGG
CD 219 RR
TEC 5936IPRO TMG 7161 RR
NS 4725 RR
NS 4823 RR
BMX Energia RR
Igra 518 RR
BMX Turbo RR
IAS 5
NA 5909 RR
BMX Potencia RR
Fepagro 36 RR
BRS 246 RR
BRAGG
CD 219 RR
TEC 5936IPRO TMG 7161 RR
NS 4725 RR
Cultivars Cultivars
Cultivars Cultivars
Cultivars Cultivars
0 2 4 6 8 10 12 14
NS 4823 RR
N R8 – R1
N R8 – R1
N R8 – R1
E R8 – R1
E R8 – R1
E R8 – R1
BMX Energia RR
Igra 518 RR
BMX Turbo RR
NA 5909 RR
BMX Potencia RR
Fepagro 36 RR
BRS 246 RR CD 219 RR TEC 5936IPRO TMG 7161 RR
Ns 6262 RR
NS 4823 RR
BMX Energia RR
Igra 518 RR
BMX Turbo RR
NA 5909 RR
BMX Potencia RR
Fepagro 36 RR
BRS 246 RR CD 219 RR TEC 5936IPRO TMG 7161 RR
Ns 6262 RR
Indeterminate Determinate Indeterminate Determinate Indeterminate Determinate
Indeterminate Determinate Indeterminate Determinate
...continuation
date. Knowledge of the variability among growth habits is the key to achieve maximum yields in either early or late sowing date, because the traits, stem height, and NN are key factors for the adaptation of cultivars, management practices, and potential yield (Wilcox and Sediyama 1981). Moreover, these results indicate the
need for eco-physiological (photoassimilates partitioning) and physiological (photosynthetic rate and stomatal conductance) studies to elucidate the differences among cultivars of the same and/or different growth habits, MG, sowing date, and local of cultivation.
(g) (d)
(h) (e)
From this study, agronomists and farmers can make management decisions based on updated technical information when a new soybean cultivar is released. The indeterminate cultivars had longer overlapping period as well as higher stem elongation and NN after R1 in most locations and sowing dates. According to these results, it is possible to conclude that the indeterminate cultivars have greater stability and ability to adapt to adverse growing conditions, such as early or delayed sowing date, short periods of water shortage or surplus in the soil, which is often observed in RS. These characteristics allowed us to understand the reason behind the changing growth habits of soybean cultivars grown in southern Brazil in the last 15 years.
concLusion
The overlapping period, stem height elongation, and number of nodes between R1 and R8 were higher for
cultivars with indeterminate growth habit compared with the determinate one, and the magnitude of these differences decreased as sowing was delayed for indeterminate cultivars and remained almost unchanged for determinate ones.
Further studies aiming to understand and reclassify the cultivars currently sown by farmers in southern Brazil according to their growth habit are needed.
AcKnowLedgMents
We would like to especially thank all colleagues from the Research Group in Agrometeorology at the Universidade Federal de Santa Maria and the Professor Isabel Lago and her research group at UFPel, for helping to collect, organize, and input the data used for this study. Data collection for this project was funded by the National Counsel of Technological and Scientific Development (CNPq) (Project no. 471860/2012-3).
(1)NN at R1 and at R8 were not evaluated for the 12/23/2013 sowing date in Itaqui; nsNon-significant; *Significant at 5%. Det = Determinate growth;
Ind = Indeterminate growth.
table 3. Contrasts between cultivars with determinate (IAS 5, Fepagro 36 RR, BRS 246 RR, Bragg and CD 219 RR) x inderteminate growth habit (NS 4725 RR, NS 4823 RR, TMG 7161 RR Inox, BMX Energia RR, TEC 5936 IPRO, BMX Turbo RR, NS 6262 RR, NA 5909 RG, Igra RA 518 RR and BMX Potência RR) for the variables stem height at R1 (Height R1) and at R8 (Height R8), number of nodes in R1 (NN R1) and number of nodes in R8 (NN R8) in trials in Santa Maria, Itaqui, Capão do Leão, Júlio de Castilhos and Frederico Westphalen, Rio Grande do Sul.
Height r1 Height r8 nn r1 nn r8
(det x ind)
Santa Maria (9/27/2013) 83 × 43* 100 × 110ns 14.8 × 9.3ns 17.0 × 19.3* Santa Maria (11/15/2013) 110 × 61* 138 × 119* 15.9 × 10.7ns 19.7 × 17.9* Santa Maria (2/6/2014) 45 × 25ns 62 × 46ns 9.5 × 6.1* 11.2 × 8.4* Itaqui (10/16/2013) 41 × 33ns 48 × 57* 10.3 × 7.8ns 13.4 × 16.3* Itaqui (11/25/2013) 57 × 46ns 63 × 66ns 11.0 × 9.1* 14.6 × 15.5*
Itaqui (12/23/2013) 47 × 40ns 55 × 53ns – (1) –
Capão do Leão 83 × 48ns 108 × 100ns 15.3 × 11.3* 18.4 × 19.1*
Ashlock, L. and Purcell, L. (2000). Growth and development. In L. Ashlock (Ed.), Arkansas soybean handbook (p. 7-12). Little Rock: University Arkansas Cooperation Extension Service.
Bernard, R. L. (1972). Two genes affecting stem termination in soybeans. Crop Science, 12, 235-239.
Bernard, R. L., Cremeens, C. R., Cooper, R. L., Collins, F. I., Krober, O. A., Athow, K. L., Laviolette, F. A., Coble, C. J. and Nelson, R. L. (1998). Evaluation of the USDA soybean Germplasm Collection: maturity groups 000–IV. USDA-ARS Technical Bulletin 1844. Washington: US Government Publishing Office.
Egli, D. B. and Leggett, J. E. (1973). Dry matter accumulation patterns in determinate and indeterminate soybeans. Crop Science, 13, 220-222.
Empresa de Assistência Técnica e Extensão Rural (2015). Levantamento de área semeada com soja no Rio Grande do Sul. Porto Alegre: EMATER; [acessado 20 set. 2015]. http:// www. emater.tche.br/site/servicos/informacoes-agropecuarias.php#
Fehr, W. R., Caviness, C. E. Burmood, D. T. and Pennington, J. S. (1971). Stage of development descriptions for soybeans, Glycine max (L.) Merrill. Crop Science, 11, 929-931.
Heatherly, L. G. and Smith, J. R. (2004). Effect of soybean stem growth habit on height and node number after beginning bloom in the midsouthern USA. Crop Science, 44, 1855-1859.
Mundstock, C. M. and Thomas, A. L. (2005). Soja: fatores que afetam o crescimento e o rendimento de grãos. Porto Alegre: Evangraf.
Setiyono, T. D., Bastidas, A. M., Cassman, K. G., Weiss, A., Dobermann, A. and Specht, J. E. (2011). Nodal leaf area distribution in soybean plants grown in high yield environments.
Agronomy Journal, 103, 1198-1205. http://dx.doi.org/10.2134/
agronj2011.0051.
Streck, E. V., Kampf, N., Dalmolin, R. S. D., Klamt, E., Nascimento, P. C., Schneider, P., Giasson, E. and Pinto, L. F. S. (2008). Solos do Rio Grande do Sul. Porto Alegre: EMATER, UFRGS.
Sinclair, T. R., Neumaier, N., Farias, J. R. B. and Nepomuceno, A. L. (2005). Comparison of vegetative development in soybean cultivars for low latitude environments. Field Crops Research,
92, 53-59. http://dx.doi.org/10.1016/j.fcr.2004.08.008.
Wilcox, J. R. and Sediyama, T. (1981). Interrelationships among height, lodging and yield in determinate and indeterminate
soybeans. Euphytica, 30, 323-326. http://dx.doi.org/10.1007/
BF00033993.
Zanon, A. J., Streck, N. A., Richter, G. L., Becker, C. C., Rocha, T. S. M., Cera, J. C., Winck, J. E. M., Cardoso, A. P., Tagliapietra, E. L. and Weber, P. S. (2015a). Contribuição das ramificações e a evolução do índice de área foliar em cultivares modernas de soja.
Bragantia, 74, 279-209. http://dx.doi.org/10.1590/1678-4499.0463.
Zanon, A. J., Winck, J. E. M., Streck, N. A., Richter, G. L., Rocha, T. S. M., Cera, J. C., Lago, I., Santos, P. M., Maciel, L. R., Guedes, J. V. C. and Marchesan, E. (2015b). Desenvolvimento de cultivares de soja em função do grupo de maturação e tipo de crescimento
em terras altas e terras baixas. Bragantia, 74, 400-411. http://