Basic Areas /Article
Determination of optimum levels of nitrogen,
phosphorus and potassium of oil palm seedlings
in solution culture
Hasmah Mohidin (1,4); Mohamed Musa Hanafi (1,2*); Yusop Mohd Rafii (1); Siti Nor Akmar Abdullah (1); Abu Seman Idris (3); Sulaiman Man (4); Juferi Idris (5); Mahbod Sahebi (1)
(1) Universiti Putra Malaysia (UPM), Institute of Tropical Agriculture, Laboratory of Plantation Crops, 43400 Serdang, Selangor, Malaysia.
(2) (UPM), Faculty of Agriculture, Department of Land Management, 43400 Serdang, Selangor, Malaysia. (3) Malaysia Palm Oil Board (MPOB), GanoDROP Unit, Biological Research Division, No. 6, Persiaran Institusi, Bandar Baru Bangi, 43000 Kajang, Selangor, Malaysia.
(4) Universiti Teknologi MARA (UiTM), Faculty of Agrotechnology and Plantation, 94300 Kota Samarahan, Malaysia. (5) (UiTM), Faculty of Chemical Engineering, 94300 Kota Samarahan, Malaysia.
(*) Corresponding author: [email protected]
Received: Nov. 17, 2014; Accepted: Feb. 22, 2015
Abstract
Balanced nutrient elements in fertilizer play a critical role in oil palm seedling successful growth and development, and at the
same time reduces of fertilizer losses in the environment. This study examines the effect of different levels of N, P2O5 and K2O for
oil palm seedlings in solution culture on growth traits, nutrient uptake in plant tissues and biomass accumulation under nursery
conditions. Five concentration levels of N (50, 100, 300, 600 and 900 mg L–1), P
2O5 and K2O (15, 30, 60, 90 and 120 mg L
–1)
were used in a completely randomized design (CRD) with five replications for each. Parameters measured during the growing period include - plant height, leaf number/plant, stem diameter, SPAD chlorophyll value, and at harvest – total leaf area, root dry weight, shoot dry weight and total dry weight. Different levels of N, P2O5 and K2O showed significant effects on all the
parameters studied. The highest values for diameter, plant height, leaf number/plant, total leaf area, root dry weight, shoot dry
weight and total dry biomass were obtained using 100, 90 and 300 mg/L levels of N, P2O5 and K2O, respectively. Most of the
growth parameters, declined with lower levels of N, P2O5 and K2O. The results of this study provide a new knowledge to produce
oil palm plant with better nutrient management at the nursery under solution culture.
Key words: growth parameters, solution culture, oil palm, optimum level.
1. INTRODUCTION
Oil palm (Elaeis guineensis, Jacq) is an important
perennial crop in Malaysia, Indonesia, Columbia, and some African countries. In 2013, the total exports of oil palm products accounted for RM61.36 billion of national gross income; thus making Malaysia one of the largest producers and exporters in the world (MPOB, 2013).
Oil palm is the highest yielding oil crop (t ha–1) in the
world (Corley & Tinker, 2003). High yield quality crops can be obtained by supplying optimum mineral nutrition. Mineral nutrition involves the supply, absorption, and utilization of the essential nutrients required for successful growth and yield of the crop plants (Fageria et al., 2010).
Levels of N, P2O5, K2O and water are considered as the
major limiting factors in crop growth, development and finally economic yield (Glass, 2003; Parry et al., 2005).
Nitrogen is the most important nutrient element in terms of plant growth, physiology and carbohydrate content (Almodares et al., 2008). It is a constituent of chlorophyll, amino acids, proteins, alkaloids, and protoplasm. Phosphorus is the second most limiting nutrient in crop production, playing its most critical role in plants in energy transfer and storage. It is a structural component of nucleic acids, nucleotides, and coenzymes. Low availability is a limiting factor to plant growth (Fita et al., 2011). Potassium is important for maintaining osmotic balance, phloem transport, and photosynthesis (Tripler et al., 2006).
enhancement of the plant yields to satisfy growing food demand, while concurrently reducing the environmental impacts of agriculture (Lobell, 2007). Many studies have been carried out on the balance nutrient uptake under soil based plants (García-Palacios et al., 2014; Bloomfield et al., 2014; Koorem et al., 2014). However, in soil based plant experiment, there exists a complex interaction between the plant, the soil and microbes which may attribute to
competitive effects and does not reflect the real N, P2O5 and
K2O nutrients taken up and utilized by the plants precisely.
Furthermore, in soil medium there exist a complex interaction between ions within soil particles (Conn et al., 2013). For P nutrition, hydroponic trial is a better way to determine
the P2O5 optimum level because applied P fertilizers in soil
medium become precipitated by complexes with Fe, Al, and Ca in the soils immediately after application, thus does not give the correct amount available for the plant uptake. Hydroponically grown plants (plants cultivated in a soil-free growing system, where a controlled nutrient-rich solution supplies plant roots with nourishment) have been shown to have faster growth rate than soil based plants and are an ideal medium and platform for conveniently evaluating whole plant physiology (Conn et al., 2013). Furthermore, correct nutrient management at nursery stage could avoid wastage and reduces losses of fertilizer. Hydroponic medium give higher yield per unit measured area, continuous year round production, higher quality and ease of processing of harvested product due to minimal contamination from pollutants, pests and pathogens (Pardossi et al., 2006) and most importantly an easy handling of the nutrient profile of the growth medium. In this study, the effect of different
levels of N, P2O5 and K2O for oil palm seedlings in solution
culture on growth, physiological, nutrient uptake in plant tissues and biomass accumulation have been carried out under nursery conditions.
2. MATERIAL AND METHOD
Study site and plant materials
The experiment was conducted in the Experimental Farm, No. 2, Universiti Putra Malaysia, Serdang, Selangor, Malaysia (2°59’20.56”N, 101°42’44.42”E) under nursery glasshouse conditions for 182 days between April - October, 2012. The trial was set up in plastic pails (20 cm diameter × 16 cm depth).
Plant materials consist of pre-germinated seeds, Dura × Pisifera
(F0046 × 1 HP60) purchased from FELDA Plantations Sdn. Bhd, Sungai Tekam, Jerantut, Pahang, Malaysia. Hydroponic media consisting of distilled water and various prepared concentrations of Hoagland solution (A and B) were employed to provide a calculated five nutrient levels
for the primary elements of N, P2O5 K2O were prepared,
respectively. The prepared solution was then applied to the growing seedlings.
Growth conditions, treatments and experimental design
The germinated oil palm seedlings were raised in polypropylene trays, kept moist with distilled water and wool, and replaced every three days for 2 weeks. Oil palm seedlings of uniform plant height were selected. The nutrient solution used as the plant growth media was prepared according to Hoagland with some modifications (Hoagland & Arnon, 1950). The pH of the culture solution was adjusted to 5.5 with 0.1N NaOH or 0.1N HCl, and monitored. Electrical conductivity (EC) reading was also monitored to ensure it remains within the recommended range of 0.1-4.0 mmhos. The solution was permanently aerated using an air pump and was renewed every 14 days to guarantee an adequate nutrient supply and replenishment needs for the growing seedlings. Each seedling was fixed onto foam to hold the seedlings erect and placed on perforated white polystyrene covered with black plastic onto individual polypropylene pail containing 2.0 L of nutrient solution. Treatment levels consisted of 50,
100, 300, 600 and 900 mg L-1 concentrations of N and
K2O and 15, 30, 60, 90 and 120 mg L-1 concentrations of
P2O5 laid out in a completely randomized design (CRD)
with 5 replications and a total of 75 experimental units
Data collection on growth r parameters
Several growth parameters were measured during the growing period. Plant height, leaf number/plant, stem diameter and physiological parameters including SPAD chlorophyll content were recorded at a biweekly interval beginning 98 DAT. Measurement of stem diameter was made using a digital caliper. The chlorophyll (Chl) value in the third leaf was determined with a SPAD Chl meter (SPAD-502 Minolta) following the Benton Jones method (Jones, 2003). The Chl value (commonly called SPAD Chl value) of each leaf was the average of five measurements. In the course of the experiment, some deficiency and/or toxicity symptoms were noted and recorded.
Biomass measurement
Sample preparation and analysis
After drying, all the plant components were separately ground and sub-sampled. Oven-dried shoot and roots (250 mg) were digested in 5 mL sulfuric acid in a block digester at 330 °C for 2 hours. Hydrogen peroxide (4-5 drops) was added after which the samples were placed in a digester for 1 hour (Gupta, 2007). Digested solutions were filtered through Whatman filter paper No. 44 and made up to 50 mL with distilled water in volumetric flasks. The concentrations of N and P in solution were determined using an auto-analyzer (QuikChem, Series 8000, Lachat Instruments Inc., USA) and the concentration of K was measured using atomic absorption spectrophotometer (Perkin-Elmer 5100 PC).
Statistical analysis
Data were averaged over the replications for all measuring dates and their means were used in deriving relationships between growth and nutrient uptake parameters. The differences in growth and nutrition between the
N, P2O5 and K2O treatments were calculated using the SAS
statistical procedure, PROC ANOVA, Duncan’s Multiple Range Test (DMRT; p<0.05) was used to detect significant grouping among the treatments.
3. RESULTS AND DISCUSSION
Effect of nitrogen levels on oil palm
seedlings growth
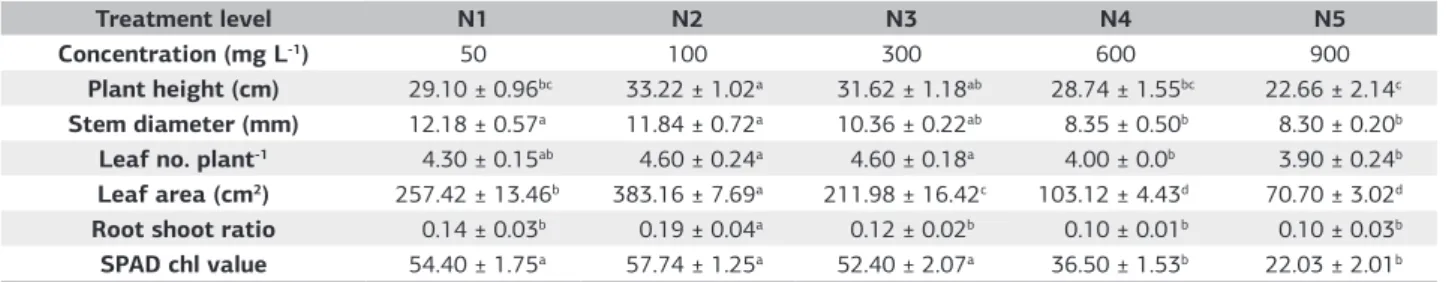
The results of growth parameters outlined in Table 1, indicated all plant traits measured - total leaf area and root shoot ratio indicated highly significant (p<0.001) difference among the treatment levels, while plant height, stem diameter, number of leaf/plant indicated significant
difference (p<0.05). Level N2 (100 mg L–1) recording the
highest value which began to decline significantly as the N levels were raised. The physiological parameter indicated
only SPAD Chl values was significantly different (p<0.05) among the N treatment levels.
The total leaf area at level N2 was significantly higher
(383.16 cm2) and began to decline significantly as the
N level was raised to 300 mg L–1. The lowest treatment
at N1 (50 mg L–1) resulted in a 32.8% reduction in total
leaf area. This increased leaf area in N2 despite only slight differences in the leaf number/plant suggest that higher leaf expansion of treated oil palm seedlings were attained. This study suggested that N nutrition at deficiency affected more strongly the leaf development rather than the photosynthesis. Moreover, N deficiency has great impact on chloroplast in size, composition and function (Lawlor & Cornic, 2002). On the other hand, the higher rates, N4 and N5 attain the level of toxicity and retard the plant growth and this could also be attributed to toxicity of the nutrient at higher levels, where the symptoms of necrosis of the oil palm seedlings’ leaves initially were observed and eventually the whole plants died.
In solution culture experiment, N is absorbed in large
quantity and the forms, such as NO3- (anion) or NH
4
+ (cation),
in which this element is supplied exerts a great influence on pH change and pH in turn affect in unequal absorption of cations and anions and nutrient availability in solution culture.
Effect of phosphorus levels on oil palm
seedlings growth
Multiple mean comparisons of the growth parameters in table 2 indicated plant traits measured - leaf area, root shoot ratio, SPAD Chl value, - were highly significant (p<0.001) difference among the treatment levels, while plant height and stem diameter gave the highest values among the
treatment levels. Overall, P4 (90 mg L-1) were optimum for
plant height, stem diameter, total leaf area, and root shoot
ratio. The higher level of P2O5 nutrition caused the highest
increase (34.50 cm) in plant height at P4. Similarly, the SPAD Chl value was significantly influenced by the level
of P2O5. In treatment P1 (15 mg L-1), total leaf area was
reduced (193.79 cm2), a 70.4% reduction from the optimum
values and leaves were observed to be shorter as affected by
Table 1. Mean comparison of nitrogen nutrition for growth and parameter at harvest, 182 DAT
Treatment level N1 N2 N3 N4 N5
Concentration (mg L-1) 50 100 300 600 900
Plant height (cm) 29.10 ± 0.96bc 33.22 ± 1.02a 31.62 ± 1.18ab 28.74 ± 1.55bc 22.66 ± 2.14c Stem diameter (mm) 12.18 ± 0.57a 11.84 ± 0.72a 10.36 ± 0.22ab 8.35 ± 0.50b 8.30 ± 0.20b Leaf no. plant-1 4.30 ± 0.15ab 4.60 ± 0.24a 4.60 ± 0.18a 4.00 ± 0.0b 3.90 ± 0.24b Leaf area (cm2) 257.42 ± 13.46b 383.16 ± 7.69a 211.98 ± 16.42c 103.12 ± 4.43d 70.70 ± 3.02d Root shoot ratio 0.14 ± 0.03b 0.19 ± 0.04a 0.12 ± 0.02b 0.10 ± 0.01b 0.10 ± 0.03b SPAD chl value 54.40 ± 1.75a 57.74 ± 1.25a 52.40 ± 2.07a 36.50 ± 1.53b 22.03 ± 2.01b
P2O5 deficiency. Increasing the levels of P2O5 treatments, significantly increase (p<0.001) the root shoot ratio by a 45.5%. Phosphorus nutrition have caused greater percentage of assimilate partitioned towards the roots, thus this lead to an increase in the root shoot ratio. The P1 treatment was too low to impact on the growth parameters, while the higher rate was too toxic to allow proper growth. As observed in this present study, P deficiency had reduced leaf expansion, leaf surface area, and the number of leaves and this was later on reflected in lower biomass production at harvest. This is due to inadequate P slows the processes of carbohydrate metabolism including photosynthesis and respiration, which results in a buildup of carbohydrates and the development of a dark green leaf color. In addition, leaf edges turn scorched brown in deficiency of P.
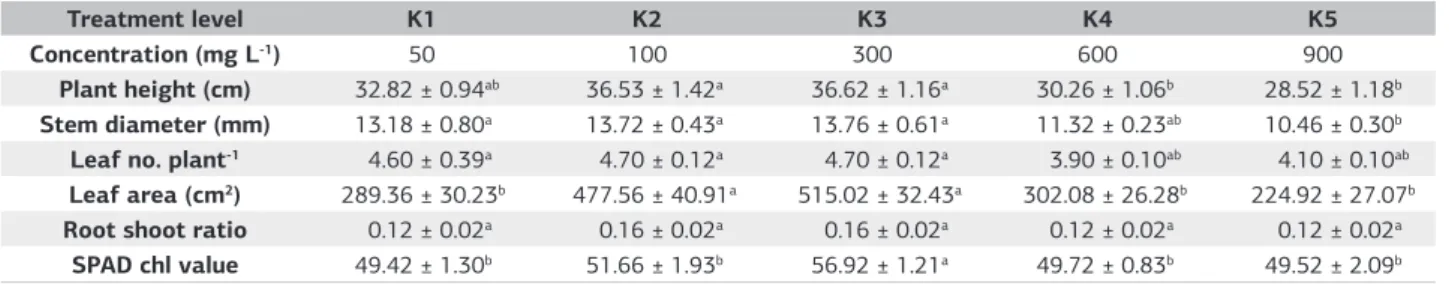
Effect of potassium levels on oil palm
seedlings growth
Overall, multiple mean comparisons of all the K2O treatments
(Table 3) indicated all plant growth traits measured - plant height, stem diameter, leaf area, (p<0.001) number of leaf plant (p<0.05) indicated significant difference among the
treatment levels, with K3 (300 mg L–1) recording the highest
reading and declining significantly as the K2O levels were
raised. At K1, the lowest treatment levels for K2O (50 mg L–1)
resulted in 43.8% increase in total leaf area. It can be noticed that optimum concentration of K element in nutrient solution led to maximum plant height, stem diameter, leaf area and other growth traits.
Effect of N, P2O5 and K2O nutrition on dry
weight, total biomass and proportion of
biomass partitioning
Among all the growth parameters, dry biomass accumulation confirms the positive effects of a balanced nutrition and the
importance of these N, P2O5 and K2O nutrition on the oil
palm growth performance. For N treatment in Table 4, all of dry biomass i.e. shoot dry weight, root dry weight and total plant biomass for N treatment indicated highly significant (0.001) difference among the treatment levels.
Highest shoot dry weight values, 2.35 and 1.85 g plant–1, were
obtained with the first two lower levels of N concentrations
(100 and 50 mg L–1 respectively), being significantly different
(p≤0.001). Treatment level of N2 (100 mg L–1) gave the
optimum value for most of the agronomic parameters studied and is recommended to attain optimum seedling growth
in oil palm. The higher N rate did not have positive impact on the growth parameters studied. A gradual significant decrease in the shoot dry matter was noted as
N concentration was raised to 300 mg L–1 and further raised
to 600 and 900 mg L–1 levels with the values declining to
1.56, 1.10, and 0.63 g plant–1, respectively. The higher rates
attain the level of toxicity and retard the plant growth rate and dry matter accumulation.
For biomass accumulation with P2O5 treatment, treatment
level P4 (90 mg L–1) was considered the optimum for the
growth parameters studied. The P concentration applied
gave the highest shoot dry weight (2.79 g plant–1) that was
significantly different from the other four applied levels.
The least shoot dry weight yield (1.35 and 1.42 g plant–1)
were obtained from the lowest applied P concentration
Table 2. Mean comparison of phosphorus nutrition for growth and parameter at harvest, 182 DAT
Treatment level P1 P2 P3 P4 P5
Concentration (mg L-1) 15 30 60 90 120
Plant height (cm) 29.56 ± 0.55a 32.04 ±1.40a 29.16 ± 2.21a 34.50 ± 1.95a 31.16 ± 2.13a Stem diameter (mm) 10.46 ± 0.84a 11.92 ± 0.29a 10.34 ± 0.51a 12.24 ± 0.44a 11.36 ± 0.74a Leaf no. plant-1 4.60 ± 0.19ab 5.00 ± 0.10a 4.20 ± 0.20b 4.80 ± 0.20a 4.20 ± 0.20b Leaf area (cm2) 193.79 ± 2.48e 353.99 ± 3.93c 427.91 ± 1.68b 654.33 ± 6.02a 238.73 ± 2.51d Root shoot ratio 0.072 ± 0.004e 0.116 ± 0.004d 0.148 ± 0.008b 0.182 ± 0.003a 0.132 ± 0.004c
SPAD chl value 50.17 ± 1.32b 52.76 ± 1.70a 54.62 ± 2.13a 55.20 ± 1.04a 50.36 ± 2.01b
Means sharing similar letter in a column are statistically non-significant (p>0.05); ± values indicates the standard error (n= 5).
Table 3. Mean comparison of potassium nutrition for growth and parameter at harvest, 182 DAT
Treatment level K1 K2 K3 K4 K5
Concentration (mg L-1) 50 100 300 600 900
Plant height (cm) 32.82 ± 0.94ab 36.53 ± 1.42a 36.62 ± 1.16a 30.26 ± 1.06b 28.52 ± 1.18b Stem diameter (mm) 13.18 ± 0.80a 13.72 ± 0.43a 13.76 ± 0.61a 11.32 ± 0.23ab 10.46 ± 0.30b Leaf no. plant-1 4.60 ± 0.39a 4.70 ± 0.12a 4.70 ± 0.12a 3.90 ± 0.10ab 4.10 ± 0.10ab Leaf area (cm2) 289.36 ± 30.23b 477.56 ± 40.91a 515.02 ± 32.43a 302.08 ± 26.28b 224.92 ± 27.07b Root shoot ratio 0.12 ± 0.02a 0.16 ± 0.02a 0.16 ± 0.02a 0.12 ± 0.02a 0.12 ± 0.02a
SPAD chl value 49.42 ± 1.30b 51.66 ± 1.93b 56.92 ± 1.21a 49.72 ± 0.83b 49.52 ± 2.09b
in P1 (15 mg L–1) and the highest in P5 (120 mg L–1),
respectively, and both were not significantly different. At P1 level was too low to impact on the growth parameters, while P5 was too toxic to allow for proper growth. Root dry weight was not significantly affected by the treatment levels but P4 gave the highest root dry weight.
Phosphorus concentrations in P4 and P2 gave the highest
total dry matter of 3.16 and 2.72 g plant–1, respectively, with
no significant difference between the two levels. Similarly
lowest total dry matter of 1.75 and 1.57 g plant–1 was
obtained from the highest (P5) and lowest (P1) applied P concentrations, respectively, with no significant difference between the two.
Applied K levels in K2 and K3 (100 and 300 mg L–1 respectively)
gave the highest shoot dry weight values of 3.26 and 3.50 g
plant–1 respectively, with the difference between the two being
insignificant. Lower shoot dry weight values of 2.20, 1.98,
and 1.62 g plant–1 came from the remaining 3 treatment
levels of 50, 600, and 900 mg L–1, respectively, with the
difference between them being insignificant. Potassium
applied concentration of 300 mg L–1 gave a correspondingly
significantly high root dry weight value (0.62 g plant-1) than
the other applied treatment levels. Lowest root dry weight value came from 3 applied K concentrations of 50, 600, and
900 mg L–1, with no significant difference between them.
Highest total dry weight values of 3.77 and 4.12 g plant-1
were obtained from applied K levels of 100 and 300 mg L–1,
respectively. Overall, total plant biomass accumulated in the plant was affected significantly by the different levels of N,
P2O5 and K2O treatment, with the optimum values of 2.78,
3.16 and 4.12 g/plant at N2, P4 and K3 levels obtained. For proportion of biomass partitioning in table 4, all the three treatments indicated shoots portion consisting of leaf, stem and stem accounted for the greatest proportion of dry matter partitioning, 81.1-90.9%, while root accounted only 9.1-18.9%, respectively.
Effect of N, P2O5 and K2O nutrition on the
nutrient uptake, nutrient concentration and nutrient partitioning in plant parts
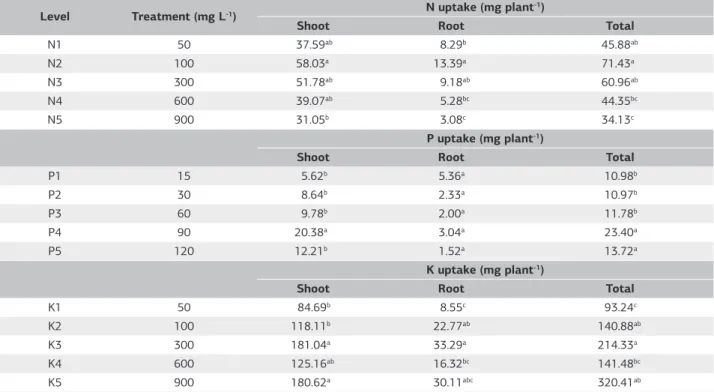
For nutrient uptake (Table 5), all the applied treatment levels indicated higher nutrient uptake in the shoot as compared to the root portion. The highest total N uptake
of 58.03 g plant-1 was obtained with 100 mg L–1 levels of
applied N with mean comparison portrays the differences
as highly significant. Irrespective of the N, P2O5 and
K2O source in the solution culture, highest nutrient uptake
for total N, P and K in plant tissue were 71.43, 23.40 and
214.33 mg plant-1 respectively, obtained with treatment
applications of 100, 90 and 300 mg L–1 with significant
different among treatments. Results indicate a distinct role of N in the export of photosynthesis from leaves to root. The alteration in photosynthetic partitioning plays a major
Table 4. Effect of N, P2O5 and K2O nutrition on oil palm dry weight, proportion of biomass accumulation and total biomass accumulation
at harvest, 182 DAT
Treatment Level N nutrition (g plant
-1, (%))
Shoot Dry Wt Root Dry Wt Total
N1 50 1.85 ± 0.21b(86.4) 0.29 ± 0.03b(13.6) 2.14 ± 0.14b
N2 100 2.35 ± 0.16a(84.5) 0.43 ± 0.04a(16.3) 2.78 ± 0.19a
N3 300 1.56 ± 0.09c(89.7) 0.18 ± 0.02c(10.3) 1.74 ± 0.09bc
N4 600 1.10 ± 0.14cd(90.9) 0.11 ± 0.01c(9.1) 1.21 ± 0.15cd
N5 900 0.63 ± 0.02d(90.0) 0.07 ± 0.02d(10.0) 0.70 ± 0.02d
P nutrition (g plant-1, (%))
Shoot Dry Wt Root Dry Wt Total
P1 15 1.35 ± 0.09c(86.0) 0.22 ± 0.04a(9.4) 1.57 ± 0.12c
P2 30 2.36 ± 0.15b(86.8) 0.36 ± 0.03a(13.2) 2.72 ± 0.16ab
P3 60 2.13 ± 0.05b(86.6) 0.33 ± 0.03a(13.4) 2.46 ± 0.07b
P4 90 2.79 ± 0.17a(88.3) 0.37 ± 0.03a(11.7) 3.16 ± 0.17a
P5 120 1.42 ± 0.12c(81.1) 0.33 ± 0.14a(18.9) 1.75 ± 0.18c
K nutrition (g plant-1, (%))
Shoot Dry Wt Root Dry Wt Total
K1 50 2.20 ± 0.30b(87.3) 0.32 ± 0.03c(12.7) 2.52 ± 0.32b
K2 100 3.26 ± 0.25a(86.5) 0.51 ± 0.02b(13.5) 3.77 ± 0.25a
K3 300 3.50 ± 0.15a(85.0) 0.62 ± 0.03a(15.0) 4.12 ± 0.15a
K4 600 1.98 ± 0.17b(88.4) 0.26 ± 0.02c(11.6) 2.24 ± 0.19b
K5 900 1.62 ± 0.11b(87.1) 0.24 ± 0.05c(12.9) 1.86 ± 0.15b
role in the differences in dry matter distribution between leaves and roots of plants (Cakmak et al., 1994).
Plant uptake is the most significant removal process in
N, P2O5 and K2O cycling. For any actively growing plants,
anything that affects the metabolism of the plant will affect
nutrient uptake. Elevating the total N, P2O5 and K2O levels
(Table 6) had significantly decreased total N, P2O5 and
K2O in total nutrient uptake. Potassium levels were found
to have similar trend with N (Table 6) in the assessed tissue parts, with concentration up to the highest rate tested in this
study. By comparing the same rate of N and K2O treatment,
K uptake greatly exceeds N uptake (more than 3 folds) in the total nutrients uptake in oil palm tissue. However, highest levels of nutrient concentration and nutrient uptake did not give the highest plant biomass accumulation though. These could be attributed to nutrient imbalances at higher levels
Table 5. Effect of N, P2O5 and K2O nutrition on the nutrient uptake in different plant parts at harvest, 182 DAT
Level Treatment (mg L-1) N uptake (mg plant
-1)
Shoot Root Total
N1 50 37.59ab 8.29b 45.88ab
N2 100 58.03a 13.39a 71.43a
N3 300 51.78ab 9.18ab 60.96ab
N4 600 39.07ab 5.28bc 44.35bc
N5 900 31.05b 3.08c 34.13c
P uptake (mg plant-1)
Shoot Root Total
P1 15 5.62b 5.36a 10.98b
P2 30 8.64b 2.33a 10.97b
P3 60 9.78b 2.00a 11.78b
P4 90 20.38a 3.04a 23.40a
P5 120 12.21b 1.52a 13.72a
K uptake (mg plant-1)
Shoot Root Total
K1 50 84.69b 8.55c 93.24c
K2 100 118.11b 22.77ab 140.88ab
K3 300 181.04a 33.29a 214.33a
K4 600 125.16ab 16.32bc 141.48bc
K5 900 180.62a 30.11abc 320.41ab
Means sharing similar letter in a column for different levels of the same nutrient are statistically non-significant according to Duncan’s Multiple Range Test (DMRT) at α=0.05; values are the means of five replicates ± standard error.
Table 6. Effect of N, P2O5, and K2O treatment on nutrient concentration and nutrient partitioning of different plant parts at harvest, 182 DAT
Treatment Level
N (%) P (%) K (%)
Total (%)
Shoot Root Shoot Root Shoot Root
Conc* Part* Conc Part Conc Part Conc Part Conc Part Conc Part
N1 2.11±0.23c 32.4 3.18±0.21c 7.0 3.69±0.49b 5.7 0.62±0.01a 1.4 2.74± 0.04ab 42.1 5.19±0.13ab 11.4 100 N2 2.88±0.03b 38.3 3.62±0.19c 8.9 3.50±0.19b 4.7 0.66±0.01a 1.6 2.46±0.14abc 32.7 5.57±0.36a 13.7 100 N3 3.37±0.13b 44.3 4.96±0.37b 7.9 4.96±0.37a 6.5 0.64±0.01a 1.2 2.41±0.14bc 31.7 4.60±0.14b 8.3 100 N4 3.53±0.10b 27.0 4.93±0.09a 6.0 4.38±0.45ab 5.5 0.64±0.01a 0.8 2.88±0.18a 36.5 5.28±0.04ab 6.5 100 N5 4.93±0.43a 39.0 4.64±0.05ab 5.9 4.10±0.17ab 4.9 0.54±0.01b 0.7 2.14±0.08c 25.6 3.05±0.43c 3.9 100 P1 2.75±0.28bc 35.8 4.27±0.08a 10.3 0.38±0.04b 4.9 1.84±1.33a 4.4 2.67±0.28a 34.7 4.07±0.17b 9.8 100 P2 2.50±0.08c 39.2 4.36±0.27a 12.2 0.38±0.01b 6.0 0.58±0.03a 1.6 1.88±0.05b 29.5 4.13±0.10b 11.5 100 P3 2.39±0.08c 38.5 4.28±0.13a 9.8 0.42 ±0.02b 6.8 0.60±0.02a 1.4 2.00±0.09b 32.2 4.98±0.29a 11.4 100 P4 3.50±0.10a 42.4 4.39±0.03a 9.3 1.00±0.13a 12.2 0.87±0.00a 1.8 1.99±0.11b 24.1 4.79±0.17a 10.1 100 P5 3.11±0.15ab 44.4 4.51±0.24a 4.8 0.51±0.02b 7.3 0.85±0.06a 0.9 2.60±0.17a 37.2 4.99±0.06a 5.3 100 K1 4.76±0.08b 48.4 4.47±0.08ab 5.1 0.90±0.07ab 9.1 0.60±0.06a 0.7 3.27±0.07d 33.3 3.04±0.32c 3.4 100 K2 6.11±0.12a 47.7 5.09±0.09a 6.3 1.15±0.12ab 9.0 0.90±0.01a 1.1 3.84±0.07d 30.0 4.64±0.19bc 5.8 100 K3 6.01±0.23a 42.9 4.47±0.08ab 5.4 1.19±0.13a 8.5 0.78±0.13a 0.9 5.00±0.40c 35.7 5.49±0.10b 6.6 100 K4 5.53±0.41ab 39.9 3.84±0.17bc 3.3 0.88±0.08ab 6.3 0.70±0.04a 0.6 6.11±0.17b 44.0 6.80±0.38ab 5.9 100 K5 5.63±0.35ab 31.0 3.64±0.36c 2.8 0.86±0.00b 4.7 0.71±0.05a 0.6 9.95±0.39a 54.7 7.91±1.51a 6.2 100
affecting the physiological, biochemical processes and retard growth of the oil palm seedlings. For instant, nutrient uptake in plant tissues for K4 and K5, indicated no corresponding increase in growth parameters and is reflected in the reduced total dry biomass at K4 and K5. Similarly, for N treatment, despite significantly higher shoot and root N content in N4 and N5, respectively, no corresponding increase of total biomass accumulated (Table 4). These cases shed some light on the antagonistic interaction among the nutrients, thus resulted in inefficient and uneconomical utilization of N and K nutrients in the plant tissues. What is clear is that the rate of nutrient uptake is controlled by the growth rate of plants and related to the physiological requirements.
Effect of N, P2O5 and K2O nutrition on
nutrient concentration and nutrient partitioning in plant parts
Laboratory analysis conducted to determine nutrient partitioned in oil palm tissues (Table 6) showed that all treatments resulted in higher nutrient concentration were partitioned in shoot parts compared to the root. Within the N treatment application, indicated significant increase in shoot N tissue concentration up to the highest rate tested in this study. The N2, N3 and N4 levels were not significantly different with each other, but were significantly different with N1 and N5, with the highest value of 4.93% obtained in N5.
In P2O5 treatment (Table 6), shoot parts for both
N and P nutrient concentration indicated the highest values at P4, with the values of 3.50 and 1.00% (p<0.05), respectively, both significantly different from all the other P levels. However, root P were not significantly different for all P levels in these two treatments. Shoot part indicated the highest K nutrient concentration value at P5 and were significantly different compared with other levels. For the root part, K nutrient concentration highest value was 4.99% at P5, but were not significantly different with P3 and P4 levels. Likewise, nutrient partitioning result observed similar trend with highest values of 12.2% for shoot partitioning at P4.
In K2O treatment (Table 6), N nutrient concentration
partitioned in shoot tissues showed higher values of 6.11% at K2 and 6.01% at K3, with significant different from K1, K4 and K4. Phosphorus nutrient concentration partitioned in shoot tissues was highest value of 1.19% at K3. For K concentration of nutrient, both the K shoot and root concentration significantly increased with the increased treatment levels up to the highest rate tested with the values of 9.95 and 7.91% in K5, in the shoot and root, respectively. Similarly, K5 nutrient partitioning significantly gave the highest K5 shoot values of 54.7% and K5 root of 6.2%, respectively.
According to Peterson’s finding, crop plants absorb more
K2O than any other nutrient except N (Peterson et al., 2006).
For K concentration of nutrient, both K shoot and root concentration significantly increased with the increased treatment levels indicate potassium is highly mobile within plant. However, K flow and partitioning can change depending on the forms of N supply (Zhang et al., 2010).
The NH4+ nutrition in comparison to NO
3- supply results
in more K translocated to leaves. The partitioning of assimilates between roots and shoots is important for the plant growth process. In this nutrient culture experiment,
N and K2O nutrition favor an increase in nutrient
partitioned in the shoot of oil palm seedlings probably due to increase rate of amino acid translocation to the shoot than the root. However, excessive K may cause Ca and Mg deficiencies and nutritional imbalances in the
plants, but limited N, P2O5 and K2O supply on the other
hand, decreases rates of cell division, cell expansion, cell permeability, photosynthesis, leaf production, and growth, plants (Roggatz et al., 1999; Reddy et al., 1997).
Among the nutrients, N, P and K are the major limiting factors in oil palm growth and yield. This study suggested
that despite the benefits of these N, P2O5 and K2O nutrition
in oil palm seedlings growth, the correct balance nutrient management levels of each element must be apply to avoid antagonistic interactions that could upset or suppress the uptake of other nutrients and affect the plant growth and development. For optimum crop growth and high yield proper doses of these nutrient elements are required.
Responses of oil palm to these N, P2O5 and K2O nutrition
are of considerable importance in agriculture. Therefore, to determine the optimum levels of N, P and K to grow better oil palm seedlings is crucial.
4. CONCLUSION
The growth traits, biomass accumulation and partitioning of oil palm seedlings were affected by nutrient uptake and availability. For better nutrient management, based on this study, N, P and K nutrient elements play a critical role in oil palm seedlings growth and development. The fertilization practice is to ensure the growing plant get all the required nutrients for optimum growth. Overall, nutrients uptake in palm tissues ranked in ascending order were as followed: P > N > K, respectively. It can be concluded that 100, 90 and
300 mg L–1 of N, P
2O5, and K2O, respectively, gave the
ACKNOWLEDGEMENTS
The authors are extremely grateful to Malaysian Palm Oil Board (MPOB) and Universiti Putra Malaysia (UPM), for jointly funding this research study, and to Universiti Technology MARA (UiTM) for granting study fellowship to the first author. The contribution made by Shamsuddeen Rufai is also acknowledged.
REFERENCES
Almodares, A., Taheri, R., Chung, I. M., & Fathi, M. (2008). The effect of nitrogen and potassium fertilizers on growth parameters and carbohydrate contents of sweet sorghum cultivars. Journal of Environmental Biology, 29, 849-852. PMid:19297978.
Bloomfield, K. J., Farquhar, G. D., & Lloyd, J. (2014). Photosynthesis– nitrogen relationships in tropical forest tree species as affected by soil phosphorus availability: a controlled environment study. Functional Plant Biology, 41, 820-832. http://dx.doi.org/10.1071/FP13278.
Cakmak, I., Hengeler, C., & Marschner, H. (1994). Partitioning of shoot and root dry matter and carbohydrates in bean plants suffering from phosphorus, potassium and magnesium deficiency. Journal of Experimental Botany, 45, 1245-1250. http://dx.doi.org/10.1093/ jxb/45.9.1245.
Conn, S. J., Hocking, B., Dayod, M., Xu, B., Athman, A., Henderson, S., Aukett, L., Conn, V., Shearer, M. K., Fuentes, S., Tyerman, S. D., & Gilliham, M. (2013). Protocol: optimising hydroponic growth systems for nutritional and physiological analysis of Arabidopsis thaliana and other plants. Plant Methods, 9, 4. http://dx.doi.org/10.1186/1746-4811-9-4. PMid:23379342.
Corley, R. H. V., & Tinker, P. B. (2003). The oil palm (4th ed.). Oxford: Blackwell Publishing.. http://dx.doi.org/10.1002/9780470750971.
Fageria, N. K., Baligar, V. C., & Jones, C. A. (2010). Growth and mineral nutrition of field crops (3rd ed.). New York: CRC Press.. http://dx.doi.org/10.1201/b10160.
Fita, A., Nuez, F., & Picó, B. (2011). Diversity in root architecture and response to P deficiency in seedlings of Cucumis melo L. Euphytica, 181, 323-339. http://dx.doi.org/10.1007/s10681-011-0432-z.
García-Palacios, P., Maestre, F. T., Bradford, M. A., & Reynolds, J. F. (2014). Earthworms modify plant biomass and nitrogen capture under conditions of soil nutrient heterogeneity and elevated atmospheric CO2 concentrations. Soil Biology & Biochemistry, 78, 182-188. http://dx.doi.org/10.1016/j.soilbio.2014.08.002.
Glass, A. D. M. (2003). Nitrogen use efficiency of crop plants: Physiological constraints upon nitrogen absorption. CRC. Critical Reviews in Plant Sciences, 22, 453-470. http://dx.doi.org/10.1080/07352680390243512.
Gupta, P. K. (2007). Soil, plant, water and fertilizer analysis (2nd ed.). India: Agrobios.
Hoagland, D. R, & Arnon, D. I. (1950). The water culture method for growing plants without soil (Circular 347). Berkeley: California Agricultural Experiment Station, University of California.
Jones, B., Jr. (2003). Agronomic handbook: management of crops, soils, and their fertility. Florida: CRC Press.
Koorem, K., Gazol, A., Öpik, M., Moora, M., Saks, Ü., Uibopuu, A., Sõber, V., & Zobel, M. (2014). Soil nutrient content influences the abundance of soil microbes but not plant biomass at the small-scale. PLoS One, 9, e91998. http://dx.doi.org/10.1371/journal. pone.0091998. PMid:24637633.
Lawlor, D. W., & Cornic, G. (2002). Photosynthetic carbon assimilation and associated metabolism in relation to water deficits in higher plants. Plant, Cell & Environment, 25, 275-294. http:// dx.doi.org/10.1046/j.0016-8025.2001.00814.x. PMid:11841670.
Lobell, D. B. (2007). The cost of uncertainty for nitrogen fertilizer management: a sensitivity analysis. F. Crop. Res, 100, 210-217. http:// dx.doi.org/10.1016/j.fcr.2006.07.007.
Malaysian Palm Oil Board - MPOB. (2013). Oil palm and the environment. Kajang. Retrieved in 15 July 2014, from http://bepi. mpob.gov.my/index.php/statistics/export/121-export-2013.html.
Pardossi, A., Malorgio, F., Incrocci, L., & Tognoni, F. (2006). Hydroponic technologies for greenhouse crops. In R. Dris (Ed.)., Crops: quality, growth and biotechnology. Helsinky: WFL Publisher.
Parry, M. A. J., Flexas, J., & Medrano, H. (2005). Prospects for crop production under drought: research priorities and future directions. Annals of Applied Biology, 147, 211-226. http://dx.doi. org/10.1111/j.1744-7348.2005.00032.x.
Peterson, G. A., Unger, W. P., & Payne, W. A. (2006). Dryland agriculture (2nd ed.). Madison: American Society of Agronomy.
Reddy, K. R., Hodges, H. F., & Mckinion, J. M. (1997). Modeling temperature effects on cotton internode and leaf growth. Crop Science, 37, 503-509. http://dx.doi.org/10.2135/cropsci1997.001 1183X003700020032x.
Roggatz, U., Mcdonald, A. J. S., Stadenberg, I., & Schurr, U. (1999). Effects of nitrogen deprivation on cell division and expansion in leaves
of Ricinus communis L. Plant, Cell & Environment, 22, 81-89. http://
dx.doi.org/10.1046/j.1365-3040.1999.00383.x.
Tripler, C. E., Kaushal, S. S., Likens, G. E., & Walter, M. T. (2006). Patterns in potassium dynamics in forest ecosystems. Ecology Letters, 9, 451-466. http://dx.doi.org/10.1111/j.1461-0248.2006.00891.x. PMid:16623731.