Leonardo Rodríguez Suárez , Yuli Tatiana Paladines Josa , Erika Judith Astudillo Samboni , Karla Dayana Lopez Cifuentes(1), Ervin Humprey Durán Bautista(1) and Juan Carlos Suárez Salazar(1) (1)Universidad de la Amazonia, Facultad de Ingeniería, Programa Ingeniería Agroecológica, Calle 17 Diagonal 17 con Carrera 3F,
Código Postal 180002 Florencia, Colombia. E-mail: [email protected], [email protected], [email protected], [email protected], [email protected], [email protected]
Abstract – The objective of this work was to evaluate the soil macrofauna and the bioindicator taxonomic groups associated with different land uses in the Colombian Amazon. Twelve agroforestry arrangements were studied and compared with to the native forest and pasture. For each land use, six monoliths were randomly selected and divided into four layers (litter, and 0–10, 10–20, and 20–30 cm soil depths). The variables considered in the analysis of land use effects were: individuals per square meter, order richness, Shannon’s diversity index, and Pielou’s evenness index. The greatest values for soil macrofauna density and diversity occurred in the forest, in contrast with the pasture. The principal component analysis distinguished land use according to macrofauna diversity, separating the native forest from the other land uses. The cluster analysis indicated the potential of some agroforestry systems to conserve the values of soil macrofauna
density and diversity similar to those of the forest. According to the analysis of indicator value, five taxonomic groups (Diplura, Pseudoscorpionida, Araneae, Chilopoda, and Gastropoda), identified as bioindicators, are
associated with preserved sites because of the sensitivity of their populations.
Index terms: agroforestry systems, bioindicators, richness, soil macrofauna.
Macrofauna edáfica em diferentes usos da terra na Amazônia colombiana
Resumo – O objetivo deste trabalho foi avaliar a macrofauna edáfica e os grupos taxonômicos bioindicadores associados a diferentes usos da terra na Amazônia colombiana. Doze arranjos agroflorestais foram estudadose comparados com a mata nativa e a pastagem. Para cada uso da terra, seis monólitos, divididos em quatro camadas (serrapilheira, e 0–10, 10–20 e 20–30 cm de profundidade) foram coletados aleatoriamente. As variáveis consideradas na análise do efeito dos usos da terra foram: indivíduos por metro quadrado, riqueza de ordens, índice de diversidade de Shannon e índice de equidade de Pielou. Os maiores valores
de densidade e diversidade de macrofauna do solo ocorreram na floresta, em contraste com a pastagem. A
análise dos componentes principais distinguiu os usos do solo de acordo com a diversidade da macrofauna,
tendo separado a floresta nativa dos outros usos da terra. A análise de agrupamento indicou o potencial de alguns sistemas agroflorestais para conservar os valores de densidade e diversidade da macrofauna edáfica semelhantes aos da floresta. De acordo com a análise do valor do indicador, cinco grupos taxonômicos (Diplura, Pseudoscorpionida, Araneae, Chilopoda e Gastropoda), identificados como bioindicadores, estão associados a locais conservados, em razão da sensibilidade de suas populações.
Termos de indexação: sistemas agroflorestais, bioindicadores, riqueza, macrofauna do solo.
Introduction
Soil provides an ample variety of ecosystem services that benefits the human population, and allows of ecosystems to adequately function (Wall et al., 2012). Moreover, it is considered a large reservoir of biodiversity, as macrofauna is an important component of soil biological diversity (Blouin et al., 2013).
Soil macrofauna plays an important role in the regulation of ecosystem functions (Marichal et al., 2014; Lavelle et al., 2016) because they contribute to controlling
soil structure (Bottinelli et al., 2015), modifying the soil aggregation and porosity (Velásquez et al., 2012), consequently improving infiltration and changing water retention patterns (Lavelle et al., 2014). In addition, they contribute to the organic matter mineralization and litter decomposition (Frouz et al., 2015).
To that effect, many studies have developed initiatives to identify bioindicator taxons associated with a particular habitat or land use conditions, as well as to associate bioindicator taxons with ecosystem functions and services of the soil (Rousseau et al., 2013; Vasconcellos et al., 2013; Lavelle et al., 2014; Marichal et al., 2014). Despite these initiatives, the deforestation and conversion of Amazon forests into pastures and crop lands can have profound effects on soil biodiversity and, consequently, impact the soil functions, the dynamics of its organic matter, the soil nutrient cycle, and soil physical characteristics such as bulk density, porosity, and water availability (Velásquez et al., 2012; Lavelle et al., 2016).
In this scenario, agroforestry systems are land uses that can exhibit great similarities to natural forests due to their forest cover and litter (Baretta et al., 2011; Oliveira et al., 2018). Practices associated with agroforestry systems such as the inclusion of vegetation that is structurally and taxonomically diverse, as well as the presence of a continuous soil cover, seem to be associated with the abundance and diversity of soil macrofauna (Moço et al., 2010; Pauli et al., 2011; Kamau et al., 2017).
The objective of this work was to evaluate the soil macrofauna and bioindicator taxonomic groups associated with different land uses in the Colombian Amazon.
Materials and Methods
This study was carried out between March and May of 2016, at the Macagual Center for Amazonian Research - Cesar Augusto Estrada Gonzalez, located in the western Colombian Amazon (1°30'4.87"N and 75°39'47.16"W). This center is in a humid area with an annual average precipitation of 3,793 mm, a monomodal rainfall regime with maximum precipitation distributed between April and September, 1,707 hours of sunshine per year, 25.5°C average temperature, and 84.3% relative humidity. Soil macrofauna was collected from 14 land uses, 12 agroforestry arrangements contrasted with native forest (positive control), and pasture (negative control) (Table 1).
In order to quantify the macrofauna, the ISO 23611-5 standard was used (ISO, 2011). Six monoliths were randomly collected from each land use (blocks of 25x25 cm and 30 cm deep). Each monolith was separated into four layers: litter, and 0-10, 10-20, 20-30 cm depths. The soil was inspected manually in situ. Existing soil macrofauna was then preserved in 70%
alcohol, separated in the lab according to morphology, and identified into class or order.
Variables considered in the analysis for land use impact were: individuals per m2, order richness, Shannon’s diversity index (H), and Pielou’s evenness index (e). Soil macrofauna data were normalized using log (x+1), and were compared using Fisher’s LSD test, at 5% probability. Due to the low density in some taxonomic groups (<0.2% of total density), these were grouped into the “others” category (Dermaptera, Lepidoptera, Mantodea, Nematodo, Neuroptera, Opiliones, Orthoptera, Phasmida, Psocoptera, and Scorpion); however, each group was considered when calculating richness and diversity indices. A completely random design was applied to subdivided plots using six monoliths per land use as replicates. The principal plot was land use, and the subplot was each depth, according to the model Yijk = μ + Usi + εi + Pj + UsPij + εk(ij), in which: Yijk is the observation; μ is the mean; Usi is the effect of the ith land use; εi is the error due to land use; Hj is the effect of the jth depth; UsPij is the interaction land use x depth; and εk(ij) is the error due to depth.
In order to determine similarities between land uses, and to explore the relationship between macrofauna groups, a principal component analysis (PCA) was conducted. The impact of different land uses was tested using the Monte-Carlo test. Subsequently, land uses were grouped into a similarity dendrogram according to data on macrofauna density and richness, using the Ward’s method and the Euclidian distance. The optimal number of clusters was determined considering 26 cluster validation indexes (Charrad et al., 2014).
The bioindicator taxonomic groups associated with different land uses were determined using the indicator value (IndVal), a method that indicates the strength and significance of the association between a taxon and a previously defined group (that is, habitats), ranging from 0 (no association) to 1 (maximum association) (Dufrêne & Legendre, 1997). Significance was measured using a randomization procedure (Monte-Carlo test, 1,000 simulations) and the Holm-Bonferroni correction for multiple tests. Taxons exhibiting IndVal values above 0.7, therefore significant, are considered characteristic or indicative of a habitat; taxons with values under 0.7 are considered detectors of ecological change (McGeoch et al., 2002).
Table 1. Description of the land uses studied at the Macagual Center for Amazonian Research – Cesar Augusto Estrada Gonzalez, located in the western Colombian Amazon.
Land uses Description
Native forest (NF) Natural system of approximately 40 years without any type of human intervention.
Shade trees for cultivation (STC)
Agroforestry system established for 24 years, which combines the trees paricá (Schizolobium amazonicum Huber ex Ducke), rubber [Hevea brasiliensis (Willd. ex A. Juss.) Müll. Arg.], and peach palm (Bactris gasipaes Kunth) with the fruit tree copoazú [Theobroma grandiflorum (Willd. ex Spreng.) K.Schum.].
Improved fallow (IF)
Agroforestry system established for 20 years, composed of species that naturally regenerate such as peine mono [Apeiba membranacea (Spruce ex Benth.)], snakewood (Cecropia peltata L.), boca de indio [Piptocoma discolor (Humb., Bonpl. & Kunth) Pruski], and tachuelo (Lacmellea edulis H. Karst); enriched with peach palm (Bactris gasipaes Kunth), ice cream bean (Inga edulis Mart.), arazá (Eugenia stipitata McVaugh), copoazú [Theobroma grandiflorum (Willd. ex Spreng.) K. Schum.] and pataxte (Theobroma bicolor Humb. & Bonpl.).
Cropping in alleys 1 (CA1)
Agroforestry system implemented for 20 years, in which timber tree seed were sown in rows, with a predominance of the species Amazon tree-grape (Pourouma cecropiifolia Mart.), associated with cedro (Cedrela odorata L.), higuerón (Ficus luschnathiana Miq.), boca de indio [Piptocoma discolor (Humb., Bonpl. & Kunth) Pruski], white chilco (Miconia appen-diculata Triana), laurel (Laurus nobilis L.), gamhar (Gmelina arborea Roxb ex Sm.), ice cream bean (Inga edulis Mart.), guacharaco (Cupania cinerea Poepp. & Endl.) and lacre (Vismia angosta); between the rows are arazá (Eugenia stipitata
McVaugh) and copoazú [Theobroma grandiflorum (Willd. ex Spreng.) K.Schum.]. The system is geogaphically located near water bodies.
Cropping in alleys 2 (CA2)
Agroforestry system established for 25 years, in which the tree seed were sown in rows with a predominance of the species peach palm (Bactris gasipaes Kunth) and rubber [Hevea brasiliensis (Willd. ex A. Juss.) Müll. Arg.], achapo [Cedrelinga cateniformis (Ducke) Ducke] is found at a low density, yarumo (Cecropia peltata L.), and ice cream bean (Inga edulis
Mart.); between the rows are cacao (Theobroma cacao L.), arazá (Eugenia stipitata McVaugh) and copoazú [Theobroma
grandiflorum (Willd. ex Spreng.) K.Schum.].
Cropping in forest plantation 1 (CFP1)
Agroforestry system established for 24 years, with a predominance of a type of rubber tree ([Hevea brasiliensis (Willd. ex A. Juss.) Müll. Arg.] characterized by its broad leaves, associated with the fruit trees copoazú [Theobroma grandiflorum (Willd. ex Spreng.) K.Schum.] and arazá (Eugenia stipitata McVaugh).
Cropping in forest plantation 2 (CFP2)
Agroforestry system established for 24 years, with a predominance of a type of rubber tree [Hevea brasiliensis (Willd. ex A. Juss.) Müll. Arg.] characterized by its small leaves, associated with the fruit trees arazá (Eugenia stipitata McVaugh) and copoazú [Theobroma grandiflorum (Willd. ex Spreng.) K.Schum.]. Because the canopy of the system allows of a constant radiation to enter, pioneer vegetation develops and, consequently, clearing activities and the use of herbicides are performed within the system at least twice a year.
Cropping in forest plantation 3 (CFP3)
Agroforestry system implemented for 21 years, composed of the species huito (Genipa Americana L.), bilibil [Guarea gui-donia (L.) Sleumer], higuerón (Ficus luschnathiana Miq.), wild cashew [Anacardium excelsum (Kunth) Skeels], Honduran mahogany (Swietenia macrophylla King.), laurel [Cordia alliodora (Ruiz & Pav.) Oken)], tachuelo (Lacmellea edulis H. Karst), Juan soco (Couma macrocarpa Barb.Rodr.), and sangre toro [Virola elongata (Benth.) Warb], associated with the fruit trees copoazú [Theobroma grandiflorum (Willd. ex Spreng.) K.Schum.], arazá (Eugenia stipitata McVaugh), and plan-tain (Musa paradisiaca L.). The system is geogaphically located near water bodies. Some areas of the system experience floods during periods of maximum precipitation.
Home garden (HG)
Agroforestry system implemented for 26 years that combines diverse fruit trees such as copoazú [Theobroma grandiflo -rum (Willd. ex Spreng.) K.Schum.], pataxte (Theobroma bicolor Bonpl.), custard apple (Annona cherimola Miller), borojó (Borojoa patinoi Cuatrec.), cacao (Theobroma cacao L.), mango (Mangifera indica L.), and peach palm (Bactris gasipaes
Kunth); Colombian mahogany (Cariniana pyriformis Miers), wild cashew [Anacardium excelsum (Kunth) Skeels], chingale [Jacaranda copaia (Aubl.) D.Don.], and capirona (Capirona decorticans Spruce) are found in low densities.
Forest plantation 1 (FP1)
Agroforestry system implemented for 18 years, and characterized by a predominance of the species Colombian mahogany (Cariniana pyriformis Miers), and some species found at low densities such as cedro (Cedrela odorata L.), Honduran mahogany (Swietenia macrophylla King), carbon (Zygia longifolia [Humb. & Bonpl. ex Willd.) Britton & Rose], bilibil [Guarea guidonia (L.) Sleumer], saman [Samanea saman (Jacq.) Merr.], pink trumpet tree [Tabebuia rosea (Bertol.) DC.], higuerón (Ficus luschnathiana Miq.), and arazá (Eugenia stipitata McVaugh). The system is geographically located near water bodies. Some areas of the system experience floods during periods of maximum precipitation.
Forest plantation 2 (FP2)
Agroforestry system implemented for 18 years, characterized by a predominance of the species black manwood (Minquartia guianensis Aubl.), associated with arazá (Eugenia stipitata McVaugh) and the Amazon tree-grape (Pourouma cecropiifolia
Mart.). The system is geogaphically located near water bodies.
Natural regeneration (NR)
Natural regeneration of 15 years, composed of the species Amazon tree-grape (Pourouma cecropiifolia Mart.), cedro ( Cedre-la odorata L.), laurel (Laurus nobilis), ice cream bean (Inga edulis Mart.), white chilco (Miconia appendiculata Triana), bla-ck chilco (Miconia elata (Sw.) DC.), yarumo (Cecropia peltata L.), and achapo [Cedrelinga cateniformis (Ducke) Ducke].
Silvipastoral system (SSP)
Silvipastoral system established for 13 years, in which the shade trees gamhar (Gmelina arborea Roxb ex Sm.), carbon [Zygia longifolia [Humb. & Bonpl. ex Willd.) Britton & Rose], boca de indio [Piptocoma discolor (Humb., Bonpl. & Kunth) Pruski], and guayabo coronillo (Bellucia pentamera Naudin) were incorporated in pastures in a circular area of 100 m diam-eter. Animals seeking shade and a place to rest frequently concentrate under the tree canopy.
package was used for the PCA and the Monte-Carlo test (Dray et al., 2007), the factoextra and NbClust packages were used for cluster development (Charrad et al., 2014), and the labdsv package for IndVal.
Results and Discussion
The total number of registered individuals was 7,854, from which Isoptera and Hymenoptera were the most abundant (2,937 and 2,241 individuals). Average density per soil sample was 1,496±155 individuals per m2. Twenty-five taxonomic groups were identified, with an average richness per soil sample of 7.8±0.29 taxons. Significant differences were found between land uses (p<0.05); native forest (NF) was different from the rest for total density and richness (Figure 1).
These results indicate that a higher-tree diversity can result in greater heterogeneity and quantity of litter and, consequently, a greater supply of food and microhabitats, as well as better soil conditions and favorable microclimate for macrofauna (Rosa et al., 2015; Korboulewsky et al., 2016). On this subject, Gibson et al. (2011) indicates that there is no substitute for the forest, when it comes to preserving tropical biodiversity.
From the collected soil macrofauna, 78% was found in the first two soil layers, 43% of which was found in the litter, and 35% at 0–10 cm soil depth. This tendency was likewise true for each land use (Figure 2), with depth affecting the distribution of macrofauna
Figure 1. Total density (log) and richness of soil macrofauna in each land use: native forest (NF), shade trees for cultivation (STC), improved fallow (IF), cropping in alleys 1 (CA1), cropping in alleys 2 (CA2), cropping in forest plantation 1 (CFP1), cropping in forest plantation 2 (CFP2), cropping in forest plantation 3 (CFP3), home garden (HG), forest plantation 1 (FP1), forest plantation 2 (FP2), natural regeneration (NR), silvipastoral system (SSP), and pasture (PA), in the Colombian Amazon. Different letters indicate
different levels of significance, by the LSD Fisher test, at
5% probability; and error bars represent standard error.
(Santos et al., 2016). This is possibly due to a decrease of oxygen content, soil organic matter, and root biomass as the soil profile deepens (Pauli et al., 2011). However, NF was significantly different from the other land uses, exhibiting the highest density of soil macrofauna in litter (Figure 2), which coincides with the statements of Negrete-Yankelevich et al. (2007), claiming that soil macrofauna in preserved forests is primarily found in litter, whereas they are more abundant in the soil of disturbed areas.
As to the ecological indexes, while the highest-Shannon’s diversity (H) and Pielou’s evenness (e) values were found in the use of land with natural regeneration (NR), there were no stark differences between this and other land uses (Figure 3). According to Barros et al. (2008), an absence of clear dominance between groups of macrofauna occurs when organic matter input is diversified, which allows of the colonization
of different organisms; this fact relates to NR, which is the use of a young land in the process of recovery.
Although NF exhibited greater richness, the predominance of the Isoptera group in this land use affected evenness in other groups, causing the forest to exhibit low values on the ecological indexes. Similar results were reported by Lima et al. (2010) who, when evaluating the abundance and diversity of macroinvertebrates in different agroecosystems, recorded the lowest values of the diversity and evenness indexes for native forests; this was attributed to the dominance of the Isoptera group. Therefore, a better representation of diversity can be expected when it is measured using the taxonomic richness (Pereira et al., 2017).
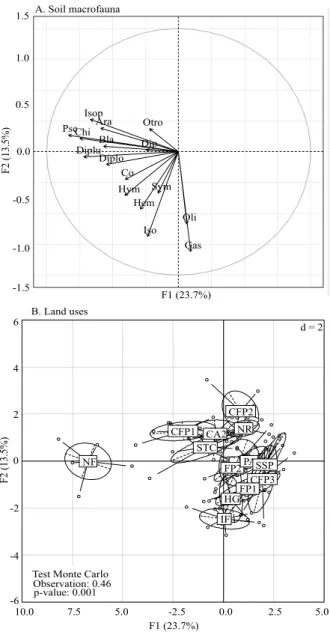
The PCA showed that the first two axes explained 37.2% of the total variability in the data (Figure 4). Axis 1 showed a gradient of macrofauna diversity from left to right, clearly isolating NF as the land use with the greatest soil macrofauna diversity (Figure 4 A). Axis 2 related those land uses with the highest density of Isopoda and Gastropoda, in which the closest one was the improved fallow. According to the Monte-Carlo test, the differences between macrofauna groups in different land uses were significant (46% explained variance, p<0.001).
Some systems, such as silvipastoral system (SSP), cropping in forest plantation 3 (CFP3), and cropping in forest plantation 2 (CFP2), did not exhibit any relationship with macrofauna in the respective factorial plane (F1/F2) of the PCA (Figure 4 B). The SSP, which includes shade trees in pasture, had an indirect impact on macrofauna, possibly due to excessive the trampling of animals searching for shade and a place to rest (Morales-Márquez et al., 2018). The CFP3 system, characterized by seasonal or periodic floods, may have affected macrofauna. According to Coyle et al. (2017), increases of flood frequency and duration generally lead to a decrease of the abundance of soil macrofauna; this is due to periods of hypoxia or anoxia caused by fluctuations of soil humidity levels. In the case of CFP2, low-canopy cover possibly affected macrofauna as reported by Amazonas et al. (2018), who found a positive correlation between canopy cover and macrofauna density (Pearson, p=0.017, r=0.43); this effect occurred in addition to the intense use caused
Figure 5. Cluster dendrogram for density and diversity of soil macrofauna in each land use: native forest (NF), shade trees for cultivation (STC), improved fallow (IF), cropping in alleys 1 (CA1), cropping in alleys 2 (CA2), cropping in forest plantation 1 (CFP1), cropping in forest plantation 2 (CFP2), cropping in forest plantation 3 (CFP3), home garden (HG), forest plantation 1 (FP1), forest plantation 2 (FP2), natural regeneration (NR), silvipastoral system (SSP), and pasture (PA), in the Colombian Amazon.
Figure 4. Projection on the factorial plane F1/F2 of a principal component analysis of the variables of soil macrofauna and sample points grouped according to land use. A, circle of correlation between groups of the following soil macrofauna: Araneae (Ara), Blattodea (Bla), Coleoptera (Col), Chilopoda (Chi), Diplopoda (Diplo), Diptera (Dip), Diplura (Diplu), Gastropoda (Gas), Hymenoptera (Hym), Hemiptera (Hem), Isopoda (Iso), Isoptera (Isop), Oligochaeta (Oli), Pseudoscorpionida (Pse), Symphyla (Sym), and others (other). B, sample arrangement for land use: native forest (NF), shade trees for cultivation (STC), improved fallow (IF), cropping in alleys 1 (CA1), cropping in alleys 2 (CA2), cropping in forest plantation 1 (CFP1), cropping in forest plantation 2 (CFP2), cropping in forest plantation 3 (CFP3), home garden (HG), forest plantation 1 (FP1), forest plantation 2 (FP2), natural regeneration (NR), silvipastoral system (SSP), and pasture (PA), in the Colombian Amazon.
by clearing and herbicide applications (Scoriza et al., 2015).
The cluster analysis grouped three optimal groups according to their capacity to preserve the density and diversity of macrofauna (Figure 5). In the first cluster, NF was the land use that allowed of the greatest preservation of macrofauna. The second cluster was composed of the agroforestry systems home garden (HG), shade trees for cultivation (STC), cropping in alleys 2 (CA2), improved fallow (IF), and cropping in forest plantation 1 (CFP1), indicating that a diversification of vegetal species, a continuous deposit of vegetal residue, and soil without tillage provide a favorable environment for macrofauna diversity (Moço et al., 2010) that, in our study, showed a similar degree of diversity to that of the forest. The remaining eight land uses concentrated in the third cluster, which included pasture (PA), NR, and the other agroforestry systems. It has been proven that the age of the system (Camara et al., 2018), variations in the microclimate caused by absence of a compact canopy (Kamau et al., 2017), the quantity and quality of litter (Oliveira et al., 2018), agricultural practices (Marichal et al., 2014), the use of herbicides (Scoriza et al., 2015), and animal trampling (Morales -Márquez et al., 2018) influence the soil macrofauna. Therefore, we suggest that the unfavorable presence of any of these factors, or Ara
Bla
Co Chi
Diplo Dip Diplu
Gas Hym
Hem
Iso Isop
Oli Pse
Sym Otro
F1 (23.7%) A. Soil macrofauna
F2 (13.5%)
0.0 0.5 1.0 1.5
-0.5
-1.0
-1.5
d = 2
Test Monte Carlo Observation: 0.46 p-value: 0.001
CA1 CA2 CFP1
CFP2
CFP3 FP1 FP2
HG
IF NF
NR
PASSP STC
B. Land uses
F2 (13.5%)
0 2 4 6
-2
-4
-6
0.0 2.5
-2.5 5.0
5.0 7.5 10.0
their combination, in land uses, implied the obtention of average values of macrofauna and their respective grouping in the third cluster.
According to IndVal, five taxonomic groups exhibited significant values (Table 2). The Diplura group was identified as a habitat indicator associated with NF, reflecting the dependence of this group on places with low levels of disturbance. According to Baretta et al. (2011), they reside in humid places, moss, rocks, and litter within the forest. Meanwhile, Socarrás (2013) mentions that due to their morphologic characteristics and trophic role they are considered indicators of stability within soil.
The predators Pseudoscorpionida and Araneae were associated with NF and categorized as detectors of change (Table 2), which coincides with Vasconcellos et al. (2013) who affirm that these individuals are more abundant within natural systems, or in areas at a high level of conservation. The Chilopoda group, a detector of change, was associated with NF. This coincides with Marichal et al. (2014), who state that the density of chilopods is mainly associated with abundance in litter in wooded areas, and with a decreased number with deforestation. Thus, the relationship between forest
and predators indicates a greater structural complexity in vegetation that, in turn, allows of the development of more complexity of trophic structure (Amazonas et al., 2018).
Finally, the taxon Gastropoda was associated with IF and categorized as a detector of change (Table 2). To that effect, Gerlach et al. (2013) mention that this group possesses a low dispersal capacity and will therefore reflect local conditions but not colonization. Consequently, gastropods can be good indicators of the quality of a habitat but not of the first stages of recovery.
The high capacity of the forest for preserving macrofauna diversity was reaffirmed by the IndVal, which provided four taxonomic groups that were significant for this land use. To obtain groups that are indicators means that they are the primary individuals at risk of disappearing as a result of habitat degradation. Meanwhile, groups that are detectors offer valuable information for monitoring the change across time, and can indicate which systems or land uses tend to stimulate macrofauna typical of forests (McGeoch et al., 2002).
Conclusions
1. Land uses affect soil macrofauna; their density and diversity vary with the intensity of land use and land management practices.
2. The agroforestry systems home garden (HG), shade trees for cultivation (STC), cropping in alleys 2 (CA2), improved fallow (IF), and cropping in forest plantation 1 CFP1 – can potentially preserve the density and diversity of soil macrofauna similar to that of the forest.
3. The Diplura, Pseudoscorpionida, Araneae,
Chilopoda, and Gastropoda taxons are associated with preserved sites; the sensitivity of these groups to management practices allows their populations to serve as bioindicators.
References
AMAZONAS, N.T.; VIANI, R.A.G.; REGO, M.G.A.;
CAMARGO, F.F.; FUJIHARA, R.T.; VALSECHI, O.A. Soil
macrofauna density and diversity across a chronosequence of tropical forest restoration in Southeastern Brazil. Brazilian
Journal of Biology, v.78, p.449-456, 2018. DOI:
10.1590/1519-6984.169014. Table 2. Indicator value (IndVal) of the macrofauna groups,
in different land uses, in the Colombian Amazon.
Macrofauna Land uses(1) IndVal p-valor
Araneae NF 0.33 0.003**
Blattodea NF 0.34 0.110ns
Chilopoda NF 0.39 0.005**
Coleoptera PA 0.15 0.943ns
Diptera CA1 0.08 1.000ns
Diplopoda NF 0.29 0.052ns
Diplura NF 0.73 0.003**
Gastropoda IF 0.33 0.022*
Hemiptera CFP3 0.16 1.000ns
Hymenoptera IF 0.25 0.150ns
Isopoda IF 0.24 0.150ns
Isoptera NF 0.29 0.117ns
Oligochaeta CFP3 0.17 0.091ns
Pseudoscorpionida NF 0.68 0.003**
Symphyla PA 0.34 0.076ns
nsNonsignificant; * and **Significant at 5 and 1% probability, respectively,
by the Monte-Carlo test. (1)native forest (NF), pasture (PA), cropping in
BARETTA, D.; SANTOS, J.C.P.; SEGAT, J.C.; GEREMIA, E.V.;
OLIVEIRA FILHO, L.C.I. de; ALVES, M.V. Fauna edáfica e qualidade do solo. In: KLAUBERG FILHO, O.; MAFRA, A.L.;
GATIBONI, L.C. (Ed.). Tópicos especiais em ciência do solo.
Viçosa: Sociedade Brasileira de Ciência do Solo, 2011. p.119-170. BARROS, E.; MAHIEU, J.; TAPIA-CORAL, S.; NASCIMENTO,
A.R.L.; LAVELLE, P. Comunidade da macrofauna do solo na
Amazônia brasileira. In: MOREIRA, F.M.S.; SIQUEIRA, J.O.; BRUSSAARD, L. (Ed.). Biodiversidade do solo em ecossistemas
brasileiros. Lavras: UFLA, 2008. p.171-191.
BLOUIN, M.; HODSON, M.E.; DELGADO, E.A.; BAKER, G.; BRUSSAARD, L.; BUTT, K.R.; DAI, J.; DENDOOVEN, L.; PERES, G.; TONDOH, J.E.; CLUZEAU, D.; BRUN, J.-J.
A review of earthworm impact on soil function and ecosystem services. European Journal of Soil Science, v.64, p.161-182, 2013. DOI: 10.1111/ejss.12025.
BOTTINELLI, N.; JOUQUET, P.; CAPOWIEZ, Y.;
PODWOJEWSKI, P.; GRIMALDI, M.; PENG, X. Why is the
influence of soil macrofauna on soil structure only considered
by soil ecologists? Soil and Tillage Research, v.146, p.118-124, 2015. DOI: 10.1016/j.still.2014.01.007.
CAMARA, R.; SANTOS, G.L. dos; PEREIRA, M.G.; SILVA, C.F. da; SILVA, V.F.V.; SILVA, R.M. Effects of natural Atlantic Forest regeneration on soil fauna, Brazil. Floresta e Ambiente, v.25, e20160017, 2018. DOI: 10.1590/2179-8087.001716.
CHARRAD, M.; GHAZZALI, N.; BOITEAU, V.; NIKNAFS, A.
NbClust: an R package for determining the relevant number of clusters in a data set. Journal of Statistical Software, v.61, p.1-36, 2014. DOI: 10.18637/jss.v061.i06.
COYLE, D.R.; NAGENDRA, U.J.; TAYLOR, M.K.; CAMPBELL, J.H.; CUNARD, C.E.; JOSLIN, A.H.; MUNDEPI, A.; PHILLIPS,
C.A.; CALLAHAM JR, M.A. Soil fauna responses to natural disturbances, invasive species, and global climate change: Current state of the science and a call to action. Soil Biology
and Biochemistry, v.110, p.116-133, 2017. DOI: 10.1016/j.
soilbio.2017.03.008.
DRAY, S.; DUFOUR, A.B.; CHESSEL, D. The ade4 package-II:
Two-table and K-table methods. R News, v.7, p.47-52, 2007.
DUFRÊNE, M.; LEGENDRE, P. Species assemblages and indicator species: the need for a flexible asymmetrical
approach. Ecological Monographs, v.67, p.345-366, 1997. DOI: 10.1890/0012-9615(1997)067[0345:SAAIST]2.0.CO;2.
FROUZ, J.; ROUBÍČKOVÁ, A.; HEDĚNEC, P.; TAJOVSKÝ, K.
Do soil fauna really hasten litter decomposition? A meta-analysis of enclosure studies. European Journal of Soil Biology, v.68, p.18-24, 2015. DOI: 10.1016/j.ejsobi.2015.03.002.
GERLACH, J.; SAMWAYS, M.; PRYKE, J. Terrestrial invertebrates as bioindicators: an overview of available taxonomic groups. Journal of Insect Conservation, v.17, p.831-850, 2013. DOI: 10.1007/s10841-013-9565-9.
GIBSON, L.; LEE, T.M.; KOH, L.P.; BROOK, B.W.; GARDNER, T.A.; BARLOW, J.; PERES, C.A.; BRADSHAW, C.J.A.;
LAURANCE, W.F.; LOVEJOY, T.E; SODHI, N.S. Primary
forests are irreplaceable for sustaining tropical biodiversity.
Nature, v.478, p.378-381, 2011. DOI: 10.1038/nature10425.
ISO. International Organization for Standardization. ISO 23611-5: Soil quality - Sampling of soil invertebrates - Part 5. Sampling and extraction of soil macro-invertebrates. [Geneva], 2011.
KAMAU, S.; BARRIOS, E.; KARANJA, N.K.; AYUKE, F.O.;
LEHMANN, J. Soil macrofauna abundance under dominant tree species increases along a soil degradation gradient. Soil
Biology and Biochemistry, v.112, p.35-46, 2017. DOI: 10.1016/j.
soilbio.2017.04.016.
KORBOULEWSKY, N.; PEREZ, G.; CHAUVAT, M. How tree
diversity affects soil fauna diversity: a review. Soil Biology
and Biochemistry, v.94, p.94-106, 2016. DOI: 10.1016/j.
soilbio.2015.11.024.
LAVELLE, P.; DOLÉDEC, S.; DE SARTRE, X.A.; DECAËNS,
T.; GOND, V.; GRIMALDI, M.; OSZWALD, J.; HUBERT, B.; RAMIREZ, B.; VEIGA, I.; SOUZA, S. de; ASSIS, W.S de;
MICHELOTTI, F.; MARTINS, M.; FEIJOO, A.; BOMMEL,
P.; CASTAÑEDA, E.; CHACON, P.; VELASQUEZ, J.; DESJARDINS, T.; DUBS, F.; GORDILLO, E.; GUEVARA, E.; FONTE S., HURTADO, M. del P.; LENA, P.; LIMA, T.;
MARICHAL, R.; MITJA, D.; MIRANDA. I.; OTERO, T.;
PRAXEDES, C.; POCCARD, R.; ROBERT, P. de; RODRIGUEZ, G.; SANABRIA C.; TSELOUIKO, S.; VELASQUEZ, A.; VELASQUEZ, E.; VELASQUEZ, J. Unsustainable landscapes
of deforested Amazonia: an analysis of the relationships among
landscapes and the social, economic and environmental profiles
of farms at different ages following deforestation. Global
Environmental Change, v.40, p.137-155, 2016. DOI: 10.1016/j.
gloenvcha.2016.04.009.
LAVELLE, P.; RODRÍGUEZ, N.; ARGUELLO, O.; BERNAL, J.; BOTERO, C.; CHAPARRO, P.; GÓMEZ, Y.; GUTIÉRREZ, A.; HURTADO, M. del P.; LOAIZA, S.; PULLIDO, S.X.; RODRÍGUEZ, E.; SANABRIA, C.; VELÁSQUEZ, E.; FONTE,
S.J. Soil ecosystem services and land use in the rapidly changing Orinoco River Basin of Colombia. Agriculture, Ecosystems
& Environment, v.185, p.106-117, 2014. DOI: 10.1016/j.
agee.2013.12.020.
LIMA, S.S. de; AQUINO, A.M. de; LEITE, L.F.C.; VELÁSQUEZ, E.; LAVELLE, P. Relação entre macrofauna edáfica e atributos
químicos do solo em diferentes agroecossistemas. Pesquisa
Agropecuária Brasileira, v.45, p.322-331, 2010. DOI: 10.1590/
S0100-204X2010000300013.
MARICHAL, R.; GRIMALDI, M.; FEIJOO, A.M; OSZWALD,
J.; PRAXEDES, C.; RUIZ COBO, D.H.; HURTADO, M. del P.; DESJARDINS, T.; SILVA JUNIOR, M.L. da .;, COSTA,
L.G. da S.; MIRANDA, I.S.; OLIVEIRA, M.N.D.; BROWN,
G.G.; TSÉLOUIKO, S.; MARTINS, M.B.; DECAËNS, T.; VELASQUEZ, E.; PATRICK, L. Soil macroinvertebrate
communities and ecosystem services in deforested landscapes of Amazonia. Applied Soil Ecology, v.83, p.177-185, 2014. DOI: 10.1016/j.apsoil.2014.05.006.
MCGEOCH, M.A.; VAN RENSBURG, B.J.; BOTES, A. The verification and application of bioindicators: a case study of dung
beetles in a savanna ecosystem. Journal of Applied Ecology, v.39, p.661-672, 2002. DOI: 10.1046/j.1365-2664.2002.00743.x.
Relationships between invertebrate communities, litter quality and soil attributes under different cacao agroforestry systems in the south of Bahia, Brazil. Applied Soil Ecology, v.46, p.347-354, 2010. DOI: 10.1016/j.apsoil.2010.10.006.
MORALES-MÁRQUEZ, J.A.; HERNÁNDEZ-HERNÁNDEZ, R.M.; SÁNCHEZ, G.K.; LOZANO, Z.; CASTRO, I.; BRAVO, C.; RAMÍREZ, E.; JIMÉNEZ-BALLESTA, R. Soil
macroinvertebrates community and its temporal variation in a well-drained savannah of the Venezuelan Llanos. European
Journal of Soil Biology, v.84, p.19-26, 2018. DOI: 10.1016/j.
ejsobi.2017.11.002.
NEGRETE-YANKELEVICH, S.; FRAGOSO, C.; NEWTON, A.C.; HEAL, O.W. Successional changes in soil, litter and macroinvertebrate parameters following selective logging in a Mexican Cloud Forest. Applied Soil Ecology, v.35, p.340-355, 2007. DOI: 10.1016/j.apsoil.2006.07.006.
OLIVEIRA, P.H.G.; RODRIGUES, A.C.; GAMA-RODRIGUES, E.F.; SALES, M.V.S. Litter and soil-related
variation in functional group abundances in cacao agroforests using structural equation modeling. Ecological Indicators, v.84, p.254-262, 2018. DOI: 10.1016/j.ecolind.2017.08.030.
PAULI, N.; BARRIOS, E.; CONACHER, A.J.; OBERTHÜR,
T. Soil macrofauna in agricultural landscapes dominated by the
Quesungual Slash-and-Mulch Agroforestry System, western
Honduras. Applied Soil Ecology, v.47, p.119-132, 2011. DOI: 10.1016/j.apsoil.2010.11.005.
PEREIRA, J. de M.; SEGAT, J.C.; BARETTA, D.; VASCONCELLOS, R.L. de F.; BARETTA, C.R.D.M.; CARDOSO, E.J.B.N. Soil macrofauna as a soil quality indicator in native and replanted Araucaria angustifolia forests. Revista
Brasileira de Ciência do Solo, v.41, e0160261, 2017. DOI:
10.1590/18069657rbcs20160261.
R CORE TEAM. R: A language and environment for statistical computing. Vienna: R Foundation for Statistical Computing, 2017. Available at: <http://r-project.org>. Accessed on: Aug. 27 2017.
ROSA, M.G. da; KLAUBERG FILHO, O.; BARTZ, M.L.C.; MAFRA, A.L.; SOUSA, J.P.F.A. de; BARETTA,
D. Macrofauna edáfica e atributos físicos e químicos em
sistemas de uso do solo no Planalto catarinense. Revista
Brasileira de Ciência do Solo, v.39, p.1544-1553, 2015. DOI:
10.1590/01000683rbcs20150033.
ROUSSEAU, L.; FONTE, S.J.; TÉLLEZ, O.; VAN DER HOEK,
R.; LAVELLE, P. Soil macrofauna as indicators of soil quality and land use impacts in smallholder agroecosystems of western Nicaragua. Ecological Indicators, v.27, p.71-82, 2013. DOI: 10.1016/j.ecolind.2012.11.020.
SANTOS, D.P.; SANTOS, G.G.; SANTOS, I.L. dos; SCHOSSLER,
T.R.; NIVA, C.C.; MARCHÃO, R.L. Caracterização da macrofauna edáfica em sistemas de produção de grãos no Sudoeste
do Piauí. Pesquisa Agropecuária Brasileira, v.51, p.1466-1475, 2016. DOI: 10.1590/S0100-204X2016000900045.
SCORIZA, R.N.; SILVA, A. de P.; CORREIA, M.E.F.; LELES, P.S. dos S.; RESENDE, A.S. de. Efeito de herbicidas sobre a biota
de invertebrados do solo em área de restauração florestal. Revista
Brasileira de Ciência do Solo, v.39, p.1576-1584, 2015. DOI:
10.1590/01000683rbcs20150096.
SOCARRÁS, A. Mesofauna edáfica: indicador biológico de la
calidad del suelo. Pastos y Forrajes, v.36, p.5-13, 2013.
VASCONCELLOS, R.L.F.; SEGAT, J.C.; BONFIM, J.A.; BARETTA, D.; CARDOSO, E.J.B.N. Soil macrofauna as an indicator of soil quality in an undisturbed riparian forest and recovering sites of different ages. European Journal
of Soil Biology, v.58, p.105-112, 2013. DOI: 10.1016/j.
ejsobi.2013.07.001.
VELÁSQUEZ, E.; FONTE, S.J.; BAROT, S.; GRIMALDI, M.;
DESJARDINS, T.; LAVELLE, P. Soil macrofauna-mediated impacts of plant species composition on soil functioning in Amazonian pastures. Applied Soil Ecology, v.56, p.43-50, 2012. DOI: 10.1016/j.apsoil.2012.01.008.
WALL, D.H.; BARDGETT, R.D.; BEHAN-PELLETIER, V.; HERRICK, J.E.; JONES, T.H.; RITZ, K.; SIX, J. S TRONG, D.R.;
VAN DER PUTTEN, W.H. (Ed.). Soil ecology and ecosystem
services. Oxford: Oxford University Press, 2012. 405p. DOI:
10.1093/acprof:oso/9780199575923.001.0001.