UNIVERSIDADE NOVA DE LISBOA
FACULDADE DE CIÊNCIAS E TECNOLOGIA
DEPARTAMENTO DE QUÍMICA
Ana Margarida Gonçalves Carvalho Dias
Development of an Affinity Pair “Tag-Receptor” for
Recombinant Protein Expression and Purification
Dissertação apresentada para a obtenção do Grau de Mestre em Biotecnologia, pela Universidade
Nova de Lisboa, Faculdade de Ciências e Tecnologia
Orientadoras:
Prof.ª Doutora Ana Cecília Roque Doutora Ana Sofia Coroadinha
LISBOA
UNIVERSIDADE NOVA DE LISBOA
FACULDADE DE CIÊNCIAS E TECNOLOGIA
DEPARTAMENTO DE QUÍMICA
Ana Margarida Gonçalves Carvalho Dias
Development of an Affinity Pair “Tag-Receptor” for
Recombinant Protein Expression and Purification
Orientadoras:
Prof.ª Doutora Ana Cecília Roque Doutora Ana Sofia Coroadinha
LISBOA
ACKNOWLEDGMENTS:
In this year, I have been developing my master thesis, I would like to thank to my coordinator Cecília Roque for the guidance and encouragement. Also, thanks for opening my scientific horizons, since I had contact with different scientific areas and techniques, and to challenge myself to take further steps in my academic formation.
I would like to acknowledge my colleagues in the Biomolecular Engineering Laboratory (FCT-UNL) for the good work environment, helpful discussion as well as the enthusiasm of making science. Particularly to Ana Pina, who helped me in the development of the thesis, by spending part of her time teaching the methods and responding to my doubts and for the helpful discussion of the results; but also to make the work environment more friendly and fun, even in the more stressful moments.
During this year I had the possibility to expand my knowledge in mammalian cells culture and in molecular biology methods, for that was important the work that I developed in Cell Line Development and Molecular Biotechnology Laboratory (ITQB-UNL) coordinated by Ana Coroadinha, who I would like to thank for the disponibility to teach the methods and the discussion of the results. To the other members of this group, specially my master colleagues, that made me feel welcome and were helpful in everything I needed, I would like to express my gratefulness.
Finally, I would specially acknowledge to my parents that have been my backup throughout my years of study. They have been my support and inspired me to develop my academic knowledge and skills but also help me grow as a person. They demonstrate that hard work and perseverance compensate.
ABSTRACT:
The main objective of this work was the development of an affinity pair for the purification of recombinant proteins.
In this work, ligands based on the Ugi Reaction and the 1,3,5-Triazine scaffold were synthesised in solid-phase and screened for binding to an affinity tag, an hexapeptide constituted by asparagine aminoacid (N). The ligands were tested against pure solutions of the hexapeptide and Green Fluorescence Protein (GFP), used as a model protein. The ligands that had the highest affinity for the hexapeptide and lowest affinity for the protein were selected for further studies with cellular extracts. The cellular extracts were produced in HEK 293T cells transfected with two designed vectors: one containing the GFP tagged with the affinity tag, and the other containing GFP without tag. The efficient expression of a recombinant GFP fused with the designed affinity tag was demonstrated. The cellular extracts were then loaded onto chromatographic columns containing the lead ligands immobilised onto agarose, and the amount of total protein and GFP bound and eluted noted. The results demonstrated that the Ugi ligands were less selective than the Triazine ligands for the hexapeptide. The triazine ligand 7,4 has been considered as the most selective for the designed affinity tag.
In addition, preselected lead ligands for another hexapeptide (RW) of interest were studied. Mammalian cells HEK 293T were transfected with a vector expressing for GFP tagged with this peptide. The ligands immobilized onto agarose were loaded with cellular extracts, being noted that the lead A6C3 showed a high selectivity for the tag tested.
RESUMO:
Este trabalho teve como objectivo o desenvolvimento de um par de afinidade para purificação de proteínas recombinantes.
pura de hexapéptido e a “Green Fluorescence Protein” (GFP), proteína modelo. Os ligandos que tinham maior afinidade para o hexapéptido foram seleccionados para estudos com extractos celulares. Os extractos celulares foram produzidos em células HEK 293T, células animais que foram transfectadas com dois vectores: um a GFP recombinante com uma cauda de afinidade e outro com GFP. Foi demonstrado que é possível produzir GFP recombinante com cauda de afinidade funcional.
Os resultados demonstraram que os ligandos do Ugi são menos selectivos do que os da Triazina para o péptido. O ligando 7,4 da biblioteca da triazina demonstrou mais afinidade para o hexapéptido.
CONTENTS:
ACKNOWLEDGEMENTS v
ABSTRACT vi
CHAPTER 1 - INTRODUCTION
1.1Production of Recombinante Proteins 1 1.2 Purification of Recombinant Proteins 2 1.3 Affinity Ligands for Bioseparation Processes 3 1.4 Affinity Tags in Protein Separation 6
1.5 Aims and Objectives 8
CHAPTER 2 – MATERIALS AND METHODS
2.1 Materials 9
2.2 Methods
2.2.1 Synthesis of a Ligand Library based on the Ugi Reaction
2.2.1.1 Epoxy Activation of Sepharose CL-6B 12 2.2.1.2 Cis-diol Activation of the Epoxy-activated Support 12 2.2.1.3 Aldehyde Functionalization of the Activated Support 12 2.2.1.4 Solid-phase Synthesis of Ugi Library 13 2.2.2 Synthesis of Ligands Library based Triazine Scaffold
2.2.2.1 Amination of the epoxy-activated support 16 2.2.2.2 Triazine Library Synthesis 17 2.2.3 Ligands Screening with Hexapeptide NN and GFP
2.2.3.1 Screening with Hexapeptide NN 19 2.2.3.2 Screening with Green Fluorescent Protein 20 2.2.4 Scale-up Synthesis and Screening of the Lead Ligands 20 2.2.4.1 Scale-up Screening of the Ligands with the Hexapeptide NN 21 2.2.5 Molecular Modelling Studies – Possible Lead Ligands in silico 22 2.2.6 Solution Phase Synthesis and Characterization of Ugi Ligand, A6C5 22
2.2.7 Ligands Nomenclature 23
2.2.8 Expression in Mammalian Cells
2.2.8.1 Amplification of the vectors pRWTagMGFP and p6NTag
2.2.8.1.1 E.coli GT115 Competent cells Transformation 23 2.2.8.1.2 Isolation and Purification of cDNA from E.coli 24 2.2.8.1.3 Spectrophotometric Quantification of cDNA 24 2.2.8.1.4 Enzymatic Modifications of cDNA 24
2.2.8.1.5 Electrophoresis 24
2.2.8.2 Construction of vector p6NTagMGFP
2.2.8.2.1 Extraction and Purification of DNA from Agarose Gels 25 2.2.8.2.2 Dephosphorylation of a Vector 26
2.2.8.2.3 DNA Ligation 26
2.2.8.2.5 Purification in Small Scale of the plasmid DNA and confirmation of the
correct ligation 26
2.2.8.2.6 Enzymatic Modification of plasmid DNA 27 2.2.8.3 Amplification of vector pMDISGFP 27 2.2.9 Transfection of Mammalian Cells pRWTagMGFP, p6NTagMGFP and pMDISGFP 27 2.2.10 Extraction and Quantification of Proteins from Cellular Extracts
2.2.10.1 Quantification of Proteins in the Cellular Extract 28 2.2.11 Ligands Scale-up Screening with the Cellular Extracts 28 2.2.11.1 SDS-PAGE of the Purified Samples 29 2.2.12 Analytical Assays
2.2.12.1 Determination of the Epoxy Content 30 2.2.12.2 Tollens Test for the Qualitative Analysis of the Aldehydes 30 2.2.12.3 Determination of the Amination Extension by the Kaiser test 30 2.2.12.4 BSA assay for the quantification of Peptide and Proteins 31
CHAPTER 3 - COMBINATORIAL LIBRARIES FOR AN AFFINITY TAG
3.1. Solid-phase Synthesis of Combinatorial Libraries of Affinity Ligands 32 3.1.1 Screening of Ligands with Hexapeptide NN and GFP 34 3.1.2 Scale-up Synthesis and Screening of Possible Lead Ligands 39 3.1.4 Automated Docking Studies 42
3.1.5 Conclusions 48
CHAPTER 4 – EXPRESSION IN MAMALIAN CELLS
4.1 Amplification, Construction and Purification of Vectors 49 4.2 Transfection of HEK 293T cells 50
4.3 Conclusions 53
CHAPTER 5 – CHARACTERIZATION OF POSSIBLE LEAD LIGANDS
5.1 Screening of Ligands with Cellular Extracts 55 5.2 SDS-PAGE Analysis
5.2.1 Ligands for Hexapeptide RW 61
5.2.2 Ligands for Hexapeptide NN 63
5.3 Characterization of the Lead Ligands
5.3.1 Hexapeptide RW Lead Ligand 68 5.3.2 Hexapeptide NN Lead Ligands 69
5.4 Conclusions 70
CHAPTER 6 – CONCLUSIONS AND FUTURE WORK 73
CHAPTER 7 – REFERENCES 75
APPENDIX
INDEX OF FIGURES
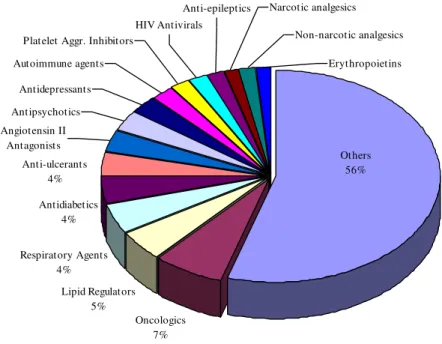
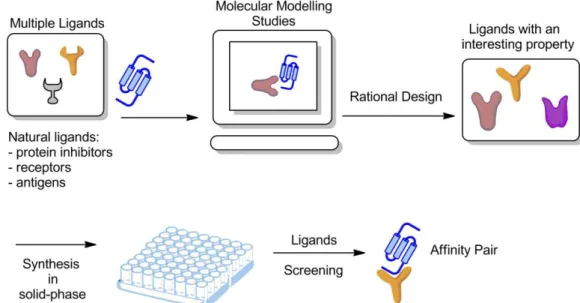
Figure 1.1 - Top 15 Medicine Sales 2009, adapted from report of (Midas 2009) 1 Figure 1.2 – Strategy to develop an affinity ligand using rational design. First step is the discovery of a property of interest and develop a ligand using molecular modelling studies; synthesis in solid-phase of ligands with the property of interest; finally, screening of the ligands with the molecule of interest, e.g. protein; development of an affinity pair (ligand – molecule).
4
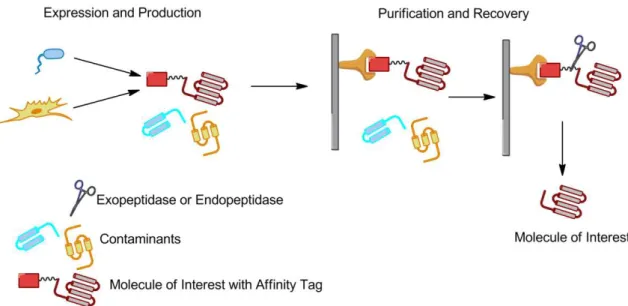
Figure 1.3 – Expression of fused protein in different hosts, purification and recovery of the fused protein using an Affinity Tag with a sequence for recognition of an enzyme. This sequence is used for remove the affinity tag from the protein.
7
Figure 2.1 - Reaction of Activation of the Sepharose CL-6B with epoxy group and preparation for activation with an aldehyde group. 12 Figure 2.2 - Reaction of the functionalization of the support with aldehyde group. 12
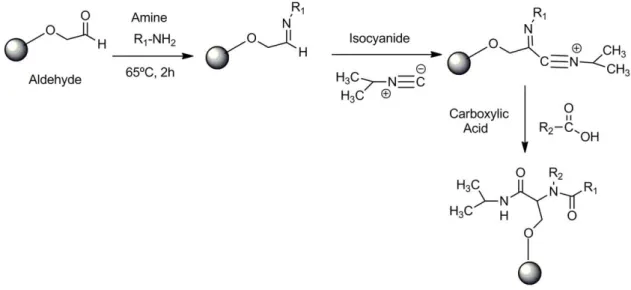
Figure 2.3 - Ugi Reaction, the functionalized support with aldehyde is the base of the reaction; the second compound is an amine that reacts for two hours to let the formation of the imine group. After that the isocyanide and the carboxylic acid is added. Reaction continues for 48h.
13
Figure 2.4 - Chemical Structures of the A) Amines and B) Carboxylic Acids for Ugi Reaction
Library. 14
Figure 2.5 - Ugi Combinatorial 64 Ligands Library. Strategy to add Amines and Carboxylic
acids to construct the library. 15
Figure 2.6 – Activation of the Sepharose CL-6B with epoxy groups and amine groups. 16
Figure 2.7 – Activation of the 1,3,5-Triazine based ligands, by addition of the cyanuric
chloride. 17
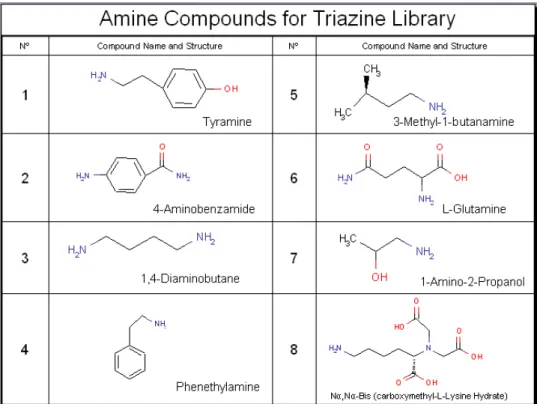
Figure 2.8 – Chemical structure of the amines used in the synthesis of the Triazine library. 17
Figure 2.9 - Triazine Combinatorial 64 Ligands Library. Strategy to add amines in the Nucleophilic Substitution R1 and Nucleophilic Substitution R2. 18 Figure 2.10 - Nucleophilic Substitutions of the positions 1 and 3 of the Triazine ring. 18
Figure 2.11 - Construction of the vector p6NTAgMGFP, that expresses in mammalian cells the fused protein GFP tagged with Hexapeptide NN. To construct this vector were used the pRWTagMGFP and the p6NTag vectors.
25
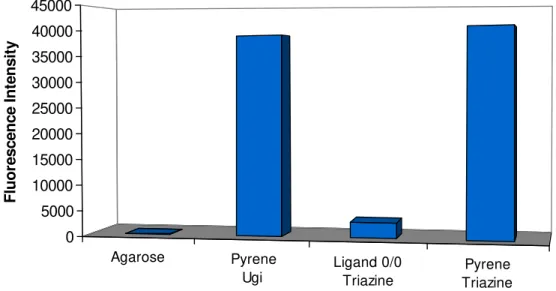
Figure 3.1 - Fluorescence Intensity of Pyrene Control Ligand Synthesized by Ugi and
Triazine Reaction. 33
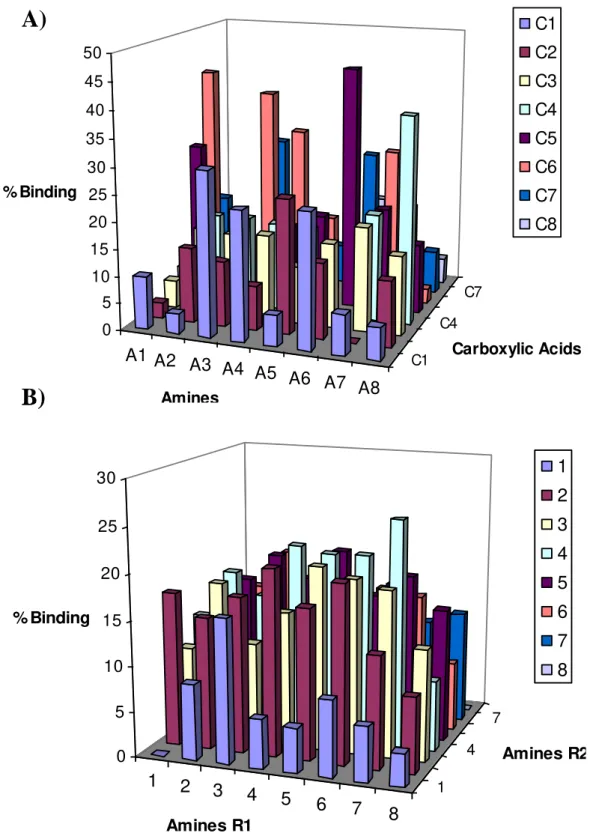
Figure 3.2 - Samples of Agarose (Left) and Pyrene Control Ligand (Right) Synthesized by Ugi Reaction illuminated with a UV transilluminator (290-365nm). 33 Figure 3.3 - Results of the screening of the combinatorial libraries with the Hexapeptide NN: A) Ugi ligands and B) Triazine based Ligands. 35 Figure 3.4 - Structures of the ligands: A) Ugi ligands and B) Triazine based ligands. 36
Figures 3.5 - Results of the screening of the combinatorial libraries with the GFP: A) Ugi ligands and B) Triazine based Ligands. 37 Figure 3.6 - Ratio between the Number of Mols Hexapeptide:GFP bonded to the solid-phase ligands A) Ugi ligands and B) Triazine based Ligands. 38 Figure 3.7 – Strategy for the detection of lead ligands 39
Figure 3.10 - Structure of the Affinity Tag used in silico studies A) (Hexapeptide +3xProlines + Enterokinase Recognition Sequence); B) Example of docking result between a ligand and the affinity tag.
43
Figure 3.11 – Subunit A of GFP (1W7S, PDB code): A – Structure and B) Structure with the cavities the cavities determined. 44 Figure 3.12 - The larger cavity of GFP Subunit A with the aminoacids identified. 44
Figure 3.13 – Typical docking between the subunit A and a ligand. 45
Figure 3.14 – Correlation between the experimental assays and the automated scores. 47
Figure 4.1 – Strategy for transfection of HEK 293T cells for production of a fused
recombinant protein. 51
Figure 5.1 – Strategy to screen and select the lead ligands with cellular extracts 55
Figure 5.2 – Production and purification of a fused protein. The affinity and selectivity of the ligands in the purification step is important for the final yield of the fused protein. 56 Figure 5.3 - Comparison between the cellular extracts of mammalian cells screened with hexapeptide RW ligands: A) Results of Ratio of Total Protein Mass: Support Mass and B) Results of Ratio GFP Mass: Support Mass.
57
Figure 5.4 - Comparison between the cellular extracts of mammalian cells screened with Ugi Ligands for the hexapeptide NN: A) Results of Ratio of Total Protein Mass: Support Mass and B) Results of Ratio GFP Mass: Support Mass.
58
Figure 5.5 - Comparison between the cellular extracts of mammalian cells screened with Triazine Ligands for the hexapeptide NN: A) Results of Ratio of Total Protein Mass: Support Mass and B) Results of Ratio GFP Mass: Support Mass.
60
Figure 5.6 - 1D SDS-PAGE analysis of samples from the first wash with PBS, hexapeptide RW ligands. A) Columns Screened with GFP tagged RW cellular extracts, LS1 – Loaded Sample; B) Columns Screened with PC cellular extracts, LS2 – Loaded Sample; C) Columns screened with NC cellular extracts, LS3 – Loaded Sample.
D) Samples from chromatographic columns with resin activated with ligand A6C3 and screened with different cellular extracts. Column screened with GFP tagged RW: LS1 – Loaded Sample with GFP tagged RW; FT- Flow through sample; W1 – First wash with PBS; W2 – Second Wash with PBS. Column screened with PC cellular extracts: LS2 – Loaded Sample PC cellular extracts; W1 – First wash with PBS; W2 – Second Wash with PBS. Column screened with NC cellular extracts: LS3 – Loaded Sample NC cellular extracts; W2 – Second Wash with PBS. Marker – LMW marker
62
Figure 5.7 – 1D SDS-PAGE analysis of hexapeptide NN ligands (Ugi Reaction) samples. The samples loaded in the gel were represented the first wash with PBS after the screening of the ligands with different cellular extracts: A) Ligands columns were screened with GFP tagged NN cellular extracts, LS1 – Loaded Sample; B) Ligands columns were screened with PC cellular extracts, LS2 – Loaded Sample; C) Ligands columns were screened with NC cellular extracts, LS3 – Loaded Sample. Marker – LMW marker.
64
Figure 5.8 – 1D SDS-PAGE analysis of hexapeptide NN ligands (Triazine based Reaction) samples. The samples loaded in the gel were represented the first wash with PBS after the screening of the ligands with different cellular extracts: A) Ligands columns were screened with GFP tagged NN cellular extracts, LS1 – Loaded Sample; B) Ligands columns were screened with PC cellular extracts, LS2 – Loaded Sample; C) Ligands columns were screened with NC cellular extracts, LS3 – Loaded Sample. Marker – LMW marker.
66
Figure 5.9 – 1D SDS-PAGE Results for the following loaded samples: 1) TurboGFP (1µg/µl) (Evrogen), 2) Loaded Sample Cellular Extracts GFP tagged RW; 3) Loaded Sample cellular extracts GFP tagged NN; 4) Loaded Sample cellular extracts PC (GFP without tag); 5) Loaded Sample cellular extracts NC (cellular extract without GFP).
Figure 5.10 - Structure of ligand A6C3. 68
Figure 5.11 - Structure of Ligand A6C5. 69
Figure 5.12 – Structures of the Triazine based ligands: A) 6,3 ligand and B) 7,4 ligand. 70
INDEX OF TABLES
Table 1.1 – Affinity tags commonly used for purification of recombinant proteins. 7 Table 2.1 – Vectors used during the work 10 Table 2.2 – Selected lead ligands for the hexapeptide NN and RW. 21 Table 3.1 - Summary of the possible lead ligand for binding to Hexapeptide NN selected. 39 Table 3.2 - Areas of the Cavities in the Subunit A 44 Table 3.3 – Results of the docking studies for the Ugi Ligands between GFP or the Affinity
Tag. 46
Table 4.1 - The transfection results and the confluence of the culture. 51 Table 4.2 - Transfection Results (24h and 48h post transfection) for cells transfected with p6NTagMGFP and pMDISGFP. Compared with “untransfected cells” The Magnification of the images is 20x.
52
Table 4.3 – Results of the extraction of proteins from 293T cells. 53 Table 5.1 - Concentration of the loading samples for each cellular extracts, in Total Protein
and GFP 56
INDEX OF ABREVIATIONS a.a. - aminoacids
Amp - Ampicillin Arg - Arginines
Asn – Asparagines (N) Asp – Aspartic Acid
Ax, By – Ligand based on the Ugi Multicomponent Reaction (A – Amine, B – Carboxylic acid) (X, Y) – Amine X (R1), Amine Y (R2) – Triazine scaffold based ligands
BSA – Bovine Serum Albumine cDNA – circular DNA, a vector [DNA]f –Final Concentration of DNA Eq - equivalents
E. coli – Escherichia coli
FITC – Fluorescein Isothiocyanate GFP – Green Fluorescent Protein
Hexapeptide NN – hexapeptide composed by asparagines (N)
Hexapeptide RW – hexapeptide composed by 3 tryptophan (W) and 3 arginines (R) HEK293T cells – Human Embryonic Kidney cells
His-Tag – Histidine Affinity Tag
LMW Marker – Low Molecular Weight SDS Calibration Kit mAb – Monoclonal Antibody
NMR – Nuclear Magnetic Resonance PBS – Phosphate Buffered Solution PEI - Polyethylenimine
PSA - Ammonium Persulphate
pRWTagMGFP – Vector that expresses fused GFP with a hexapeptide RW Affinity Tag p6NTagMGFP – Vector that expresses fused GFP with a hexapeptide NN Affinity Tag pMDISGFP – Vector that expresses GFP without Affinity Tag
TAE – Tris-Acetate (EDTA) buffer
TEMED - N,N,N,N-Tetramethylethylenediamine TLC – Thin Layer Chromatography
CHAPTER 1 - INTRODUCTION
1.1
Production of Recombinant Proteins
In recent years important therapeutics as proteins drugs, monoclonal antibodies (mAbs), enzymes, interferons or vaccines, have been developed. The medical areas in expansion regarding the search for new biotherapeutics are the cancer, followed by the infections diseases (PhaRM 2008).
Figure 1.1- Top 15 Medicine Sales 2009, adapted from report of (Midas 2009)
In 2009 the market of pharmaceutics was estimated in 75202 US$. The oncologic therapeutics alone accounted for 52372 US$ (7% of the market). The second most rentable medicines were the lipid regulators, they were evaluated in 35281US$ (5% of the market). The infectious drug related diseases represented 13758 US$ (2% of the market) (Figure 1.1) (Midas 2009).
If in the past, some protein drugs (e.g. insulin) were produced from scarce animal sources, the technology of recombinant DNA allowed for the production of larger amounts of proteins in order to deal with the market demand. The industry started using recombinant proteins that were expressed in bacteria, mainly in E. coli (Graumann and Premstaller 2006), or even more recently mammalian cells – Chinese hamster ovary (CHO) cells, mouse myeloma cells or human embryo kidney cells (HEK-293) (Gupta and Lee 2007; Seth et al. 2007). The main interests in bacterial expression systems are the high growth level, easiness of manipulation,
Oncologics 7% Lipid Regulators
5% Respiratory Agents
4%
Others 56% Anti-ulcerants
4% Antidiabetics
4%
Erythropoietins Non-narcotic analgesics Narcotic analgesics
Anti-epileptics HIV Antivirals
Platelet Aggr. Inhibitors Autoimmune agents
Antidepressants Antipsychotics Angiotensin II
CHAPTER 1 - INTRODUCTION
wide implementation of expression vectors and experimental methods, as well as high productivity rates (Graumann and Premstaller 2006). However, these organisms do not make complex post-translational modifications in proteins, as glycosylation, phosphorylation, misfolding, oxidation and deamination of aminoacids, and proteolysis (Jenkins et al. 2008). These modifications are fundamental for secretion, stability and efficiency of the therapeutic drug, in order to avoid immune system responses.
Mammalian cells cultures are able to produce more complex biotherapeutics as proteins from eukaryotic sources that need glycosylation (Sevastsyanovich et al. 2009). Despite of these advantages, these hosts present lower growth rates, require specific culture medium and laboratorial technological requisites. Furthermore, the time to develop a cell line producing a therapeutic product at an acceptable yield is longer than in bacteria (Seth et al. 2007). These factors have increased the production costs but with the demand of biotherapeutics for chronic diseases, which require high doses, the production level in mammalian has progressively improved and nowadays it can reach up to 5g/l (Shukla and Thömmes 2010). In consequence, the pressure has passed from the production methods to the downstream processes (purification and polishing).
1.2
Purification of Recombinant Proteins
The downstream processing is responsible for 50% to 80% of the total cost of production for a recombinant protein, particularly when the purity required for the final product is very high. To introduce a product in the market is necessary to insure its quality, safety and efficacy, which is related with product purity (Clonis 2006).
CHAPTER 1 - INTRODUCTION
two-phase systems (Roque et al. 2007), crystallization and magnetic separations (Low et al. 2007) are becoming more popular.
1.3
Affinity Ligands for Bioseparation Processes
To improve the efficacy, affinity and selectivity of affinity-based purification methods, new resins have been developed. There have been progresses in the design of affinity ligands to increase the purification of different biomolecules. These ligands can be classified as biological or synthetic. The former take advantage of the natural affinity, like antibody-antigen, e.g. Protein A and IgG, these ligands can be classified as biospecific (Roque et al. 2007). As consequence of their biological origin the costs of production and purification are high. Also ligand leaching can occur causing contamination of the end product and the sanitization of the resins is limited, due to the possibility of ligands degradation. To overcome these disadvantages, these ligands were resynthesized to maintain their good features and improve their strength against degradation, and can be described as pseudospecific (Roque et al. 2007). More recently fully synthetic ligands have been developed, nevertheless possess similar features to the biological ligands, e.g. de novo designed, but also ligands that are bioengineered, e.g. peptides or small protein domains; they can be named biomimetic ligands (Roque et al. 2007).
Biomimetic ligands are usually synthesized based on the knowledge of the structure of the target protein and some important interactions that can occur in nature with other proteins or natural ligands. By using the knowledge about the structure of the target protein it is possible to construct a ligand, study the possible binding interactions between them (in silico), and then construct a library of ligands that have interesting features and can have different affinity and selectivity to the target protein (Clonis 2006).
This technique uses Molecular Modelling softwares, to understand the interactions between ligands and the molecule of interest (protein, antibody or peptide) (Forster 2002). Nowadays, there are structure databases with information about known protein structures, e.g. Protein Data Bank that are essential for these studies (Smith and Sternberg 2002).
CHAPTER 1 - INTRODUCTION
energy of the conformation between the ligand and the protein, the more favourable is the interaction (Thomsen and Christensen 2006).
In silico studies can therefore direct the search for ligands with the desired properties as chemical structure, functional groups, hydrophobicity or possibility to form hydrogen bonds, polarity, and charge. Other advantage of this rational design is the lowering of the cost and time consuming in experimental resources, during synthesis and screening (Davies et al. 2006). Even though in silico results are important, they are only a first step in the process of new ligands development, since the results must be demonstrated by experimental data (Figure1.2).
The next step, involves the synthesis of libraries of ligands. The libraries are normally synthesized in a solid-support - the resin, that should be chemical stable, have good mechanical strength and low non-specific adsorption, should maximize the surface area for the target product and, at the same time, have low surface for contaminants (Tozzi et al. 2003). The materials normally used are: natural polymers (e.g. agarose, cellulose or cross-linked dextran), synthetic polymers (e.g. polyacrylamide), or inorganic materials (e.g. silica) (Tozzi et al. 2003). Each support has different functional groups, therefore to choose the support is necessary to analyse each functional groups are interesting to start the activation and functionalization of the support.
CHAPTER 1 - INTRODUCTION
The functionalization of the support can be based in combinatorial chemistry. Combinatorial chemistry is one method for the synthesis of libraries of compounds, by using reactions involving multi-component condensations, as one-pot reactions. In these reactions the core structure is kept constant in all ligands although the lateral groups can be changed which gives variability to the library of ligands, even though the characteristic of interest can be maintained (Armstrong et al. 1996; Dömling 2006).
An example of one-pot reactions is the Ugi-four component reaction, which combines an aldehyde, amine, isocyanide and a carboxylic acid compound (Ugi 2001). By changing one of the compounds or the four compounds it is possible to generate libraries with different number of ligands. This reaction has been used for the synthesis of different ligands, as a cysteine protease inhibitor (Nakamura et al. 2000); serine protease thrombin inhibitor (Illgen et al. 2000); drug discovery (Akritopoulou-Zanze 2008); or affinity ligands for separation of immunoglobulins (Haigh et al. 2009).
Another type of quite popular for combinatorial chemistry are the 1,3,5-Triazine based ligands. These ligands mimic the binding of natural anionic heterocyclic substrates like nucleic acid, nucleotides, coenzymes or vitamins in consequence they have high affinity for proteins (Lowe 2001). The libraries are simple to construct and take advantage of the temperature to sequentially substitute the chloride atoms by different nucleophiles (Lowe et al. 2001). These groups can be synthesized in supports with amino or hydroxyl groups (Palanisamy et al. 2000). In addition, the nitrogen atoms that are electron-rich can form hydrogen bonds with aminoacids in the binding site of the target protein(Labrou 2003). Some triazine based affinity ligands have been developed for purification of recombinant insulin precursor MI3 purification (Sproule et al. 2000); antibodies (Roque et al. 2005); anti-human immunodeficiency virus 2F5 (mAb 2F5) (Platis et al. 2006); human tissue plasminogen activator (Wu and Yu 2007); or human anti-HIV mAb 4E10 (Platis et al. 2009).
CHAPTER 1 - INTRODUCTION
mass spectrometry. The fluorescent methods explore intrinsic properties of some proteins, that possess aromatic aminoacids residues e.g. tryptophan, tyrosine, phenylalanine. The Green Fluorescent Protein (GFP) from Aequorea victoria is a particular case because the fluorescence is due to a chromophore (Thor et al. 2005). The GFP is used as a protein model in several studies including: genetics (e.g. demonstrate the expression of a new vector or gene expression marker (Inouye and Tsuji 1994;Zhuang et al. 2008)); affinity chromatography (by fusion with tags to confirm affinity and selectivity of ligands in solid support for the tag), or in cell biology, to understand cellular mechanisms (Chung et al. 2009). There are small molecules (e.g. fluorescein isothiocyanate (FITC)) that can be conjugated with a target protein and then used on the screening of the affinity ligands, which as proved to be an inexpensive technique (Roque et al. 2004). The methods that use fluorescence are normally more sensitive, less expensive and less time consuming than the colorimetric assays, as they do not requires reagents.
1.4
Affinity Tags in Protein Purification
As a result of the difficulty of developing affinity ligands for each specific protein, other purification strategies have been found. Small peptides can be fused with the target protein and after the expression purified in a chromatographic column containing an affinity ligand specific for the small peptide (Waugh 2005). An example is the use of the Histidine-tag, a small peptide (2-10 Histidines) that interacts with adsorbents (Ni(II)-nitrilotriacetic acid resin) also known as a Immobilized Metal Ion Affinity Chromatography (IMAC) resin. The IMAC method uses the affinity of certain aminoacid side chains to chelated metal ions. The imidazol group plays the important role in the binding interaction to the metal ions in the surface of the resin (Mondal and Gupta 2006). This technique have a low cost, can resist to multiple regeneration processes and exhibits high binding capacity (Waugh 2005), although this strategy is less useful when the proteins have metal ions (Arnau et al. 2006).
CHAPTER 1 - INTRODUCTION
Table 1.1 – Affinity tags commonly used for purification of recombinant proteins.
Affinity Tag Comments References His-Tag 5 -15 Histidines uses IMAC resin (Derewenda 2004)
FLAG tag Antibody based purification (Einhauer and Jungbauer 2001)
Streptag II Streptavidin column (Cass et al. 2005)
c-myc Antibody based purification (Terpe 2003)
T7-tag Antibody based purification (Chatterjee and Esposito 2005)
Arg 5 to15 Arginines uses a cation-exchange resin (Terpe 2003)
Asp 5-15 Asparagines uses a anion-exchange resin (Hedhammar et al. 2005)
S-tag Based on the affinity of S-Protein (RnaseA) (Terpe 2003)
The cost and the scalability of the chromatographic supports are crucial for the selection of the affinity tag pair, since natural products, (e.g. antibodies) are more costly and less stable than synthetic ones. In addition, some tags can improve the production of the protein when placed at the N-terminal position or even enhance the protein solubility. Nevertheless, it is important to analyse the effect of the tag in the structure of the protein of interest (Waugh 2005).
The tags derived from peptides offer multiple advantages because the methods of synthesis have improved and the variability is ensured by combinatorial methods in solid phase or through phage display methods, allow the production of tags with different chemical and physical properties or functional groups (Tozzi et al. 2003), that can be studied for development of new ligands for application in affinity purification.
CHAPTER 1 - INTRODUCTION
However, after purification and elution of the fusion protein, it is often necessary to remove the tag from the protein (Figure 1.3).
This can be performed by chemical or enzymatic methods. By chemical methods, harsh conditions are used which can denature the proteins (Hedhammar et al. 2005). As a consequence, enzymatic methods are preferentially used. For this purpose, a sequence for enzyme recognition is added to the tag. This sequence has to be considered in the design of the vector for expression of the fusion protein (Arnau et al. 2006). There are several endoproteases (e.g. TEVprotease, Enterokinase, 3CProtease) that are used for this purpose nevertheless the specificity of the cleavage is a problem, as enzymatic cleavage can result in protein degradation and low yields. Exopeptidases are another option (e.g. Aminopeptidase M, Carboxypeptidase A and B), although there are concerns about contamination of therapeutic protein samples (Arnau et al. 2006). To select the appropriate enzyme it is necessary to evaluate the specificity of cleavage but also the costs and the conditions to maintain the functionality of the target protein (Kenig et al. 2006) This subject is reviewed in detail by several authors (Hedhammar et al. 2005; Waugh 2005; Arnau et al. 2006; Kenig et al. 2006; Mondal and Gupta 2006).
1.5
Aims and Objectives
CHAPTER 2
–
MATERIALS AND METHODS
2.1 Materials
Chemical Compounds
The reagents utilized were of the highest grade available. 1-Amino-2-Propanol (11,028), 4-Aminobenzamide (98%, 284576), 5-Aminoisophthalic acid (94%, 18679), 9-Anthracenecarboxylic acid (99%, A8,940-5), Cyanuric Chloride (99%, C95501), 1,4-Diaminobutane (99%, D13208), Epichlorohydrin (99%), Glutaric Acid (99%, G3407), 3-(4-Hydroxyphenyl)propionic acid (98%; H5, 240-6), 3-Indoleacetic acid (98%, I375-0), Isopropyl Isocyanide (97%), Phenylacetic acid (P16621), Phenethylamine (12,894-5), 1-Pyrenemethylamine hydrochloride (95%, 401633), Sodium Periodate (NaIO4) 99,8% A.C.S. Reagent, Succinamic acid (97%, 134376), Tyramine (T9,034-4) were acquired from Aldrich (Sintra, Portugal). Nα,Nα-Bis(carboxymethyl)-L-lysine hydrate (I4580), L-Glutamine (49419) acquired from Fluka (Sintra, Portugal). ß- Arabic Acid (98%, A3006), N-acetyl-D-phenylalanine (A3876), Deuterium Water, Glutamic Acid (G1763), 3-methyl-1-Butanamine (98%), Propionaldehyde (P6889), Sodium Hydroxide (NaOH) 97% beads, Tryptamine were purchased from Sigma (Sintra, Portugal). Ethanol Absolute PA 99,5% 121086 from Panreac (Barcelona, Spain); N,N-Dimethylformamide (DMF) 99,5%, Hydrochloric acid 1mol/l, Methanol 99%, 2-Propanol 99.5% were from Roth (Navarra, Spain). The Sodium Chloride (NaCl) PA ACS ISO 99.5%, 131659.1211; Sodium di-Hydrogen Phosphate 1-hydrate, 131965; di-Sodium Hydrogen Phosphate 2-Hydrate 122507.1211; Tris (Hidroxymetil) Aminomethane 131940 99.8% were purchase from Panreac (Barcelona, Spain). Glycine 99.7% was purchased from Merck (Lisbon, Portugal).
For mammalian cells transfection was used Polyethylenimine, Linear, 25000Mw from Polysciences (Pennsylvania, USA) (Stock solution of 1mg/ml).
The protein quantification assay used was BCA kit Bicinchoninic Acid Solution from Sigma.
For the nucleic acid electrophoresis was used Agarose, SeaKem® LE Agarose, was purchase from Lonza (Basel, Switzerland). The loading buffer, BlueJuice™ Gel was purchase from
Invitrogen (Barcelona, Spain). To stain the agarose gel was used Gel Red - GelRedTM Nucleic Acid Gel Stain, 10000X in water from Biotium, Inc. (California, USA)
CHAPTER 2
–
MATERIALS AND METHODS
Chromatographic and Screening Material
Cross-linked agarose, (Sepharose TM CL-6B 17-0160-01), was purchased from GE Healthcare (Carnaxide, Portugal). The Captiva 96 well 20µm polypropylene filtration plates (0.8x0.6cm), columns Empty bond elut reservoir, Reservoir-3ML Capacity and Bond elut clean polyethylene frits, Frits -3ML, 3/8’’, 20µm were purchased from Varian (Porto, Portugal). The samples were analysed in different microplates: for UV measurements UV Star Plate 96 well Flat Bottom Half Area Greiner Bio-one (Frickenhausen, Germany) were used; for colorimetric assays the Microtest plate 96 well Flat bottom Transparent Polystyrene, Sarstedt (Nümbrecht, Germany); in the fluorescence studies, BRAND Plates – Imunogrades, Brand Tech Scientific (Carnaxide, Portugal) were used.
Biochemical Reagents and Cells
The hexapeptide NNNNNN 99.46% (w/w) was purchased from GeneCust (Rudelang, Luxembourg) and the Green Fluorescent Protein, rTurboGFP from Evrogen (Moscow, Russia).
The Strains of Bacteria used wereChemically Competent E. coli GT115 cells purchased from
InvivoGen (Toulouse, France) and Library Efficiency® DH5α™ Competent Cells purchased
from Invitrogen (Barcelona, Spain).
The Mammalian Cells used were Human Embryonic Kidney 293T cells (HEK 293T cells).
Table 2.1 – Vectors used during the work.
Vectors Description Source
pRWTagMGFP GFP tagged with hexapeptide RW expression under control of CMV promotor. (Regensburg, Germany) GenArt
p6NTag It has the Affinity Tag with hexapeptide NN (Regensburg, Germany) GenArt
p6NTagMGFP Express GFP tagged with hexapeptide NN under control of CMV promotor. Constructed during the thesis work
pMDISGFP Express GFP under control of CMV promotor ---
CHAPTER 2
–
MATERIALS AND METHODS
For restriction of the DNA plasmids the following enzymes were used: EcoRI, HindIII, KpnI and NheI with appropriated buffer 1 and 2, was also used BSA. For the vector ligation were used: 10x Antarctic Phosphatase Buffer and Antarctic Phosphatase Buffer (5Units); T4DNA Ligase Buffer and T4DNA Ligase (4U/ µl) all were purchased from New England Biolabs (Massachusettes, USA).
For DNA purification the Maxi Prep Kit from Roche (Mannheim, Germany); Gel Band Purification Kit was purchase from GE Heathcare (Germany); Mini Prep Kit was purchased from Qiagen (Hilden, Germany) were used.
In the nucleic acid electrophoresis the DNA Ladders: DNA Ladder 1kb G5711 and PCR Marker G3161 were purchased from Promega (Wisconsin, USA).
For Mammalian Cells Growth and maintenance was used a Dulbecco’s modified Eagles’s
medium (DMEM) – +4,5g/l Glucose; +L-Glutamine; + Pyruvate Gibco®; supplemented with
10% (v/v) of Fetal Bovine Serum (FBS) Gibco®; Dulbesco’s Phosphate-Buffered Saline 1x (DPBS) 1X - (-)CaCl2; (-) MgCl2 and Trypsin, 0.05% 1X that were purchase from Invitrogen (Barcelona, Spain).
The protein marker used in the SDS-PAGE was Low Molecular Weight SDS Kit, NZYTech (Lisbon, Portugal).
Equipment
A Rotisserie oven – Big Shot III Hybridization Oven Model 230402, Boekel Scientific (Pennsylvania, USA) was utilized for the synthesis of the combinatorial libraries. Laboratory Medical Centrifuge LMC-3000, BioSan (Riga, Latvia). The Microplate Reader – Tecan Infinite F200 from Tecan (Männedorf, Switherzland) was used for all spectrophotometric and spectrofluorometric assays. To determine the melting point was used Reichert Thermovar Thermometer (30ºC-230ºC), Austria.
Software
CHAPTER 2
–
MATERIALS AND METHODS
2.2
Methods
2.2.1 Synthesis of a Ligand Library based on the Ugi Reaction
2.2.1.1 Epoxy Activation of Sepharose CL-6B
Figure 2.1 - Reaction of Activation of the Sepharose CL-6B with epoxy group and preparation for activation with an aldehyde group.
Initially the required amount of Sepharose CL-6B was washed with distilled water (10 x
volume of the resin’s weight). The sample was filtered under gravity without applying vacuum. After this, 7,2ml of NaOH 10 M (with a proportion of ~ 40 ml per 1000 gram of gel) was added and incubated at 30 ºC during 30 min with orbital agitation. In order to introduce the epoxy group in the gel, 12,96 ml of epichlorohydrin (in concordance with the optimize proportion 72 ml/ 1 Kg of gel) was also added to the gel, and then incubated during 3 h at ~36ºC with constant stirring (Figure 2.1). After this period, the mixture was washed thoroughly with distilled water, being the first litre of solution taken into the chlorinated solvents container. The epoxy group content was determined as described in 2.2.12.1.
2.2.1.2 Cis-diol Activation of the Epoxy-activated Support
A volume of 160 ml of 1 M NaOH (1 ml/g gel) was added to 160 g of epoxy-activated gel (17
mol of epoxy/g of gel). and then incubated overnight at 30ºC (Figure 2.1). After this, the gel was washed as described in 2.2.1.1.
2.2.1.3 Aldehyde Functionalization of the Activated Support
CHAPTER 2
–
MATERIALS AND METHODS
The aldehyde functionalization was performed by adding 160 ml of 0.1 M NaIO4 (with the proportion of 1 ml of solvent / 1 g of gel) and then incubated during 6h at 45ºC with constant stirring (Figure 2.2). After functionalization was necessary to proceed to the washing as described in 2.2.1.1. The presence of aldehydes was detected using the Tollens assay (2.2.12.2).
2.2.1.4 Solid-phase Synthesis of Ugi Library
Subsequent to the activation of the support with the Aldehyde group, one of the compounds of the Ugi reaction was possible to add the other three compounds to the reaction Figure 2.3.
Figure 2.3 - Ugi Reaction, the functionalized support with aldehyde is the base of the reaction; the second compound is an amine that reacts for two hours to let the formation of the imine group. After that the isocyanide and the carboxylic acid is added. Reaction continues for 48h.
CHAPTER 2
–
MATERIALS AND METHODS
A)
B) A)
B)
CHAPTER 2
–
MATERIALS AND METHODS
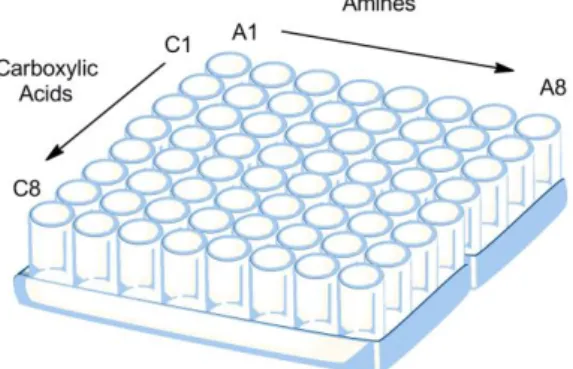
Figure 2.5 - Ugi Combinatorial 64 Ligands Library. Strategy to add Amines and Carboxylic acids to construct the library.
The first compound added was the amine, being the addition done in each column of the reaction block from A1 (first column) until A8 (last column) (Figure2.5). Amines A2, A3 and A7 possess both amine and carboxylic acid functionalities (Figure 2.4), and for this, it was necessary to block the carboxylic acid with NaOH (3 eq. the amount of the carboxylic acid (A2) and 2 eq. for A3 and A7, considering the three and two COOH groups of the molecule, respectively). The aldehyde and amine compound were incubated for 2h at 60ºC, in order to guarantee the formation of the imine compound.
The following compound added was the isopropyl isocyanide, being this addition performed in all wells (16µl per well in an excess of 8 eq.).
The last compound, carboxylic acid compound, was added with the same volume 250 l / well). The addition of this compound was performed in this way due to the fact that the carboxylic acid compound was kept constant in each row (C1 in first row and C7 in last row) of the reactional block (Figure 2.5).
All these quantities were determined considering the molecular weight of each compound and the extent of epoxy activation of the agarose that as determined in 2.2.12.1.
After the addition of all components, where only two compounds involved were varied, the upper cap was fixed in the top of the reaction block. Then, the reaction block was incubated at 60ºC for 48h in a rotisserie oven to ensure a good mixing of the compounds.
CHAPTER 2
–
MATERIALS AND METHODS
NaOH in 50 % (v/v) isopropanol (8) 2x water and (9) 20% (v/v) ethanol. Then the washed beads were stored with 20% (v/v) ethanol at 4ºC.
In parallel, a positive control ligand was also synthesized, where the amine compound was the 1-Pyrene methylamine hydrochloride (pyrene). From the same batch of agarose functionalized with the aldehyde as described in 2.2.1.4, 1g of the functionalized agarose was taken for a reactional flask and then 1 ml of methanol was added to perform the synthesis of the ligand. The four components of the ugi reaction were added (5 molar excess of epoxide groups) dissolved in 1 ml of methanol. In first, the amine was added to the slurry, followed by the addition of the isopropyl isocyanide and in the last a random carboxylic acid, 4 hydroxybenzoic acid, was added.
To analyse the fluorescence on the beads, 500mg of blank agarose and 500mg of gel functionalized with pyrene were washed several times with deionised water, and then 1ml of deionised water was added to the resin. Samples with 200µl of Agarose solution and Agarose functionalized with pyrene were taken and the fluorescence intensity on the agarose beads was measured using the microplate reader fluorescence filter (excitation 485(20)nm and emission: 535(25)nm).
2.2.2 Synthesis of Ligands Library based on the Triazine scaffold
2.2.2.1 Amination of the epoxy-activated support
Figure 2.6 – Activation of the Sepharose CL-6B with epoxy groups and amine groups.
CHAPTER 2
–
MATERIALS AND METHODS
2.2.2.2 Triazine Library Synthesis
Figure 2.7 – Activation of the 1,3,5-Triazine based ligands, by addition of the cyanuric chloride.
To the aminated gel (25g, 20 mol of Amines/g of gel), 25ml of 50% (v/v) Acetone/Water mixture were added and then aminated at 0ºC in an ice bath shaker. After this, cyanuric chloride (5 molar excess to the aminated groups) was dissolved in 3.96ml of Acetone (8.6ml Acetone/g of Cyanuric Chloride) and added to the agarose slurry with constant shaking at 0ºC and with maintenance of neutral pH. The reaction occurred at 0ºC for 2h (Figure 2.7). The gel was washed with a mixture of water:acetone (v/v)with the following ratios: 1:1,1:3,0:1 and then 1:1, 3:1 and 1:0 until reach 100% water. The slurry was divided in 0.4ml portions (corresponding to 250mg of resin) and dispersed in the individual wells of the reaction block Captiva 96-well (utilized 64 wells).
CHAPTER 2
–
MATERIALS AND METHODS
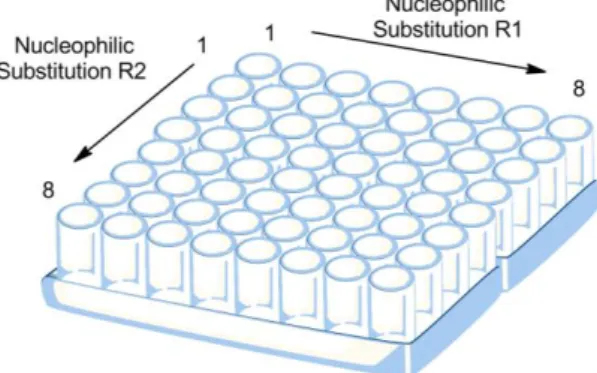
Figure 2.9 - Triazine Combinatorial 64 Ligands Library. Strategy to add amines in the Nucleophilic Substitution R1 and Nucleophilic Substitution R2.
Figure 2.10 – Nucleophilic Substitutions of the positions 1 and 3 of the Triazine ring.
For the Nucleophilic Substitution R1
All the amines were used with a 2 molar excess relative to the amount of amine-groups and dissolved in 50%DMF:50%Water(v/v) in a total volume to give 250µl/per well. Amines 6 and 8 possess both amines and carboxylic acid functionalities (Figure 2.8), and for this, it was necessary to block the carboxylic acid wit NaOH (2molar excess the quantity of the carboxylic acid, considering the number of the COOH groups of the molecule). Each amine was added only in the columns of the reaction block, starting with the addition of the A1 amine in the first column until the A8 in the last column (Figure 2.9). Then the reactional block was incubated at 30ºC for 24h with orbital agitation (Figure 2.10). After this, several washes in each well were performed, starting with 1ml of 50%DMF:50%Water(v/v) and then four times with 1ml of distilled water in each well.
For the Nucleophilic Substitution R2
CHAPTER 2
–
MATERIALS AND METHODS
block the carboxylic acid wit NaOH (5molar excess the quantity of the carboxylic acid, considering the number of the COOH groups of the molecule). Each amine was added only in the columns of the reaction block, starting with the addition of the A1 amine in the first row until the A8 in the last row. Then the reactional block was incubated at 80ºC for 48h with orbital agitation. In the end of the R2 activation, several washes were performed in each well, starting with 2X 1ml of 50%DMF:50%Water (v/v); 2x Water; 0.1M HCl; Water; 0.2M NaOH in 50%(v/v) Isopropanol; 2x Water and 20% Ethanol. Then the block was stored with 20%Ethanol at 4ºC.
In parallel, a negative and a positive control were synthesized. For the synthesis of the controls 1g of cyanuric chloride-activated gel was used. The negative control or 0/0 ligand was synthesized by adding 1ml of ammonium hydroxide and 1ml of water for both R1 and R2 substitution. The positive control was synthesized by adding 1-pyrenemethylamine hydrochloride as amine compound for both R1 and R2 substitutions. Then, fluorescence studies were performed with control ligands as was previously described 2.2.1.4.
2.2.3 Ligands Screening with Hexapeptide NN and GFP
The prepared combinatorial libraries of ligands were screened to determine the affinity of each ligand to the hexapeptide NN and the protein GFP.
2.2.3.1 Screening with Hexapeptide NN
The supports of the Ugi ligands and the Triazine based ligands were washed with 2x1ml distilled water, followed by 3x1ml regeneration buffer (0.1M NaOH in 30%(v/v) isopropanol) alternated with 3x1ml distilled water. Subsequently, 10x1ml of equilibration buffer (PBS buffer: 10mM sodium phosphate, 150mM NaCl, pH 7.4) were added in order to equilibrate the columns. The columns were washed with equilibration buffer until the absorbance of the samples reached A280nm≤0.005 (approximately 10x1ml).
CHAPTER 2
–
MATERIALS AND METHODS
The first fraction of unload peptide was collected in a 96-deep well collection plate, the block with the collector was centrifuged at 10000rpm for 20sec in the Centrifuge LMC-3000 BioSan.
After this the wells were washed with equilibration buffer for 8x250 µl. Then was made the same procedure described for the first fraction.
The bound peptide was eluted by adding 5x250 µl of elution buffer (0.1M Glycine-HCl, pH3.5). 50 µl of Tris-HCl pH9 were immediately added to each fraction. After the elution step the columns were washed with regeneration buffer (5x1ml), followed by distilled water (5x1ml) and stored at 4ºC in 20% (v/v) ethanol. The factions loaded, washed and eluted were analyzed by the BCA assay (2.2.12.4) using a calibration curve Y=0.3671X+0.0593, R2=0.99.
2.2.3.2 Screening with Green Fluorescent Protein
The blocks were regenerated in between the screening of the hexapeptide and the GFP by washing the wells as in (2.2.3.1).
For the screening of GFP a solution of 1.75x10⁻²mg/ml in equilibration buffer (250µl) was loaded in each well of the 96-well filtration plate. Then the blocks were incubated at 25ºC for 20min with agitation.
The washing and the elution procedures were repeated as described for the hexapeptide (2.2.3.1). From each sample were analysed (150µl) by fluorescence in wavelengths of 485nm (excitation) and 535nm (emission) in the microplate reader to determined the concentration of GFP in the samples (Y=2E6*X-1200.7, R2=0.99) using a calibration curve of GFP between 2.5E-3 to 1.75E-2mg/ml.
2.2.4 Scale-up Synthesis and Screening of the Lead Ligands
After screening of the combinatorial libraries (Ugi and Triazine libraries) with the hexapeptide NN and GFP, some ligands were selected for further studies.
From previous work with another hexapeptide RW some ligands from the Ugi library were selected for studies with cellular extracts.
CHAPTER 2
–
MATERIALS AND METHODS
Table 2.2 – Selected lead ligands for the hexapeptide NN and RW.
Combinatorial
Library Ligands Target
Ugi A3C1, A6C1, A5C2, A1C5, A6C5, A7C6, A3C7, A6C7 Hexapeptide NN
Triazine 6,3; 8,3; 7,4; 8,6 Hexapeptide NN
Ugi A4C3, A6C3, A7C3, A4C4, A4C5, A4C6, A4C7, A7C8 Hexapeptide RW
The resin for the Ugi ligands synthesis was activated using the procedure as described before (see 2.2.1.1. to 2.2.1.4) The Ugi ligands for hexapeptide NN had 41µmol epoxy groups/g gel and the ligands hexapeptide RW a 20µmol epoxy groups/g gel. Each compound in the Ugi Reaction was added in the appropriated proportion to the molar ratio of epoxy groups in the resin. In a 5ml of Methanol each compound was added to the reaction flask. In the end of the reaction the slurry was washed with a volume of 5ml as described before (2.2.1.4). After that were collected in to a flask and stored at 4ºC and 20% Ethanol.
The Triazine ligands of hexapeptide NN were synthesized with the appropriate molar excess, knowing that the amination activation was 17µmol amine groups/g support. The components of the reaction were dissolved in 5ml of 50%DMF: 50%Water. When the reaction ended the slurry was washed with a volume of 5ml as in 2.2.2.2. After that, the agarose functionalized was collected into a flask and stored at 4ºC and 20% Ethanol.
2.2.4.1 Scale-up Screening of the Lead Ligands with the Hexapeptide NN
The lead ligands for hexapeptide NN were screened for binding to the peptide. 500mg of agarose (~750µl of slurry) modified with each ligand was packed in a column. The supports were regenerated as described for the 96 wells block (2.2.3.1).
After equilibration of the adsorbent with equilibration buffer 500µl of a hexapeptide NN solution of 1mg/ml was added to each column. The columns were incubated at 25ºC for 20min, after each washes and the elution steps were performed by adding 500µl of the required solution (see 2.2.3.1).
CHAPTER 2
–
MATERIALS AND METHODS
2.2.5 Molecular Modelling Studies - Possible Lead Ligands in silico
The lead ligands for the hexapeptideNN (A3C1, A6C1, A5C2, A1C5, A6C5, A7C6, A3C7 and A6C7) were analyzed in silico for interactions with: the Affinity Tag composed by hexapeptideNN – Three Prolines - Sequence for Recognition of Enterokinase; and, the subunit A of GFP (PDB structure of Wild Type GFP of Aequorea Victoria – 1W7S).
The construction of the ligands and the Affinity Tag was performed in the program Marvin Sketch. The structures were edited in 3D clean and saved with a *.pdb extension. The GFP structure was downloaded from PDB Protein Data Bank site with *.pdb extension. To download only the structure of the subunit A it was necessary to enter in the CATH site and choose the subunit of interest.
The molecules saved as *pdb files were imported for the docking software (Molegro Virtual Docker) work space and prepared for the docking (File>Import Molecules>Preparation (Always)). For the protein it was first necessary to apply the Detect Cavities option. Then was used the option, Docking Wizard, to start the process of docking between the ligands and affinity tag or the subunit A, where was selected Score (Moldock Score and the Radius of interaction was optimized) and then selected the option Algorithm (Moldock Optimizer; Number of Runs: 10; Population number: 200); the results were recorded in a specific folder. In the end of the running in the option Settings (select the Energies: Interaction and HBond>Recalculate the Energies); then were Select the Poses and Energies>OK; and in the Pose Organizer selected the Rerank Score with the lowest energy, since this value gives idea of the energy envolved in the affinity between the elements of the complex.
In the results it was possible to evaluate the affinity of each ligand and the protein (Affinity tag or Subunit A GFP) based on the free energy and the interactions (Hydrogen Bond and Hydrophobic interactions) that are formed between the molecules.
2.2.6 Solution Phase Synthesis and Characterization of Ugi Ligand, A6C5
CHAPTER 2
–
MATERIALS AND METHODS
The white solid formed was washed with small volumes of methanol and filtered and left in the desiccator for further drying.
After the synthesis was necessary to characterize the crystalline solid. To this purpose was made the TLC technique and determined the melting point of the solid (Solomons and Fryhle 2004). In addition was analysed a sample in 1H (10mg) and 13C NMR (30mg) this sample was dissolved in 0.5ml of Deuterium Water (D2O).
2.2.7 Ligands Nomenclature
The Ugi ligands in this work are represented by AxCy, A-Amines and C-Carboxylic Acid, following the nomenclature normally use in this tip of works (Haigh, Hussain et al. 2009). In the case of the Triazine ligands are represented by numbers that correspond to the amines envolved in the Nucleophilic Substitution: Amine x (R1), Amine y (R2).
2.2.8 Expression of GFP fusion proteins in Mammalian Cells
2.2.8.1 Amplification of the vectors pRWTagMGFP and p6NTag
2.2.8.1.1 E.coli GT115 Competent cells Transformation
The protocol was followed as described by the supplier (InvivoGen). After incubation in the plates with solid medium Agar Amp, the six colonies were picked using a pipette tip that was used to inoculate 3ml of TB Amp medium and were cultivated overnight at 37ºC with agitation at 180rpm. In the next day were determined the optic density of the cultures clones at 600nm (OD600nm), the clone selected to inoculate the culture in 200ml of TB Amp, had an OD600nm higher than 5.
The 200ml TB Amp medium was inoculated with 200µl of the selected clone bacteria suspension. This culture was incubated overnight at 37ºC with agitation at 180rpm. In the next day, the OD600nm was determined and normally was between 2 and 6. From this culture was took a sample of 8,5ml was added 1,5ml of sterile Glycerol to make a thaw solution that was divided in cryovials and stored at -85ºC.
CHAPTER 2
–
MATERIALS AND METHODS
2.2.8.1.2 Isolation and Purification of cDNA from E.coli
To isolate the plasmid DNA was used the Maxi Prep Kit (Roche) and the procedure for High copy Number Plasmid was followed as described by the supplier. The plasmid DNA was resuspended in 300µl of TE buffer pre-warmed at 37ºC.
2.2.8.1.3 Spectrophotometric Quantification of cDNA
The proper dilutions of the plasmid DNA sample were made, to a total volume of 50µl, to determine the absorbance at diferents wavelengths: 260nm, 230nm, 280nm and 320nm using a Spectrophotometer. The concentration of the plasmid DNA was determined and also it purity, by the quotients of absorbance: 260nm/230nm and 260nm/280nm. The purified plasmid DNA sample was stored at -20ºC.
2.2.8.1.4 Enzymatic Modifications of cDNA
The volumes of enzyme, BSA, plasmid, Pure Water and appropriated Buffer were calculated
to digest 1μg of plasmid.
To digest pRWTagMGFP the following restriction enzymes were used: EcoRI and HindIII. The enzymes were used in Buffer 2, where they have the highest enzyme activity.
Three different experiments were made: EcoRI; HindIII and EcoRI + HindIII. In the experiment with only one enzyme was used 1µl plasmid DNA, 2µl Buffer 2, 1µl Enzyme and the volume was complete to 20 µl with sterile water; in the experiments of two enzymes were added 1µl of each enzyme and the volume was completed with sterile water.
The enzymatic reaction occurred at 37ºC for 90min with agitation.
2.2.8.1.5 Electrophoresis
The restriction samples were analysed in agarose gel to confirm the presence of the expected fragments.
The electrophoresis gel was made by mixing agarose with the appropriated volume of TAE 1x buffer to make the agarose total percentage of 1 – 2%. The electrophoresis was let to run for 90min at 90V.
CHAPTER 2
–
MATERIALS AND METHODS
2.2.8.2 Construction of vector p6NTagMGFP
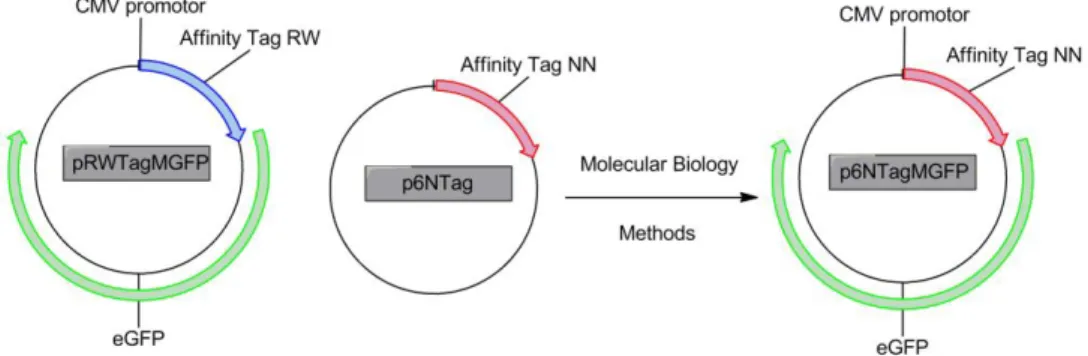
Figure 2.11 - Construction of the vector p6NTAgMGFP, that expresses in mammalian cells the fused protein GFP tagged with hexapeptide NN. To construct this vector were used the pRWTagMGFP and the p6NTag vectors.
2.2.8.2.1 Extraction and Purification of DNA from Agarose Gels
After the digestion of the plasmids p6NTag and pRWTagMGFP with NheI and KpnI an electrophoresis gel was made. To this gel two DNA markers were added: PCR Marker and DNA Ladder 1kb. In the gel, one well had a small sample of the restriction reaction (2 µl) for analysis purpose and the other one had the all sample of the restriction reaction (16 µl) to recover. The Electrophoresis was made in the same conditions as described before (2.2.8.1.5).
In the end the gel was cut in four fragments: one for pRWTagMGFP (with two markers and a sample with the restriction reaction with NheI and KpnI), other with all sample of pRWTagMGFP; one for p6NTag (with two markers and a sample with the restriction reaction with NheI and KpnI) and other with all sample of p6NTag. These two fragments with restriction sample and markers were incubated in the dark for 30min with Gel Red.
These two fragments were compared with the other fragments that were not revealed with Gel Red. By comparing the two gel fragments for the same plasmid digestion reaction (small sample and all sample) was possible to select and cut the bands in agarose gel that had the fragments of interest. In the plasmids the fragments of interest were: for pRWTagMGFP 4126bp and for p6NTag 78bp.
Following to the recovery of the bands from the agarose gel was necessary to purify the fragments of DNA from the gel. For that purpose was necessary to use a mini prep, Gel Band Purification Kit. The elution of the DNA was made by addition to the purification column of 60µl of sterile water.
CHAPTER 2
–
MATERIALS AND METHODS
2.2.8.2.2 Dephosphorylation of a Vector
The all sample of purified DNA vector was dephosphorylated by adding 5μl of 10x Antarctic Phosphatase Buffer and 1μl of Antarctic Phosphatase Buffer (5Units). After mixing it was incubated for 60min at 37ºC.
Following the enzyme was heat inactivated at 65ºC for 10min. The sample was put at RT and subsequently was made the ligation of the vector with the insert.
2.2.8.2.3 DNA Ligation
To the dephosphorilation mixture was added 5,9µl of T4DNA Ligase Buffer, 2 µl of T4DNA Ligase (4U/ µl) and 1 µl of DNA insert. The reaction was incubated overnight at RT.
In the next day the enzyme was heat inactivated at 65ºC for 20min.
2.2.8.2.4 Amplification of the p6NTagMGFP
In this case, the product of the ligation was used for transformation of Library Efficiency
DH5αTM competent cells the volume that was added was 5µl (10ng) to 100µl of cells. The transformation protocol was followed as described by the supplier (Invitrogen).
Subsequently to the transformation the mixture was spread (100 µl) in Agar Amp medium plates and incubated overnight at 37ºC.
In the next day there were some colonies, they were picked with a pippet tip that was used for inoculation of culture tubes with 3ml of TB Amp medium that were incubated (2.2.8.1.1).
2.2.8.2.5 Purification in small scale of the plasmid DNA and confirmation of the correct ligation
The protocol of the supplier for MiniPrep kit (Qiagen) was followed. In the end was determined the concentration and purity of the plasmid (2.2.8.1.3).
After this procedure the plasmid DNA was fragmented with the appropriated restriction enzymes (KpnI and NheI). The restriction reaction occurred in the same conditions as 90min at 37ºC with agitation (2.2.8.1.4).
The result samples were added to a gel of agarose 2% with appropriated DNA markers (2.2.8.1.5).
CHAPTER 2
–
MATERIALS AND METHODS
2.2.8.2.6 Enzymatic Modifications of plasmid DNA
The same procedure was used for this plasmid and even the same restriction enzymes (KpnI and NheI), although to confirm the presence of only one insert in the plasmid was necessary to cut it with Hind III, that has a restriction site in the middle of the insert.
The restriction reaction occurred as (2.2.8.1.4). The samples of the restriction reaction were added to an agarose gel and the electrophoresis occurred as described before (2.2.8.1.5) From the start culture was took a sample of 8.5ml to make a stock of cells with the p6NTagMGFP (2.2.8.1.1).
2.2.8.3 Amplification of vector pMDISGFP
To start the amplification of this plasmid was used a stock sample stored at -85ºC. The solution was partially thawed and a sample was spread in a plate of Agar Amp medium that was incubated overnight at 37ºC.
Than was followed the same procedure that was described for amplification (2.2.8.1.1) and purification (2.2.8.1.2) of the pRWTagMGFP and p6NTag.
2.2.9 Transfection of Mammalian cells with pRWTagMGFP, p6NTagMGFP and pMDISGFP
The mammalian cells were subcultured regularly and grown in an adherent monolayer in T-flasks at 37ºC in a humidified 5% CO2 atmosphere. The cells were grown in a mixture of DMEM medium supplemented with 10% of FBS. To subculture the cells (80-90% confluence) Trypsin was used, to detach the cells from the support, and passed the appropriated volume to a new T-flask. When was necessary to determine the cell concentration and viability a hemocytometer was used to count cells stained with trypan blue dye exclusion.
The day before transfection of the HEK 293T cells, a petri plate (58.1cm2) was inoculated with the 5x10⁴ cells/cm2 (~60% confluence) and was incubated with DMEM at 37ºC and 5%CO2.
CHAPTER 2
–
MATERIALS AND METHODS
was incubated at RT for 10min to let the formation of DNA:PEI complex. The mixture was added dropwise along the plate to distribute the complex by the culture. The plate was incubated at 37ºC and 5% CO2 for 48h. The plate was observed at 24h to determine the confluence of the culture and efficiency of the transfection.
After 48h of transfection the plates were observed and the cells were collected. To collect the cells from the petri plates a cellscraper was used. First the medium was removed and to each plate was added 500µl of PBS and the cells were scraped from the dish. The suspension was collected to a flask and the cells were resuspended in the total volume of 3ml PBS. These samples were stored at -20ºC.
2.2.10 Extraction and Quantification of Proteins from Cellular Extracts
To extract the proteins from the cells a freeze-thaw method was used. The cellular extracts were frozen in Liquid Nitrogen and than thawn in a water bath at 37ºC. Three cycles of freeze and thaw were made.
The samples were divided in 1ml alliquots. These samples were centrifuged at 12851g, 4ºC for 15min. The supernatant was collected and stored at -20ºC.
2.2.10.1 Quantification of Proteins in the Cellular Extracts
The total protein content of the samples obtained in 2.2.10 using the BCA Kit, was determined by using BSA as a standard protein (calibration curve 0.2 to 1mg/ml (Y=0.914X+0.106, R2=0.99)). Samples were diluted 1:10 and 1:100 in a total volume of 25µl. The assay was prepared as described (2.2.12.4).
In the samples containing GFP, the concentration of this protein was determined based on the fluorescence intrinsic property. The samples were diluted in 1:10 and 1:100, calibration curve was the same used as previously described (2.2.3.2)
2.2.11 Screening of Lead Ligands with Cellular Extracts