S etembro, 2017
J oão B ernardo Marques Cras tes
Licenciatura em Ciências da Engenharia Biomédica
Elec tronic detec tion of neurologic al s ignalling agents
Dissertação para obtenção do Grau de Mestre em Engenharia Biomédica
Orientador: Prof.ª Eithne Dempsey, PhD, ITT Dublin
Co-orientador: Prof. J osé Manuel Fonseca, PhD, FCT/UNL
J úri:
Presidente: Prof. Carla Pere ira, PhD
Argue nte: Prof. J osé Ferreira, PhD
Electronic detection of neurological signalling agents
Copyright © João Bernardo Marques Crastes, Faculdade de Ciências e Tecnologia, Universidade Nova de Lisboa.
vii
Acknowledgements
Firstly, to my supervisor, Eithne Dempsey, a warm “thank you” for receiving me in your team and for making me feel comfortable about asking for help over the past months. Without your contribution, I would have never had the chance to write my thesis abroad, especially in Ireland, a land that now holds a special place in my heart.
I would like to acknowledge the collaboration of CREATE team members Camilo Mendes Menezes, for helping me with my first ELISA experience, and Brian Murphy, for working with me on the smartphone-operated system. Additionally, I would like to thank them and the rest of the team for the companionship and help around the lab: Aoife, for being like a mom away from home; Jessica and Robert.
A big thanks to my dear Erasmus friends, for being my safe haven among the “crazy” people we met in Dublin – even though I think we’re crazy enough ourselves. Emely, Gijs, Max and
Sophie, I’m looking forward to meeting you again.
To the kind Irish people I met during the five months I was in the Emerald Isle, you really made me feel at home. Darragh and Joseph, thank you so much. Seán, you know how much I love you.
However, I would not be where I am without the four years and four months that preceded my semester abroad. Moving away from the home where you grew up in can be complicated - be it from Portugal to Ireland, or from Portalegre to Lisbon - unless you find a new home wherever you go.
That’s why I want to thank the friends I made in university. To the most special sausages in my life, I hope we’ll “go out for all eternity”. More specially, cheers to the ‘Eights’, because even
behind a screen, I can still feel you close to me whenever I need it.
To the friends who come from way before that, thank you for showing me that even though time passes and we keep changing, we’ll still have the time of our lives together, Ana, Maria, Sara and Sofia.
To my family, for keeping me grounded and making me stay close to my roots. To my god-father Filipe, my aunt Ana and my late uncle João, I will never forget your warmth and kindness.
To my sister, Sofia, at the same time I grew for these past five years, I’ve watched you grow up in many ways and I’m thankful for it. Thank you for being a companion, more than you could
ever imagine you are.
I would like to thank my parents, for continuously supporting me in a multitude of ways throughout these five years of college. Your love always made me feel comfortable in my own
skin and like I could achieve everything I set out for. That’s why, five years later, I’m here
wrap-ping up this course. This one is for you.
ix
Abstract
This project will advance knowledge within the realm of neurological signalling agents/neu-rotransmitters and other biomarkers of disease. Electrochemistry is a valuable interrogation tool for quantitative analysis of such redox species.
One main goal is to overcome problems inherent to the simultaneous detection of neuro-transmitters, such as overlapping redox potentials and electrode fouling due to build-up of surface oxidation products. The use of electrodeposited catalysts enables selective detection in multicom-ponent systems at the required physiological levels. The carbon-based nanoparticles used in this work showed good potential when it comes to solve these problems.
Another goal is to explore the viability of a smartphone-operated potentiostat system in the electrochemical detection of neurotransmitters. Phone systems have been used in electrochemical formats for electroactive substances detection, but, to our knowledge, have not been employed as AC signal generators for amperometric sensor signal acquisition. The system appeared to work correctly. However, it needs additional tests and hardware and software development. It seems to be a good option to facilitate the electrochemical detection process, being low-cost, fast and port-able.
x
The positive results obtained with each approach validate the work, which is a good summary of areas that can be improved when it comes to the usage of electrochemistry in diagnostic.
xi
Resumo
Este projecto permitirá obter mais conhecimento no que toca a neurotransmissores e outros biomarcadores de doença. A electroquímica é uma ferramenta útil para a análise quantitativa des-sas espécies, muitas das quais exibem características de oxirredução.
Um objectivo principal é ultrapassar problemas inerentes à detecção simultânea de neuro-transmissores, como sobreposição de potenciais de redução e acumulação de produtos de oxida-ção na superfície do eléctrodo. O uso de catalisadores electrodepositados permite a detecoxida-ção se-lectiva em sistemas compostos por diversas substâncias, em concentrações fisiológicas. As nano-partículas baseadas em carbono usadas neste trabalho demonstraram boas potencialidades para a resolução destes problemas.
Outro objectivo é explorar a viabilidade de um sistema com um potencióstato controlado por smartphone para detecção electroquímica de neurotransmissores. O recurso a smartphones já existe no que toca à detecção electroquímica de substâncias electroactivas, mas, tanto quanto sa-bemos, ainda não são usados como geradores de corrente alternada para a aquisição de sinal com sensores amperimétricos. O sistema demonstrou funcionar correctamente, se bem que necessita de mais testes e desenvolvimento de hardware e software. Afigura-se uma boa opção para facilitar o processo de detecção electroquímica, ao ser low-cost, portátil e rápido.
xii
abordagem pioneira na sua detecção em fluidos biológicos. Os resultados demonstraram correla-ção entre os dados ópticos e electroquímicos, um bom indicador de sucesso da abordagem elec-troquímica.
Os resultados positivos de cada uma das três abordagens validam o trabalho realizado, que é um bom resumo de áreas passíveis de ser melhoradas no que toca ao uso da electroquímica em diagnóstico.
xiii
Contents
INTRODUCTION ... 1
ELECTROCHEMISTRY OVERVIEW ... 5
LITERATURE REVIEW ... 11
NEUROTRANSMITTER DETECTION AND ELECTRODE MODIFICATION ... 11
BIOMARKERS OF CONCUSSION, GALECTIN-3 DETECTION AND ELISA ... 14
DESCRIPTION OF PROCEDURES ... 23
REAGENTS AND EQUIPMENT DESCRIPTION ... 23
MACROELECTRODES ... 24
ELECTROCHEMISTRY PERFORMANCE AND PLOT ANALYSIS ... 25
SCREEN PRINTED ELECTRODES ... 26
ELISA ... 30
RESULTS ... 33
NEUROTRANSMITTERS’ ELECTROCHEMICAL CHARACTERISATION ... 33
ELECTRODE MODIFICATION ... 36
SMARTPHONE-CONTROLLED SYSTEM ... 39
ELISA ... 41
Optical data ...41
Electrochemical data ...43
CONCLUSION ... 49
xv
List of figures
FIG. 1 – A SIMPLIFIED ELECTROCHEMICAL CELL ... 6
FIG. 2 - TRIANGULAR EXCITATION POTENTIAL AND TYPICAL VOLTAMMOGRAM FOR A REVERSIBLE REDOX SYSTEM ... 7
FIG. 3 - PLOT OF CURRENT VS POTENTIAL FOR A DIFFERENTIAL PULSE VOLTAMMETRY EXECUTED ON A FERRICYANIDE SOLUTION, AT A PT ELECTRODE. ... 8
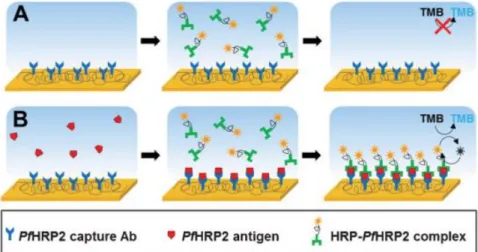
FIG. 4 - ILLUSTRATION OF THE ELECTROCHEMICAL DETECTION SCHEME IN THE ABSENCE AND PRESENCE OF PFHRP2 ANTIGEN. ... 9
FIG. 5 – CYCLIC VOLTAMMETRY ON A MIXTURE WITH 5 MM EACH OF DOPAMINE AND 5-HYDROXYINDOLEACETIC ACID ... 12
FIG. 6 - CIRCUIT BOARD OF THE CHEAPSTAT POTENTIOSTAT SYSTEM ... 18
FIG. 7 - SIMPLIFIED SCHEMATIC OF THE SMARTPHONE-BASED ELECTROCHEMICAL BIOSENSOR MODULE DEVELOPED BY SUN, WAMBACH, VENKATESH AND HALL ... 20
FIG. 8 – ELECTROCHEMICAL CELL WITH A THREE-MACROELECTRODE SYSTEM ... 24
FIG. 9 – CARBON SPE WITH THREE TRACK DESIGN, WITH SILVER INK DOT AND APPLIED COVER SLIP, AND DROPSENS ADAPTOR, WITH THE THREE ELECTRODE CONNECTIONS ... 26
FIG. 10 – SETUP OF PHONE-OPERATED SYSTEM. AND ITS SCHEMATIC ... 27
FIG. 11 – SCHEMATIC FOR THE LMP91000 ANALOG FRONT-END SYSTEM ... 28
FIG. 12 – FT311D SCHEMATIC ... 28
FIG. 13 – SCREENSHOT OF THE I-POPS SOFTWARE ... 29
FIG. 14 – PH STUDY FOR 5 MM DOPAMINE, AT A GLASSY CARBON ELECTRODE. ... 33
FIG. 15 – OXIDATION PEAK POTENTIAL VALUES PLOTTED AGAINST PH, FOR 5 MM DOPAMINE, EMBEDDED WITH ITS CHEMICAL TWO PROTON/TWO ELECTRON MECHANISM ... 34
FIG. 16 – DIFFERENTIAL PULSE VOLTAMMETRY FOR DOPAMINE AT DIFFERENT CONCENTRATIONS ... 34
FIG. 17 – SCAN RATE STUDY FOR 5 MM DOPAMINE, AT PH 7 ... 35
FIG. 18 – COMPARISON OF THE PEAK POTENTIALS FOR EACH STUDIED NEUROTRANSMITTER ... 36
xvi
FIG. 20 – DIFFERENTIAL PULSE VOLTAMMETRY ON 10 ΜM NEUROTRANSMITTER EQUIMOLAR SOLUTION, AT
DIFFERENT MODIFIED SCREEN PRINTED ELECTRODES. ... 37
FIG. 21 – DIFFERENTIAL PULSE VOLTAMMETRY ON 10 ΜM NEUROTRANSMITTER EQUIMOLAR SOLUTION, AT DIFFERENT MODIFIED SCREEN PRINTED ELECTRODES ... 37
FIG. 22 – CYCLIC VOLTAMMETRY ON 10 ΜM NEUROTRANSMITTER EQUIMOLAR SOLUTION, AT DIFFERENT MODIFIED SCREEN PRINTED ELECTRODES. ... 38
FIG. 23 – CHRONOCOULOMETRY FOR DIFFERENT CONCENTRATIONS OF POTASSIUM FERROCYANIDE / POTASSIUM FERRICYANIDE EQUIMOLAR SOLUTION, OBTAINED WITH THE PHONE SYSTEM ... 39
FIG. 24 – CHRONOCOULOMETRY FOR SEROTONIN AT DIFFERENT CONCENTRATIONS, AT SCREEN PRINTED ELECTRODES, OBTAINED WITH BENCH-TOP POTENTIOSTAT ... 39
FIG. 25 – CHRONOCOULOMETRY FOR SEROTONIN, OBTAINED WITH PHONE SYSTEM... 40
FIG. 26 – CHRONOCOULOMETRY PLOT FOR DOPAMINE, OBTAINED WITH PHONE SYSTEM ... 40
FIG. 27 - VOLTAMMOGRAM RESULTANT OF CYCLIC VOLTAMMETRY PERFORMANCE ON TMB ... 41
FIG. 28 – OPTICAL CALIBRATION PLOT FOR COLUMN 1 OF THE ASSAY ... 42
FIG. 29 – OPTICAL CALIBRATION PLOT FOR COLUMN 2 OF THE ASSAY ... 42
FIG. 30 - VOLTAMMETRIC RESPONSE FOR EACH WELL AFTER 0 MINUTES OF TMB INCUBATION, FOR COLUMN 1. ... 43
FIG.31-VOLTAMMETRIC RESPONSE FOR EACH WELL AFTER 20 MINUTES OF TMB INCUBATION, FOR COLUMN 1. ... 43
FIG.32-VOLTAMMETRIC RESPONSE FOR EACH WELL AFTER 0 MINUTES OF TMB INCUBATION, FOR COLUMN 2 ... 44
FIG. 33 – CALIBRATION PLOT FOR REDUCTION CURRENT PEAKS, AFTER 0 MINUTES OF INCUBATION IN TMB, FOR COLUMN 2 ... 44
FIG. 34 - VOLTAMMETRIC RESPONSE FOR EACH WELL AFTER 20 MINUTES OF TMB INCUBATION, FOR COLUMN 2 ... 45
FIG. 35 - CALIBRATION PLOT FOR REDUCTION CURRENT PEAKS, AFTER 20 MINUTES OF INCUBATION IN TMB, FOR COLUMN 2 ... 45
FIG. 36 - COULOMETRIC RESPONSE FOR EACH WELL AFTER 0 MINUTES OF TMB INCUBATION, FOR COLUMN 1 ... 46
FIG. 37 - COULOMETRIC RESPONSE FOR EACH WELL AFTER 0 MINUTES OF TMB INCUBATION, FOR COLUMN 2 ... 46
FIG. 38 - COULOMETRIC RESPONSE FOR EACH WELL AFTER 20 MINUTES OF TMB INCUBATION, FOR COLUMN 1 ... 47
FIG.39-COULOMETRIC RESPONSE FOR EACH WELL AFTER 20 MINUTES OF TMB INCUBATION, FOR COLUMN 2 ... 47
FIG. 40 - CALIBRATION PLOT FOR CHARGE RESPONSE AFTER 20 MINUTES TMB INCUBATION VERSUS CONCENTRATION OF GALECTIN-3, FOR COLUMN 1. ... 48
xvii
List of tables
1
Introduction
The title of my dissertation is “Electronic detection of neurological biomarkers of disease”.
This work aims at advancing knowledge regarding electrochemical properties of neurological signalling agents/neurotransmitters and other neurological biomarkers, and techniques used for their detection.
Throughout the course of five months, I was stationed in Institute of Technology Tallaght (ITT), an institute located in South Dublin County, in the fair land of Ireland, as a part of the Erasmus exchange programme. I worked in the Synergy centre, a hub for business incubation based on campus at ITT, under the guidance of Prof. Eithne Dempsey, who was kind enough to accept me as a guest in her team, entitled CREATE, which stands for Centre for Research in Electroanalytical Chemistry.
As described on the ITT website, CREATE has a number of ongoing research programmes spanning nanostructured materials, including nanoassembly, nanoparticle synthesis with use of modern electrochemical and surface based techniques for the study of fundamental material prop-erties; micro and nanosensor technology with applications in human and animal healthcare; elec-trocatalytic materials including design, isolation and purification of redox active materials (appli-cations in biomedical, fuel cell and environmental science).
The Centre has recent facilities that support all ongoing investigations, with a suite of elec-trochemical and multichannel potentiostats, and scanning elecelec-trochemical microscopy capability. This enables electrochemical and surface characterisation of synthesized materials/reagents and evaluation of sensor performance.
2
My project started with the purpose of developing an electrochemical sensor with applica-tions in the neurological area, mainly in the detection of new biomarkers for traumatic brain injury (TBI), or concussion.
Meanwhile, due to time constraints, my need for practise and reagent availability, the project turned into a general overview of possible advancements in electrochemistry, designed to answer the question, “how can we improve electronic detection of neurological biomarkers of disease?” Hence the wide-ranging title “Electronic detection of neurological biomarkers of disease”.
Firstly, the importance of this work is subjacent to the budding status of electrochemistry, which, despite being a relatively old area of study [1], is still used for multiple ends, with new developments every year.
The detection of neurological biomarkers of disease is extremely important when it comes to the diagnosis of said diseases. Electrochemistry can be helpful in that area, improving the de-tection in terms of speed, sensitivity, associated costs and simplicity.
This application of electrochemistry falls under the electroanalytical realm. Wang’s Analyt-ical Electrochemistry sheds some light on the topic, explaining some of its more practAnalyt-ical aspects.
For this project, I used potentiostatic techniques, which “deal with the study of charge -trans-fer processes at the electrode-solution interface”. The potential at the electrode is used to instigate an electron transfer reaction, working analogously to wavelength in optical measurements. Being
it a controllable parameter, it “can be viewed as ‘electron pressure’, which forces the chemical
species to gain or lose an electron”. This way, any electroactive species may be detected through these potentiostatic techniques, with very high selectivity. Even nonelectroactive substances may be detected indirectly. [2]
The selectivity can be corroborated by comparison of experimental voltammograms in non-ideal conditions for detection, such as physiological conditions, with simulated theoretical ones. Additionally, background subtraction, baseline determination and scan rate variations can en-hance the detection. [3] These processes eliminate interference of other components, making elec-trochemistry a reliable technique to be widely used for diagnostic purposes.
3
All three points mentioned above yielded some interesting conclusions that validate each of my approaches and allow some required follow-up work in the area, left undone by this disserta-tion.
Before said three approaches, there was time for practise and electrochemical characterisa-tion of the utilised neurotransmitters. That resulted in a poster made in collaboracharacterisa-tion with the
supervisor of this work, for the ITT Department of Science’s 15th Annual Science Research Day.
The poster was titled Electronic detection of neurological signalling agents and was awarded with the Best Poster honor.
5
Electrochemistry overview
Before moving on to further analysis of my project, it’s important to contextualize its major concept.
Electrochemistry involves, fundamentally, the transference of electrons between a
conduct-ing electrode’s surface and the molecules in the conductconduct-ing electrolyte solution adjacent to said surface [4]. Its basis is reduction/oxidation reactions.
Since many biomarkers of disease exhibit multiple electron oxidation processes, electro-chemistry becomes very important in the detection of said substances.
Electrochemistry includes a wide range of techniques, such as cyclic voltammetry (CV), chronocoulometry (CC), chronoamperometry (CA) and differential pulse voltammetry (DPV). Some of those will be used over the course of this work.
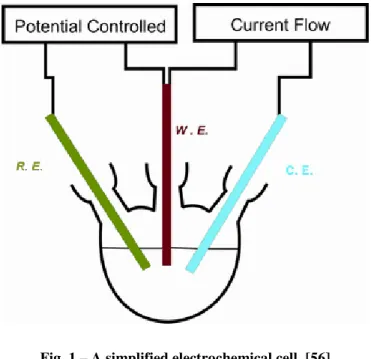
All the aforementioned techniques involve the application of a varying potential to a working electrode (WE), and the measurement of the current that flows through it. The potential is applied by a potentiostat and it must be relative to the potential of a reference electrode (RE). Therefore, the potential at the RE must remain constant. To achieve that, the RE is isolated so that no current passes through it. Since we need to have a current flow between the WE and another electrode, a third one is needed, the counter electrode (CE), so that current can pass through it [5]. This is valid for a three-electrode system.
The electrodes are dipped in a solution with the electrolyte - the electroactive species that will suffer the redox reaction as the potential shifts, allowing charge movements that will vary the equilibrium between the reduced and oxidised species at the electrode surface.
6
The electrodes and the analyte solution compose the electrochemical cell, schematized in figure 1.
The interface between the electrode surface and the bulk liquid is a double layer surface, analogous to a capacitor. Therefore, a change in the potential of the WE is accompanied by a rearrangement of the ions in the double layer, resulting in a capacitive current that contributes to the signal response. However, this background is normally very small. When it’s not, it can be digitally subtracted [6].
The main contributor to the readable current signal is the faradaic current. As Kelly puts it:
“The faradaic current that flows at any time is a direct measure of the rate of the electrochemical
reaction taking place at the electrode.” Furthermore, “the current itself is dependent upon two things: 1) the rate at which material gets from the bulk of solution to the electrode, known as mass transport, and 2) the rate at which electrons can transfer across the interface, or charge transfer
kinetics.” [7]. One can also add that the signal is proportional to the concentration of the electro-lyte. Logically, the presence of more molecules to electrolyse results in a higher current.
Moving on to the specific techniques, a CV is done by applying a triangular wave potential to the WE, like the one shown in figure 2-(a). This means we’ll have a positive scan – when the potential is increasing linearly with time – and then a negative scan.
7
During the first scan, the potential on the WE rises and, eventually, reaches a point in which the electroactive species is oxidised, resulting in a current growth, until it reaches a peak, the anodic peak current.
The CV characteristic peaks are due to the diffusion layers that form near the electrode sur-face, according to the analyte concentration distribution in the cell. [3]
The concentration of the reduced electroactive species close to the electrode surface depletes, which leads the current to drop and allows linear diffusion to occur, bringing more reduced
spe-cies closer to the electrode surface, where they’re oxidized, with some current generation.
The negative scan will result in the exact opposite process, only if the redox system is at least quasi-reversible. The oxidized species will suffer a reduction process due to the decreasing po-tential, causing the current to reach yet another peak, the cathodic peak current, which has the opposite direction of the anodic one.
In the end, the current is plotted against the potential and results in a plot like the one in figure 2-(b).
A CA measures the current response to an applied potential step waveform, which is plotted against time. The response is due to the electrolysis of the oxidized and reduced electroactive species. The plot for a CA follows the Cottrell equation:
𝑖 =
𝑛𝐹𝐴𝐶
𝑂𝐷
𝑂 1 2𝑡
12𝜋
12where n is the number of electrons transferred per molecule in the reaction, F is Faraday’s constant, A is the electrode surface area, COis the concentration of the oxidized species, DO is the diffusion coefficient of the oxidized species and t is time.
A CC measures the charge response against time, also after applying a potential step. Charge is the integral of current with respect to time, so the integration of the Cottrell equation gives us:
𝑄 =
2𝑛𝐹𝐴𝐶𝑂𝐷𝑂 1 2𝜋12
𝑡
12
[8]
Fig. 2 - (a) - Triangular
excita-tion potential. (b) - Typical
volt-ammogram for a reversible
8
A square wave voltammetry (SWV) isperformed by applying a waveform that consists “of a staircase scan, each tread of which is superimposed by a symmetrical double pulse, one in the forward direction and one in the reverse”. After a few cycles, the waveform presents the form of
“a bipolar square wave superimposed on the staircase”, explaining the name of the procedure. [9] A differential current (obtained from the subtraction of the reverse current waveform from the forward current waveform) is plotted in function of the applied potential.
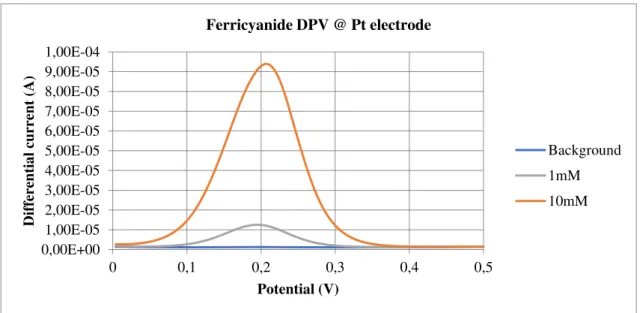
A DPV requires a staircase-shaped waveform [10]. The differential current (current differ-ence between two sequential potentials) vs potential response is then plotted. Figure 3 shows an experimental DPV plot for potassium ferricyanide at different concentrations.
Fig. 3 - Plot of current vs potential for a differential pulse voltammetry executed on a ferricyanide solu-tion, at a Pt electrode.
This technique (and all other pulse voltammetries) depends on the difference between the rate of the decay of capacitive and faradaic currents. As Swain [11] puts it, the system’s faradaic response is only noticeable closer to the redox potential, due to the electrolysis of the electroactive species, resulting in a high difference current. Then, as we move forward in the potential range, the current becomes diffusion-controlled and so the difference current lowers again, resulting in the characteristic peak we can see in fig. 3.
Despite not being directly related to electrochemistry, it feels pertinent to give a bit of context on a technique called enzyme-linked immunosorbent assay (ELISA), used to detect and quantify substances, normally antigens.
0,00E+00 1,00E-05 2,00E-05 3,00E-05 4,00E-05 5,00E-05 6,00E-05 7,00E-05 8,00E-05 9,00E-05 1,00E-04
0 0,1 0,2 0,3 0,4 0,5
Dif fer ent ia l c urre nt (A) Potential (V)
Ferricyanide DPV @ Pt electrode
9
There are three different types of ELISAs: direct, competitive and sandwich, the latter of which will be the used method in this project. The name derives from the technique itself, since the antigen or protein under scrutiny becomes sandwiched between specific capture and detection antibodies.
A good example of how a sandwich ELISA works is Lillehoj et al’s work [12], and it’s interesting to see it associated with electrochemical detection. The sensor surface is coated with a capture antibody, to which the Plasmodium falciparum histidine-rich protein 2 (PfHRP2) anti-gen attaches itself. In the presence of said antianti-gen, the PfHRP2 detection antibodies conjugated
with horseradish peroxidase in PBS bind to the sensor surface, as can be seen in fig. 4.
“Applica-tion of the TMB/H2O2 substrate with a voltage potential results in a substantial electrochemical
current directly proportional to the concentration of PfHRP2 protein in the sample”, allowing us
to detect and quantify the molecule.
TMB stands for 3,3’,5,5’-tetramethylbenzidine, which is a commonly used substrate in ELISAs.
11
Literature review
Neurotransmitter detection and electrode modification
The neurotransmitters under study have been considered in numerous investigations of bi-omarkers of disease. This first part of my literature review sets out to find cases that corroborate the diagnostic properties of the neurotransmitters under study [dopamine (DA), serotonin (ST), 5-hydroxyindoleacetic acid (5-HIAA)], to advocate the importance of their detection; and expand on the efforts being made by the scientific community to improve it.
Dawson et al [13] found out that DA plasma levels are significantly higher in patients which suffer from myofascial temporomandibular disorders (M-TMD) and “correlated significantly
with present pain intensity and perceived mental stress”.
Urinary 5-HIAA is used as a biomarker for neuroendocrine tumors [14] [15], mainly midgut carcinoids [16].
Additionally:
“the quantitative determination of DA and 5-HIAA, particularly in urine, is
im-portant (…) for the diagnosis of diseases such as Huntington’s and Parkinson’s diseases,
schizophrenia, attention deficit hyperactivity disorder (ADHD), restless legs syndrome (RLS), valvular heart disease, skin flushing, cramping, arthritis, wheezing, diarrhoea,
pel-lagra, cyanosis, telangiectasia and cramping.” [17]
12
correlation between the concentration of ST and baseline thrombolysis in myocardical infarction
frame count, which, as the authors say, is “a marker of coronary blood flow and vascular r e-sistance, reflects the severity of CMD and thus is useful to diagnosis (sic) the disorder”. Platelet
ST concentration might also indicate the severity and clinical progress of Alzheimer’s disease, as
studies show that its concentration is lower in later phases of the disease. [19]
Normally, these neurotransmitters are detected with resort to analysing clinical urine samples or by performing high performance liquid chromatography (HPLC) coupled with either an elec-trochemical system or liquid-chromatography tandem mass spectrometry. For example, in the aforementioned work, Dawson et al [13] used HPLC combined with electrochemical detection to quantify DA and ST plasma levels in patients who suffer from M-TMD. However, “not only are these methods time-consuming, laborious, expensive and require the use of skilled clinicians”,
but also “involve pre-extraction steps.” [17]
Therefore, Kanyong, Rawlinson and Davis [17] set out to test a more convenient option, the use of modified electrodes for selective detection of DA and 5-HIAA. Screen-printed graphite electrodes were modified with electrodeposited gold nanoparticles (AuNP). Through impedance measurements, they could conclude that the charge transfer rate on the electrode surface was in-creased due to the AuNP.
The cyclic voltammograms showed a separation and an increase of the two oxidation peaks, which can be seen in fig. 5,when using the modified electrodes. The modified electrodes were also used in spiked urine samples, with highly accurate and reproducible results, eliminating interference from other electrolyt-ical components in human urine. [17]
Another AuNP modified electrode was devel-oped with the same purpose by Gupta, Goyal and Shim [20], with successful results. However, this time, instead of graphite, carbon was used for the electrode screen printing.
The work of Babaei and Taheri [21] is another good case study of a modified electrode for selective detection of neurotransmitters, specifically ST and DA. The simultaneous detection of those neurotransmitters is hard through normal electrochemistry methods, due to the close redox potentials for both substances, making it unable to separate
the anodic peaks enough
to allow accurate detection of both substances. Another factor is the presence of interfering substances,Fig. 5 - CV on a mixture with 5 mM each
of dopamine (DA) and
13
such as ascorbic acid (AA), which exists in an in vivo concentration that’s around 100-1000 times higher than that of the neurotransmitters.
Babaei and Taheri’s work [21] went around these problems resorting to the modification of a glassy carbon electrode. They used a Nafion coating for the electrode, which is a polymer whose films are highly permeable to cations, but not to anions. In a wide pH range, which includes physiological conditions, both DA and ST exist in cationic form, while AA exists in anionic form. This ensures a selective attraction of the neurotransmitters, favouring their oxidations. Performing a layer-by-layer casting of multiwalled carbon nanotubes (MWNTs) combined with nickel hy-droxide [Ni(OH)2] on the electrode, they were able to alter the nanostructure of its surface. This
enhanced its electrocatalytical performance to DA and ST. The neurotransmitters selective detec-tion was successful. This is a case study that gives us a detailed insight on how to perform such modifications on an electrode, to satisfactory results.
Being 5-HIAA a metabolite of ST, allows their oxidation potentials can be found close to-gether, due to structural similarities, so their simultaneous detection requires a good degree of separation. Goyal et al [22] have described it at a “single walled carbon nanotube modified glassy carbon electrode” and a “gold nanoparticles modified indium tin oxide electrode.”
Selective detection of DA in the presence of AA was also successfully achieved by Florescu et al [23] with the use of modified Au electrodes with thin layers of cobalt (II)-porphyrins (CoP).
The presence of these porphyrins “was favourable for the affinity adsorption of DA”, since they “led to the decrease in the oxidation potential of AA and the enhanced oxidation peak currents of
DA at the CoP-modified Au electrode.” The technique used on the binary mixture was DPV, that showed sensitivity down to the micromolar range.
To provide a different example, Tertiș et al [24] dwelled on increasing the activity of an electrode surface area, landing on the development of a specific polypyrrole nanostructure. On the other hand, the decoration of this structure with gold (Au) nanoparticles increased the catalyt-ical effect of the analyte detection, much like the combination of MWNTs and Ni(OH)2 in a
pre-vious article [21]. This allowed a selective detection of ST in human serum samples, in the
pres-ence of interfering agents. This “tailored hybrid surface” fared much better than the bare
elec-trode, in terms of analytical performance [24].
14
Biomarkers of concussion, galectin-3 detection and ELISA
For this project, inspired by my supervisor, I decided to focus my research on biomarkers associated with mild traumatic brain injuries, commonly known as concussions.
The pathophysiological mechanisms underlying the entrance of biomarkers into the blood flow after a TBI are still unknown. Kawata et al [25] mentioned two options that are being con-sidered by the scientific community: firstly, damages the trauma can cause to the neurovascular unit – composed by neurons, astrocytes, microglia, oligodendrocytes and the cerebral endothe-lium – may disrupt the blood-brain barrier (BBB), allowing for the biomarkers to pass through it, into the peripheral circulation; the other theory involves the glymphatic system, a pathway whose function is that of clearing waste from the central nervous system, through bulk fluid motion. Following the injury and subsequent release of the neuron-derived proteins, the glymphatic sys-tem may facilitate its expelling from the brain into the blood flow.
Despite the uncertainty about the origin of the biomarkers in the bloodstream, it is accepted that they exist and can be used as a marker for certain diseases.
Plenty of studies have been done to assess specific biomarkers of concussion. A comprehen-sive list of some that have been studied so far is presented next [26] [27] [28].
The most significant ones are marked in bold:
— S100β– low-affinity calcium-binding protein in astrocytes;
— Tau– axonal microtubule-associated protein, that can take three different forms (T, A and C);
— GFAP (glial fibrillary acidic protein) – astroglial marker;
— NSE (neuron specific enolase) – catabolic enzyme, crucial in the glycolytic path-way for ATP production;
— STNF (αII-Spectrin N-terminal fragment) and other Spectrin breakdown prod-ucts (SBDPs);
— UCH-L1 (ubiquitin carboxyl–terminal hydrolase isoenzyme L1); — Copeptin;
— Galectin-3;
— MMP-9 (matrix metalloproteinases-9); — SP (substance P);
— sCD40L (soluble CD40 ligand);
15
— NFL (neurofillament light protein); — Amyloid beta;— BDNF (brain derived neurotrophic factor); — CK (creatinine kinase);
— h-FABP (heart-type fatty acid–binding protein); — Amyloid-β1–42 (Aβ42) peptide;
— Prolactin; — Cortisol;
— Albumin;
— Occludin;
— microRNAs –“small non-coding RNAs expressed by cells throughout the body and found in extra- cellular vesicles carried in the blood that modulate gene expression at the post-transcriptional level” [29], they have been recently considered for validation as bi-omarkers for TBI.
Their importance depends on the context of use, because the purpose for which is used has an influence in its required sensitivity, specificity and analytical details. Bogoslovsky et al [28] identified quite a few contexts of use: “identify patients who may require acute neuroimaging (CT or MRI); select patients at risk for secondary brain injury processes (e.g., increase of intrac-erebral pressure, hemorrhage growth, expansion of cintrac-erebral edema, ischemia or neuroinflamma-tion); aid in counseling with symptoms provided at discharge; identify patients who are at risk for developing postconcussive syndrome, posttraumatic epilepsy or chronic traumatic encephalopa-thy; predict outcome with respect to poor or good recovery; and inform decisions regarding when
to return to work or to play.” Additionally, the presence of copeptin, galectin-3, MMP-9 and occludin allowed discrimination between injury groups and healthy controls [25].
What’s clear from the extensive list presented above is that further study of biomarkers of
concussion is needed, in order to determine useful ones in terms of diagnosis.
From those, the choice for the project was set on galectin-3, not only due to the existence of easily accessible, albeit expensive, detection kits, under the form of ELISAs, that would allow us to study the protein; but also to the existence of a number of studies which conclude that plasma galectin-3 levels are elevated after intracerebral haemorrhage and are related with the severity of the injury [30], reflecting inflammation status post-secondary brain injury [31]. It’s noteworthy to point out that galectin-3 has also been considered as a biomarker for oncological monitoring and prognosis [32], adding to its importance.
16
quite time-consuming, costly and require thorough and experienced staff. This way, electrochem-istry has been paired with it to try to create an easier detection method.
Rossier and Girault [33] have worked in “a quantitative and rapid ELISA in a disposable
microchip with electrochemical detection”, with the aid of microfluidics. They developed a
sand-wich immunoassay for D-Dimer, the final degradation product in the blood coagulation mecha-nism. To enhance electron transfer, the enzyme horseradish peroxidase (HRP) was used, and, to lessen the long incubation times of ELISAs, photoablated microchannels with integrated elec-trodes were used, since the diffusion distance between the analyte and the electrode is greatly reduced. Therefore, the mass transport process is expedited. However, the limited space doesn’t allow the addition of a blocking solution that would stop the enzymatic reaction, so working in endpoint detection would not be available as it is in the commonly employed microwell plates.
Bhimji et al [34] tried a different approach to reach the same end, facilitating “electrochem-ical ELISA by performing antibody capture and readout in close proximity to large,
three-dimen-sional electrodes”. This tactic intended to contour the setbacks inherent to this sort of technique,
“typically carried out with layers of immobilization and recognition elements
at-tached to a sensor surface. Electrochemical sensors are often based on noble metals that are only reactive with a small number of functional groups (e.g., thiols) that do not form strong covalent bonds. This limitation may prevent the development of robust detection systems. Moreover, the immobilization of the assay components on the sensor may impede reaction of the reporter molecules with the sensor.” [34]
Flow injection analysis (FIA) was also coupled with an ELISA for electrochemical detection, by Croci et al [35]. For that end, they used “a thin-layer transducer cell for liquid
chromatography-electrochemistry”. A buffer was used to establish a baseline current and then the samples subject
to analysis were injected into the flow stream of the electrochemical cell (as FIA requires), pro-ducing current variations. Values above 21 μA would test positive for salmonella presence in the sample.
A simpler method, closer to the one used in the current project, was the sandwich immuno-assay used by Liu et al [36] to detect glucose. After the sandwich immunoreactions and the gen-eration of glucose in a microwell, the mixture was pipetted to carbon screen printed electrodes (SPEs). DPV was used to check the current response after adding potassium ferricyanide and an electrocatalytical enzyme, glucose oxidase, to the electrode.
17
structure or reducing its activity. Afterwards, they immobilised D-(+)-galactose on single-walled carbon nanotubes (SWCNTs), which act as a field-effect transistor, changing “resistance upon
exposure to proteins”.
Still on Park et al’s work [37], the electrochemical biosensor was constituted by molyb-denum electrodes connected by SWCNT strands and, rather than the direct redox potential of galectin-3, it measured“current-voltage difference that occurs on the surface of SWCNTs when galectin-3 is bound to D-(+)-galactose-conjugated SWCNTs” and sensitivity, based on resistance differences. Galectin-3 specifically binds to D-(+)-galactose and donates electrons to the SWCNTs, so, in its presence, there is an observed current decrease, when compared to its absence. This means that D-(+)-galactose-conjugated SWCNTs may be important nanobiosensors when it comes to galectin-3 detection, and that other electrochemical systems can be developed in order to detect galectin-3.
There is an open area when it comes to the electrochemical detection of galectin-3, that could be important to speed up that process, providing extra tools for diagnosis.
Point-of-care testing and smartphone-based systems
Point-of-care testing (POCT) is a form of medical diagnosis that happens close to the patient care area. The most widely-known example is diabetes screening, which is a quotidian test now-adays, rather than being confined to a laboratory setting and away from the patient.
Being electrochemistry a valuable tool when it comes to clinical diagnosis, the development of POCT systems is very important.
As a major example, CheapStat, a low-cost, easily fabricated portable potentiostat used in electrochemical measurements for analytical and educational purposes, was developed by Rowe et al. [38]
In the words of the authors, CheapStat is based in:
18
via a USB port. An operational amplifier feedback system sets the voltage across the elec-trochemical cell and supplies the current needed to drive the electrochemical reaction.” [38]
The results proved successful enough to release the instructions of its fabrication, firmware and schematics, under an open hardware license, available for researchers.
Fig. 6 - Circuit board of the CheapStat potentiostat system. [38]
Rapid developments in POCT have been happening due to the rise of smartphones. Their multifunctional characteristics and ability to store data and share it wirelessly, make them an inexpensive, quick and comfortable option for such testing. Roda et al [39] published an important
paper where they “critically review the most recent papers on the use of smartphones as analytical devices and biosensors”, which served as a good starting point for my literature review in this
area.
19
What makes smartphones so suitable for colorimetric tests is their built-in complementary metal–oxide–semiconductor (CMOS) sensors. These sensors collect and convert wavelength-in-dependent photons into RGB pixels. In this system, the light intensity and colour depend on the number of photons captured by each pixel. This way, the dispersion of a spectrum of absorbed
light along one of these sensors allows the assessment of a sample’s wavelength-specific absorb-ance, permitting the development of an accurate ELISA test.
In terms of biomedical diagnosis, in Long et al’s work [40], a relevant biomarker for cancer, interleukin-6 (IL-6) was successfully quantified in a human serum sample resorting to a smartphone camera.
Regarding the usage of smartphone-based systems in electrochemical measurements, with the objective of developing a low-cost system for POCT, some work has been done in the past few years.
Resorting to 2,4,6-trinitrotoluene (TNT)-specific peptide modified electrodes and another smartphone-based system, Zhang et al [42] used impedance measurements to detect TNT. The
peptides’ physical absorption to the SPE surface inhibits electron transfer through it and increases
impedance when TNT molecules specifically bind to them. The system “showed sensitivity to TNT in AC impedance around 20 kHz”. Other impedimetric biosensors have been developed. [43] [44]
In terms of amperometric biosensors, Sun et al [45] have developed what they call a
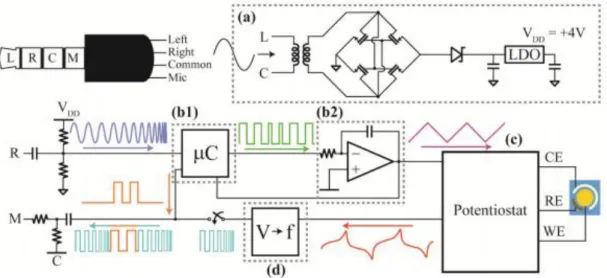
“smartphone-based electrochemical biosensor module”. The module includes a low power poten-tiostat powered by the smartphone through the audio jack, which also takes care of the commu-nication between the two. A schematic of the system is shown on fig. 7.The module “interfaces
with disposable screen printed electrodes (SPE)” and, in this paper, was used in CV experiments with an equal mixture of potassium ferricyanide and potassium ferrocyanide, applied on gold SPEs. The results were compared with voltammograms obtained with a bench-top potentiostat, matching well with the latter.
However, to get past the direct current blocking capacitors, the voltage from the potentiostat is mapped to audio band frequency, which is passed to the phone through the microphone port. The original current data is then obtained by taking the FFT of the data stream. [45] This algorithm makes it a rather inefficient method, which the team hoped to improve when working with an
20
Fig. 7 - Simplified schematic of the system developed by Sun, Wambach, Venkatesh and Hall: “The
power harvester (a) transforms, rectifies, and regulates a tone from the phone to a 4 V supply. The
microcontroller (b1) receives a trigger from the phone and uses the integrator (b2) to send a voltage
waveform to the potentiostat (c), which runs the experiment. The voltage to frequency converter (d) converts the resulting output to a frequency to be transmitted back to the phone.” [45]
Similarly to the previous example, Wang et al [46] developed MoboSens, another “audio
jack based miniaturized mobile phone electrochemical sensing platform”, which they used to
measure nitrate concentrations.
Abovementioned Lillehoj et al’s paper “Rapid electrochemical detection on a mobile phone” [12] describes a different mobile phone-controlled platform for biomolecular detection.
Their electrochemical sensor is comprised of gold electrodes fabricated on glass substrates, and located inside a microfluidic chip, in which the samples are driven by capillary flow. The system was used in the detection of PfHRP2, a biomarker for malaria. This was achieved by
“combining a highlyspecific (sic) protein binding scheme with high sensitivity enzymatic
ampli-fication”, working as a much faster ELISA. The electrode surface was coated with a polypyrrole
layer, which immobilizes the protein capture antibodies, with “no significant loss in protein
ac-tivity (…) for up to one year”. Not only did the system show high sensiac-tivity, detecting PfHRP2
antigen at a concentration of 16 ng/mL in human serum, as it had high selectivity, due to the protein binding scheme.
21
To make it compatible with older versions of Android, which do not support USB host
function-ality, the circuit includes a USB host shield and a microcontroller that, together, “operate as a
USB host-enabled accessory powered by a lithium ion battery”. This means that the phone itself does not work as an AC signal generator, in this case.
To end in a hopeful note, in Roda et al’s [39] aforementioned review, the group writes: “Of the analytical devices that exploit the smartphone as an instrumental interface, those based on
23
Description of procedures
Reagents and equipment description
The potentiostats used for this project were manufactured by CH Instruments Inc., and their
specific software was used, named ‘Electrochemical Workstation’, preceded by the model of the
device. Four different models were used: CHI920C, CHI1030, CHI660C and CHI420A. They only vary in terms of the available repertoire of electrochemistry techniques and parameter ad-justment.
The neurotransmitters had different proveniences: ST hydrochloride and 5-HIAA (commer-cialised as 5-hydroxyindole-3-acetic acid) were bought from Sigma Aldrich; DA (commer(commer-cialised as 3-hydroxytyramine chloride) was purchased from TCI Chemicals.
The SPEs were printed on a DEK 248 screen printer, onto Polymex PL2S8 250-micron pol-yester film substrate. DuPont BQ242 carbon conductor paste was used as ink, since it’s specifi-cally designed for carbon working electrodes in amperometric biosensors. Silver ink from Gwent
was used to create a pseudo RE. “Cover slips to define the electrode area were prepared by
lami-nation of a 3M gum layer to a layer of Melinex-O (PET material).” [47] The Epilog Laser’s Zing 16 laser cutter was used for cutting the cover slips.
For the SPE measurements, a DropSens adaptor was used.
To perform pH studies, I used a Britton-Robinson buffer as background, since it allows us to perform electrochemical analysis at different pHs. For the buffer, acetic acid (CH3COOH),
phosphoric acid (H3PO4), boric acid (H3BO3) and sodium hydroxide (NaOH) from Sigma-Aldrich
were used.
24
The nanoparticles used for the electrode modification were platinized tin carbon nanochips (PtSn/CNC), platinized gold carbon nanofibers (PtAu/CNF) and simple carbon nanochips (CNC), synthesized in the lab by previous team members.
The phone-operated potentiostat system already existed in the laboratory and it’s intended
for use on one of CREATE’s ongoing projects, entitled i-POPS (phone-operated paper sensors).
It hadn’t been tested or interpreted until my arrival in the laboratory. Regarding its components:
the LMP91000 is a sensor analog front-end system from Texas Instruments [48] and the FT311D is a USB android host developed by Future Technology Devices International Ltd [49]. The DPlot software was used to analyse the data obtained with the phone system.
Abcam’s mouse galectin-3 matched antibody pair kit was used for a sandwich-type ELISA. Tween® 20, BSA, PBS tablets, TMB substrate, orthophosphoric acid and other chemicals for the used buffers were bought from Sigma-Aldrich. The streptavidin-HRP came from Abcam.
Macroelectrodes
In the beginning, I had to gain experience in electrochemistry. The customary procedure in electrochemistry training is the detection of potassium ferricyanide (K3[Fe(CN)6]) through
vari-ous techniques: CV, CA, CC, DPV or SWV, the ones I would later use on a daily basis. After-wards, I moved on to neurotransmitter detection (epinephrine, DA, ST, 5-HIAA), to get ac-quainted with their redox behaviour.
For all of the above, I used a three-electrode electrochemical cell, composed by three macroelectrodes, whose designations
I’ve stated in the ‘Electrochemistry overview’ chapter of the
dis-sertation. The WE was either gold (Au), platinum (Pt) or a GCE. The RE was a silver chloride electrode (Ag/AgCl). The CE was a Pt wire. The system can be seen on fig. 8. The electrodes are placed in the electrochemical cell, all at the same height, with their surfaces dipped in the electrolyte solution. The measure-ments were carried out at room temperature (RT). Afterwards, each of the electrodes had to be rinsed with deionized water (DW).
Additionally, the WE has to be rinsed with DW and polished to a mirror finish before each measurement. Since the electro-chemical reactions depend on an appropriate transfer of electrons
Fig. 8 – Electrochemical cell
with a three-macroelectrode
system. Green – WE; White –
25
between the bulk solution and the WE surface, that process will depend on the microstructure of the surface, which is why polishing and cleaning it is so important [50]. The electrode surface is polished on a polishing pad with alumina powder of 1, 0.3 and 0.05 µm, in that order. The pol-ishing motion should be done in a figure eight, to guarantee a uniform polpol-ishing of the surface.
The Ag/AgCl RE, when not in use, must be kept in a 3 mM potassium chloride (KCl)
solu-tion, so it won’t dry, which would ruin the electrode. The Pt wire and the different WEs were
stored dry. All of them were stored at RT.
The potentiostat is switched on and the computer program associated to it is set up.
After the experiment halts, the data is acquired and the software plots it. Afterwards, it can be extracted to an Excel worksheet and/or saved as a binary file, to be analysed subsequently.
Electrochemistry performance and plot analysis
After the technique selection in the Electrochemical Workstation software, some parameters may be adjusted. As an example: for the cyclic voltammetry, the initial, final, lower and higher potential can be defined (may depend on the potentiostat model), the scan rate (represented by ν; it is the speed at which the potential is swept, in V.s-1), the initial scan polarity (to choose the
direction of the initial potential sweep), the number of sweep segments, the interval between each acquired sample (in volts), the quiet time before starting the measurement and the sensitivity (given in A.V-1).
For the neurotransmitter studies, I have performed customary scan rate studies, to see how the current response varies with it. Afterwards, the different oxidation peak currents can be plotted against the square root of the scan rate, which should result in a linear dependence consistent with the Randles-Sevcik equation [51]:
𝑖𝑝= 2.69×10⁵. 𝑛 3
2𝐴𝐷12𝐶𝜈12
Also, the logarithm of the oxidation peak current versus the logarithm of the scan rate should also result in a linear dependence. The slope of the linear dependence is important. A value closer to 1 suggests an adsorption-controlled process [52], whereas one that’s closer to 0.5 suggests a diffusion-controlled process [53].
For the pH studies, the Britton-Robinson buffer was made using 17.4 M CH3COOH, 14.7 M
H3PO4 and 0.04 M H3BO3, resulting in a very acid, below-2 pH. It was then titrated with 0.2 M
(NaOH).
26
Nernst equation, at 25ºC (E0=59 mV), in case the number of transferred protons and electrons in
the reaction is the same [54].
I also performed concentration studies, to study the proportionality of current/charge values and concentration.
Screen printed electrodes
The use of SPEs facilitates the process of electrochemical analysis, since they are disposable after one use and don’t require the cleaning and polishing process the macroelectrodes do. The SPE were printed in house using the previously mentioned screen printer, following CREATE’s
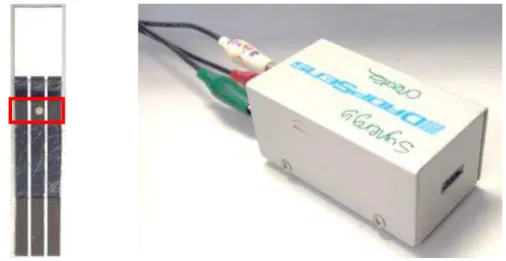
usual protocol. The printer’s squeegee forces the carbon ink through a screen, onto the polyester film substrate, in a selected shape. In this case, it was a simple three track design, that can be seen on fig. 9 (left). The substrate is left overnight at RT before further use. A silver pseudo RE was created by applying a dot of silver ink on one of the tracks, which is then left to cure overnight at RT.
Some Melinex-O cover slips were cut using a carbon dioxide laser, and sticked to the elec-trode surface, exposing a defined elecelec-trode area (2 mm2). The electrode area is shaped like a small
rectangle, and it’s where the silver dot is located and the analyte is applied.
The cut out individual electrodes were introduced in the socket of the adaptor [fig. 9 (right)] to collect the electrochemical data, by connecting the adaptor to the previously referenced poten-tiostats.
Fig. 9 – Left - Carbon SPE with three track design, with silver ink dot and applied cover slip, which
exposes the electrode area, marked by the red rectangle in the image.
27
Electrode modification
The nanoparticles were adsorbed onto the SPE surface, acting as electrocatalysts for the elec-tron transfer between the analyte and the surface. They were dissolved in a mixture of 1% Nafion in isopropyl alcohol/water already existent in the laboratory, in a concentration of 1 mg/mL.
Small Eppendorf tubes with 0.5 mL of each nanoparticle mixture were stored in the lab at RT. Before each use, they were centrifuged for homogenisation. 2 μL were then uniformly pipet-ted with care onto the working electrode strip of the electrode area and allowed to dry in an incu-bator at 37ºC.
After drying, I performed CVs at the modified electrodes, on PBS background and 0.5 M sulphuric acid (H2SO4) - the latter of which exacerbates the nanoparticles electrocatalytical effect
- to assess if the adsorption process was successful. After that, the electrode is not reusable, but at least it shows that the process is adequate, albeit not perfect and subject to mistake.
The different modified electrodes were then used to plot voltammograms (CV, DPV) for each of the neurotransmitters (DA, ST, 5-HIAA) at different concentrations in Britton-Robinson buffer and a 10 μM equimolar mixture in Britton-Robinson containing all of them simultaneously
to test the selectivity. In this case, the buffer’s pH was 7, to mimic physiological conditions.
Phone-operated system
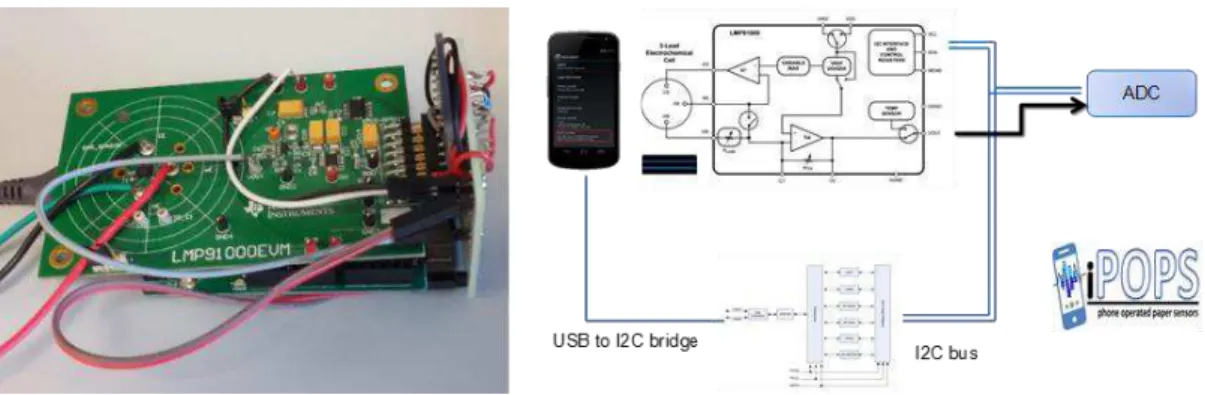
An overview of the phone system hardware and its schematic are presented in fig. 10, on the left and right, correspondingly.
Fig. 10 – Left - Setup of phone-operated system. The green board is the LMP91000, which
connects to the screen-printed electrode adaptor via the coloured wires. The perpendicular
component is the ADC and the bottom board is the FT311D. The system connects to the phone
via USB.
28
The LMP91000 provides a path between the electrochemical sensor and a microcontroller. The information regarding the component was taken from its datasheet, as its schematic (fig. 11). The sensor is analogous to the previously described electrochemical cells, with 3 leads. Its output is a current proportional to the concentration of the analyte.
The circuit is composed by two major elements: potentiostat and op-amp.
The embedded potentiostat, under the form of a bias circuit, applies a potential difference to the electrochemical cell. It maintains a correct bias potential between the WE and the RE, by adjusting the voltage of the CE.
The low current values are then converted to measurable potential values by an op-amp.
Fig. 11 – Schematic for the LMP91000 analog front-end system, with the bias
cir-cuit acting as potentiostat and an op-amp. [48]
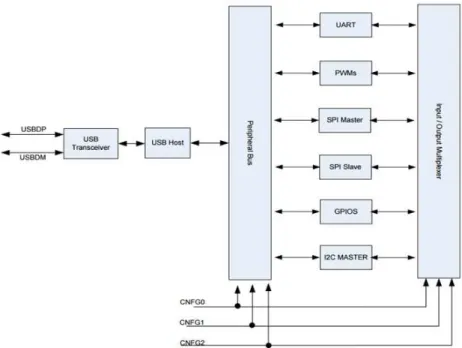
Fig. 12 – FT311D schematic. It shows the six different methods of connection between the
29
The analog potential (VOUT) is converted to digital by an analog-to-digital converter (ADC) and transmitted to the smartphone by the FT311D USB host, shown in fig. 12.
The host is designed to provide access from an Android platform to peripheral hardware, and vice-versa, via USB. It has six different communication methods. For this project, I2C Master was used. I2C is a serial bus with a master component which receives/sends data from/to slave interfaces, respectively.
An Android app is installed on the smartphone that is connected to the system. A screenshot of it is shown on fig. 13.
The app is designed to control the previously described hardware. It simply allows us to select the start and end po-tentials, and the transimpedance gain of the op-amp circuit, which includes seven values that range between 2750 kΩ and 350000 kΩ. The gain determines the sensitivity of the sys-tem, through adjustment of the feedback resistor of said cir-cuit. The fine-tuning of the gain avoids system saturation when the analyte concentration is high.
After the parameter selection, when the ‘Pulse’ button
is hit, the data acquisition starts. The app shows a preview of the obtained signal.
The signal response is saved as a .txt file, with an auto-matic filename attributed to it. Afterwards, the file can be transferred to a computer to be analysed.
The data is plotted as current vs number of samples. Di-viding by the sampling rate in DPlot, the horizontal axis can be changed to time, resulting in a CA plot. Also, by integra-tion of the plot, we can obtain a CC curve, which was the standard procedure used for the smartphone system-obtained data.
Fig. 13 – Screenshot of the i-POPS
software. The drop-down box that
shows 350000 corresponds to the
gain selection and the next two to
the start and end potentials, in
that order.
The represented signal is merely
30
ELISA
The ELISA kit includes a titrated unlabeled capture antibody, a titrated biotin-labeled detec-tor and a calibrated protein standard. It also comes with a booklet that contained clear instructions on how to use it, which were followed rigorously, with a few exceptions.
Some essential materials were required, but not supplied. Those included: — coating buffer: 35 mM NaHCO3, 15 mM Na2CO3, pH 9.6;
— blocking buffer: 1% BSA, 0.05% Tween® 20, in 1X PBS, pH 7.2 - 7.4; — wash buffer: 0.05% Tween® 20 in 1X PBS;
— TMB substrate;
— stop solution: 4.9% orthophosphoric acid;
— 10X PBS: 0.14 M NaCl, 0.003 M KCl, 0.002 M KH2PO4, 0.01 M Na2HPO4, pH 7.4;
— streptavidin-HRP solution: 50 μg/mL, diluted to 0.01-0.05 μg/mL in 1X blocking buffer.
A 96-microwell plate had to be prepared for the assay. The bottom of each well was coated with capture antibody, after these steps:
— add 50 μL of 2 μg/mL capture antibody in coating buffer to each well; — seal the plate and incubate it overnight at 4ºC;
— wash plate three times with 350 μL of 1X wash buffer, each time removing the buffer
completely by tapping the plate vigorously against a pad of absorbent towels; — add 300 μL of 1X blocking buffer to each well, seal the plate and incubate overnight
at 4°C, to reduce non-specific binding; — repeat wash procedure.
After this, the plate is ready to be used for an assay or it can be stabilized with 1X blocking buffer and stored at 4ºC.
The protein standard sample has to be reconstituted in 100 μL of deionized water, resulting in a stock standard concentration of 100 ng/mL, and then stored at -80ºC. Immediately prior to use, the stock standard must be serially diluted to fit in a row of 8 wells. The booklet suggests that the standard #1 should have a concentration of 1 ng/mL in 1X blocking buffer, but we decided that was too high and settled on 0.1 ng/mL. When my CREATE colleague Camilo Mendes Menezes performed the assay for the first time, with my assistance, we could conclude that such concentration of 0.1 ng.ml-1 for standards #1 was still too high, since the spectrophotometer would
overflow when reading those wells. So, we adjusted the concentration down to 0.05 ng.ml-1.
31
After having all of the materials and completing the aforesaid steps, the assay procedure was executed as following, always in duplicate:
— add 50 μL of the diluted standard samples to each well. Seal the plate and incubate for 2 hours at RT;
— repeat the wash step from the plate preparation;
— dilute detector antibody from stock concentration of 0.25 mg/mL to the suggested working concertation of 0.5 μg/mL in 1X blocking buffer;
— add 50 μL of the diluted detector antibody to each well and incubate for 2 hours at
RT; — wash step;
— add 50 μL of diluted HRP-Streptavidin solution to each well. Seal the plate and in-cubate for 1 hour at RT;
— wash step;
— add 100 μL of TMB substrate to each well, cover plate and incubate for up to 20 minutes (incubation period subject to optimisation);
— add 100 μL of stop solution to each well.
The oxidation of the TMB substrate gives the wells a bright blue colour, which turns to yellow after adding the stop solution, halting the oxidation reaction. The normal procedure is to measure the plate absorbance on a spectrophotometer, at a 450-nm wavelength, something I did once to calibrate the assay.
The electrochemical analysis was approached in two different ways. Firstly, after adding the stop solution, I pipetted a bit of each well onto an SPE and performed CV, CC and DPV.
Since the results weren’t favourable, I skipped the stop solution step and performed CV at
different times after adding TMB (0, 2, 5, 10 and 20 minutes), to check the voltammogram evo-lution. The initial sweep direction was negative and the initial potential value was derived from the maximum value of the unaltered TMB voltammogram, which was inadequate for this end.
However, the promising results led me to repeat the technique in a more refined, definitive manner. For that, I used the concept of open circuit potential (OCP). This is the potential at which the anodic and cathodic currents are in equilibrium. Therefore, by starting the measurement at the OCP and sweeping it in a negative direction, I could favour the reduction reaction, and gauge the variation of the peak reduction current value with the concentration of galectin-3, reducing elec-trode saturation effects.
32
CC requires the setting of the beginning and end of the applied single potential step. Those
parameters can be adjusted in the software. The beginning is set at a potential where there’s still
no electrolysis happening. The end is set shortly after the peak, so we can get the charge response during the electrolysis process. Since I had previously collected the CV plots, I knew the potential step values I had to apply for each concentration. This information is also valid for the neuro-transmitter analysis.
The potential step was applied for a standard time of 4 seconds, enough to allow electrolysis to happen.
33
Results
Neurotransmitters’ electrochemical characterisation
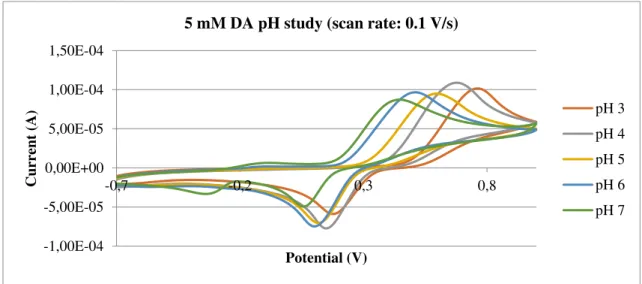
Fig. 14 shows the result of a pH study for DA, resorting to CV. Some curves were omitted to not overstuff the plot. One can easily see that both oxidation and reduction peak potentials shift to the left with higher pHs. At the pH 7 solution, the reduction peak is smaller, which means that the reaction is less reversible. A second residual peak appears closer to more negative values.
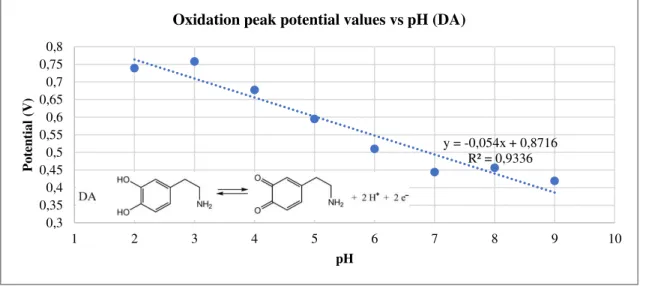
Fig. 15 is the plot of the oxidation peak potential values versus pH. There is a clear linear trend, corroborated by the high coefficient of determination (R2). The slope is very close to 0.059,
the Nernstian theoretical value for equal electrons/protons partaking in the redox reaction. DA’s electrochemical mechanism is a two electron/two proton exchange. [55]
Fig. 14 – pH study for 5 mM DA (in Britton-Robinson buffer), at a GCE electrode. CV was used.
Maximum potential: 1 V.
5
-1,00E-04 -5,00E-05 0,00E+00 5,00E-05 1,00E-04 1,50E-04
-0,7 -0,2 0,3 0,8
Curre
nt
(A)
Potential (V)
5 mM DA pH study (scan rate: 0.1 V/s)
34
Fig. 15 – Oxidation peak potential values plotted against pH, for 5 mM DA (in Britton-Robinson
buffer) pH study, with embedded chemical two proton/two electron mechanism. [55]
Fig. 16 – DPV for DA in Britton-Robinson buffer at different concentrations, measured at a GCE.
Fig. 16 shows the plots of DPV for DA at different concentrations. There is a shift of the peaks to more negative values that seems to be related to the concentration of the neurotransmit-ter.
Fig. 17 shows a scan rate study for DA. The scan rate increase leads to a shift of the peak potentials to more positive values. That suggests that the reaction is quasi-reversible [21], con-firmed by the smaller reduction peaks on the voltammogram.
y = -0,054x + 0,8716 R² = 0,9336
0,3 0,35 0,4 0,45 0,5 0,55 0,6 0,65 0,7 0,75 0,8
1 2 3 4 5 6 7 8 9 10
Po te n tia l (V ) pH
Oxidation peak potential values vs pH (DA)
0,00E+00 1,00E-06 2,00E-06 3,00E-06 4,00E-06 5,00E-06 6,00E-06 7,00E-06
0 0,1 0,2 0,3 0,4 0,5 0,6 0,7
Curre
nt
(A)
Potential (V) DPV Dopamine (pH 7)
0,01 mM
0,1 mM
0,5 mM
35
Fig. 17 – CV used for 5mM DA (in Britton-Robinson buffer) scan rate studies, at pH 7, at a GCE.
Similar studies were done for the other neurotransmitters, with no additional
note-worthy results.
-1,50E-04 -1,00E-04 -5,00E-05 0,00E+00 5,00E-05 1,00E-04 1,50E-04 2,00E-04-0,7 -0,2 0,3 0,8
Curre
nt
(A)
Potential (V)
5 mM DA scan rate study (pH 7)
36
Electrode modification
The modified electrodes were used to see their effect on the neurotransmitters detection. Before, I had already worked with each of them on unmodified electrodes. Fig. 18 shows the DPV peak potentials for each separate compound, overlapped in one graph.
Fig. 18 – Comparison of the peak potentials for each neurotransmitter, at a concentration of 10 μM
in Britton-Robinson buffer at pH 7, at unmodified SPEs.
DA has a peak around 0.17 V. ST and 5-HIAA both share the same peak potential of around 0.34 V.
DA’s peak shifted to more negative potentials with a decrease in concentration, so I decided to
compare the three potentials at 10 μM concentration, the same I used for the equimolar solution.
Fig. 19 – Plot for DPV performance on the 10 μM equimolar solution, at an unmodified SPE. 4,00E-07 6,00E-07 8,00E-07 1,00E-06 1,20E-06 1,40E-06 1,60E-06
0 0,1 0,2 0,3 0,4 0,5 0,6 0,7
Curre
nt
(A)
Potential (V)
Peak potential values comparison (10 uM, pH 7)
Dopamine 5-HIAA Serotonin 0,00E+00 5,00E-08 1,00E-07 1,50E-07 2,00E-07 2,50E-07 3,00E-07 3,50E-07 4,00E-07 4,50E-07
-0,5 -0,3 -0,1 0,1 0,3 0,5
Dif fer ent ia l c urre nt (A) Potential (V)
![Fig. 6 - Circuit board of the CheapStat potentiostat system. [38]](https://thumb-eu.123doks.com/thumbv2/123dok_br/16545408.736917/36.892.110.734.296.719/fig-circuit-board-cheapstat-potentiostat.webp)