RBRH, Porto Alegre, v. 23, e49, 2018 Scientific/Technical Article
https://doi.org/10.1590/2318-0331.231820180014
Hydrological simulation uncertainties in small basins through the SWAT model
Incertezas na simulação hidrológica em pequenas bacias por meio do modelo SWAT
Pedro Thiago Venzon1, Adilson Pinheiro1 and Vander Kaufmann1
1Universidade Regional de Blumenau, Blumenau, SC, Brasil
E-mails: [email protected] (PTV), [email protected] (AP), [email protected] (VK)
Received: January 31, 2018 - Revised: June 27, 2018 - Accepted: August 24, 2018
RESUMO
A modelagem hidrológica é uma das principais ferramentas de apoio à gestão dos recursos hídricos. Entretanto, vários fatores dificultam
a extrapolação dos parâmetros estimados em bacias com grandes áreas de contribuição para bacias de pequena dimensão. O objetivo deste trabalho foi analisar as incertezas na simulação de vazões em bacias de pequena dimensão. O processo metodológico envolveu a aplicação do modelo de simulação hidrológica Soil and Water Assesssment Tool (SWAT) à bacia representativa do ribeirão Concórdia (30,74 km2) e à bacia do rio Itajaí (15.000 km2). Primeiramente, comparou-se 6 cenários distintos de discretização das unidades de
respostas hidrológicas (HRUs) na calibração e validação da bacia hidrográfica do ribeirão Concórdia, avaliando-se a influência do número de HRU na simulação de pequena bacia hidrográfica. Em seguida, calibrou-se os parâmetros do modelo para a bacia do rio Itajaí, em 12 estações fluviométricas. Posteriormente, determinou-se uma tendência de variação dos parâmetros calibrados através da
formulação de equações de regressão. Estas equações foram elaboradas a partir da correlação entre os índices físicos de cada estação
fluviométrica considerada e seus valores. No presente estudo, a discretização das HRUs indicou que não há necessidade de aumentar o número de HRU quando o objetivo a ser alcançado é representar os picos do fluxo de água na pequena bacia hidrográfica. Os resultados obtidos com a aplicação das equações de regressão demonstraram que o coeficiente de compacidade (kC) pode gerar até 42,1% de variação na vazão média e 82,7% na Q95 das sub-bacias. Portanto, a utilização das equações de regressão pode auxiliar na redução das incertezas geradas durante a calibração dos parâmetros.
Palavras-chave: Modelagem hidrológica; Escala espacial; Gestão de recursos hídricos.
ABSTRACT
Hydrological modelling is one of the main tools in water resources management application. However, several factors make it difficult
to extrapolate the estimated parameters in basins with large contribution areas to smaller basins. This research analysed the uncertainties
of flow simulations in small basins. The methodological process involves the application of the hydrological simulation model, the soil
and water assessment tools (SWAT) to the basin of the Concordia River (30.74 km2) and the Itajai River basin (15,000 km2). First, six different scenarios of the hydrological response units’ (HRUs) discretisation were compared in the Concordia River basin calibration
and validation, evaluating the number of HRUs influencing the small river basin simulation. Then, the model parameters for the Itajai River basin were calibrated in 12 fluviometric stations. Subsequently, the calibrated parameter variation trend was determined through
the formulation of regression equations. These equations were developed from the correlation among the physical indices of each
fluviometric station and their values. In the present study, the HRUs’ discretisation indicated there is no need to increase the number of HRUs when the goal is to represent the water flow peaks in the small river basin. The results obtained with the application of the regression equation showed the compactness coefficient (kC) could generate up to 42.1% of variation in the mean flow and 82.7% in Q95 of the sub-basins. Therefore, the use of regression equations can help reduce uncertainties generated during parameter calibration.
INTRODUCTION
Water resources management is important for water quality control and availability. Unsustainable use can result in shortages and limitations in water consumption. Considering the qualitative and quantitative aspects of these resources, in an abundant situation water is treated as a free commodity. However, with the increase in
demand conflicts can occur among the users (CARR; BLÖSCHL;
LOUCKS, 2012; ARAÚJO; NASCIMENTO; OLIVEIRA, 2016). To carry out water resources management it is necessary to understand the hydrological behaviour of the basin, making it
possible to quantify the anthropic influence, effects and establish
measures for its control (CARVALHO; CURI, 2016). The estimation
of reference flow rates for the application of water resource
management tools in small hydrographic basins is hampered by
different factors, such as the low density of fluviometric stations
or short historical series. In these basins hydrological simulation models that can be used with an absence or scarcity of data could be a solution (ANDRADE; MELLO; BESKOW, 2013).
Distributed hydrological models with a physical or semi-physical base can be used to overcome these difficulties;
they predict the existence of a relationship among the parameters and basin characteristics (DANIEL et al., 2011). However, several
factors influence the hydrological model parameters values, such
as the contributing basin size (SANTOS et al., 2014). This makes
it difficult to extrapolate the contributing basin’s estimated
parameters to the small basins (LOEWEN; PINHEIRO, 2017).
For the fluviometric sections without data, the parameter estimation
should happen based on the basin’s physical characteristics, if the relationships are well established.
The soil and water assessment tool (SWAT) model (ARNOLD et al., 2012) has become an efficient tool in hydrological assessments of different basin scales and environmental conditions. Government agencies and private companies support decision-making associated with water resources using the SWAT. Also, universities use the tool in forecasting and controlling water quantity and quality. The SWAT model considers the digital elevation model of the region and automatically delimits the sub-basins. The river basin subdivision is displayed in hundreds to thousands of cells, representing homogeneous hydrological response units
(HRUs) which reflect the differences in soil type, vegetation cover,
topography and land use on site (ARAGÃO et al., 2013). The SWAT model has shown satisfactory results in applications related to climatic and hydrological scenarios (BRESSIANI et al., 2015; FRANCESCONI et al., 2016; PEREIRA et al., 2016;
MOLINA-NAVARRO et al., 2014), making it a potential tool to
support water resources management. However, the studies that
verified the HRUs and the sub-basins discretisation presented
controversial results in relation to their applicability (HER et al., 2015; WHITE; CHAUBEY, 2005; BUENO et al., 2017). Bueno et al. (2017) found that the HRUs and the sub-basins discretisation are
directly proportional to the improvement in the flow and water
yield representation in the basin. In contrast, Her et al. (2015) concluded the main factors that require better HRUs discretisation are sediment production and water quality, rectifying the need to
study the spatial discretisation influence on nutrient production
raised by White and Chaubey (2005). They leave open the question
of how to formulate the model discretisation to obtain the best representation in small basins.
The sub-basins’ discretisation has been considered in the calibration and validation of different hydrological models. On the European continent, Abbaspour et al. (2015) classified the study area (drainage area of 9.4 million km2) into 8,592 sub-basins, using 34 sub-basins for SWAT model calibration, in the nitrate
flow simulation of the continent. In South America, Adam et al. (2015) applied the MGB-IPH model to the Parana basin (drainage area of 800,000 km2), to evaluate the effects of climate change
on the flow. The model was calibrated and validated for four fluviometric stations. The simulations for sub-basins with large
drainage areas were performed. Sub-basins with small drainage areas were not evaluated.
Because it is a spatially distributed model, the SWAT model parameters represent the physical phenomena that occur in the basin. Consequently, they may be affected by the spatial scale change of the simulated drainage area. In the Itajai River basin, located in the Santa Catarina state, there is the Concordia River basin. It has a drainage area of 30.74 km2, whose temporal data series is adequate for the application of the hydrological simulation model distributed of semi-physical base, allowing evaluation of
the spatial discretisation effect on the reference flow estimation.
The objective of this research is to analyse the uncertainties in the SWAT parameter calibration in basins with different
dimensions for further flow series spatialisation. The aim is to
contribute to the advancement of water resources management in regions that lack data.
MATERIAL AND METHODS
The methodological process involves the application of the SWAT hydrological simulation model to the representative basin of the Concordia River, with a drainage area of 30.74 km2, and to the Itajai River basin, with a drainage area of 15,000 km2. Regarding the applications, the hydrological response units (HRUs) spatial discretisation and the model parameters’ spatial distribution have been considered. The research consists of evaluating the HRUs’ importance in the calibration and validation of a representative basin and determining a trend in the parameters adopted in the calibration of different river basin dimensions.
Study area
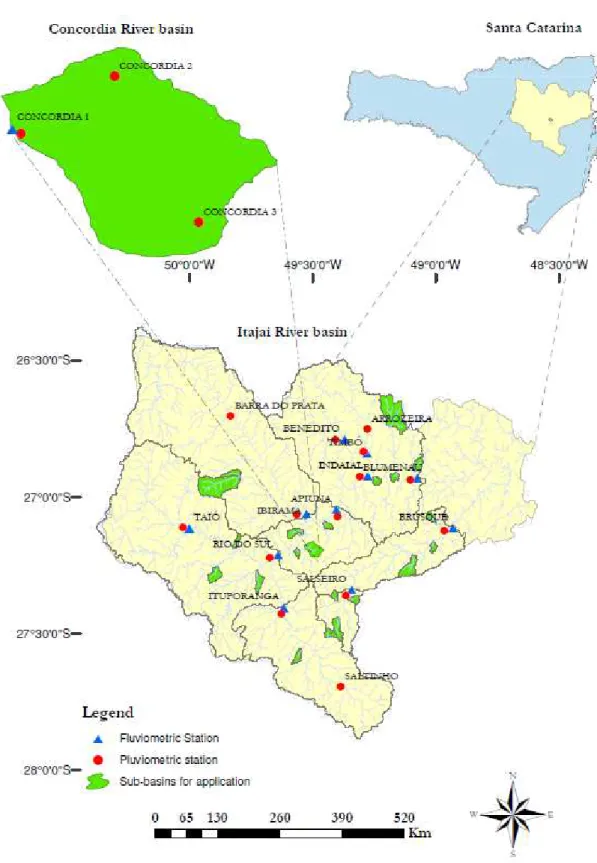
The Concordia River basin was chosen as the study area (Figure 1) due to its monitoring since 2005, initiated by the Environmental Recovery Project and the Small Producer Support Plan (PRAPEM/MICROBACIAS) and prepared by the
Department of Agriculture and Rural Development of the state
of Santa Catarina to improve the environmental management of rural areas.
The choice of the Itajai River basin assisted in the project
‘Effectiveness of the Framework in the Itajai River Basin’, financed by the Sustainable Development Secretariat (SDS) of the state
of Santa Catarina. The objective of this project is to carry out a water quality diagnosis of the Itajai River basin courses, aiming
at developing a framework. This study will contribute to the determination of nutrient loading in the river basin watercourses,
making use of the flow series in each simulated HRU.
The spatial parameters were distributed by adjusting the
SWAT model of the Itajai River basin in 12 fluviometric stations.
Figure 1. Study Area.
The observed flow series were compared with the simulated flows series separately in each station. The criteria for choosing each fluviometric station was the monitored data quality and the
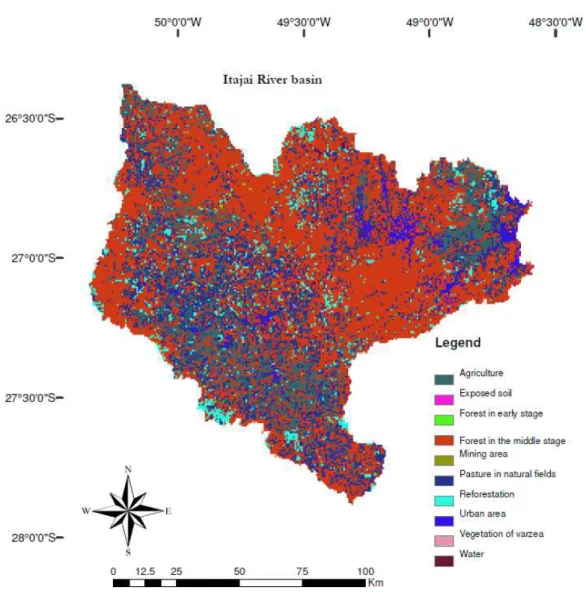
drainage area variation in each sub-basin. Land use follows the same pattern as the Concordia River basin fragmentation, however there are places with high rates of human occupation.
Hydrological data
A total of 17 rainfall stations were used, of which 14 were
available in the HidroWeb database of the National Water Agency
and the others obtained through monitoring in the Concordia River basin. The daily data available for each rainfall station covers the period from 01/01/2002 to 12/31/2016. The failures used a simple linear regression method (ANA, 2012b). In this method, the failed rainfall station precipitation is always correlated to its neighbouring station.
The first step was to verify the influence of the HRUs’
discretisation in the small Concordia River basin using the
fluviometric station. The calibration took place during the period 01/01/2008 to 12/31/2013. Over the first two years, the data were
left in order to heat the model. Model validation occurred during the period 01/01/2014 to 12/31/2016. Both periods mentioned
are available in daily fluviometric data form.
The spatial discretisation effect performed in the Itajai River
basin used 12 fluviometric stations (Table 1) for calibration of the model parameters. Correlations with the drainage areas’ physical factors were also analysed. The periods considered for calibration and validation occurred from 01/01/2008 to 12/31/2012 and from 01/01/2013 to 12/31/2016, respectively. The model-heat
period was the same as the previous stage (influence of the HRUs’ discretisation in the small Concordia River basin). The fluviometric
data series were consistent with the methodology described by
ANA (2012a). Figure 2. Distribution of land use in the Itajaí river basin.
The SWAT model
The SWAT model interface, the ArcSWAT, was used as a tool to analyse the steps discussed in the paper: the HRUs’ discretisation uncertainties (Table 2) and the spatial distribution effect of the parameters (Table 3).
In the parameters’ spatial distribution step, the value 400 ha was used to discretize the Itajai River basin into 2,086 sub-basins. Each HRU was considered equal to a sub-basin. Thus, 2,086 HRUs were employed to simulate the hydrological processes in the Itajai River basin.
The computer applied in the project development was a laptop with a 64-bit operating system, 4 CPUs, 16 GB RAM and 2.8 GHz processors. Processing time ranged from 1 hour to 24 hours depending on the number of HRUs used in the model discretisation.
Calibration and validation
Calibration occurred in an automated manner using the software SWAT-CUP (version 5.1.6, Texas A&M University) with the SUFI-2 algorithm (ABBASPOUR, 2015). For each algorithm interaction 1,000 simulations were adopted. The objective functions
which indicated the SWAT adjustment were the Nash-Sutcliffe coefficient (NS) and the bias percentage coefficient (Pbias).
The NS was selected because it indicates how close the
simulated data is to the observed data. Pbias examines whether the observed data sum is greater or less than the simulated data sum. Positive Pbias values indicate the model is underestimating
the observed series. Negative Pbias values indicate the model is
overestimating the observed series.
As the SWAT model was evaluated on a daily basis, the satisfactory values range recommended by Moriasi et al. (2007)
for the NS and Pbias coefficients were adopted, being: NS ≥ 0.5 and Pbias ≤ ± 25%.
HRUs Discretization
The influence of the number of HRUs observed on
the model representation was determined based on six distinct discretisations (Table 4) of the Concordia River basin. In these, the land use importance, soil type and slope varied, as well as the number of sub-basins. The mean area value for sub-basin determination indicates the number of HRUs the model can
Table 4. Summary of HRUs discretizations. HRUs
discretization Area (ha) Sub-basins HRU Use (%) Soil (%) Declivity (%)
Land use, soil and slope
1590 15 127 1590 5 90 5 No
780 15 127 780 15 70 15 No
387 15 127 387 70 15 15 No
127 15 127 127 - - - Yes
64 60 21 64 65 15 20 No
21 60 21 21 - - - Yes
Table 2. SWAT parameters used for calibration.
Parameter Description Interval v_ALPHA_BF Base flow recession coefficient 0 - 1 v_GW_DELAY Time interval for aquifer recharge 0 - 500 v_GWQMN Water limit for base flow occurrence 0 - 5,000 v_OV_N Manning number for terrestrial flow 0.01 - 30 v_EPCO Water absorption coefficient by plants 0 - 1 v_ESCO Soil evaporation compensation
coefficient 0 - 1
v_SURLAG Surface runoff delay coefficient 1 - 24 v_CH_K1 Surface runoff loss transmission
coefficient 0 - 300
v_CH_N1 Manning Number for tributaries watercourses
0.01 - 30
v_GW_REVAP Saturated zone water rise coefficient 0.02 - 0.2
Table 3. Parameters used for the model calibration in the sub-basins. Parameter Description Interval v_ALPHA_BF Base flow recession coefficient 0 - 1 v_GW_DELAY Time interval for aquifer recharge 0 - 500 v_GWQMN Water limit for base flow occurrence 0 - 5000 v_OV_N Manning number for terrestrial flow 0.01 - 30 v_EPCO Water absorption coefficient by plants 0 - 1 v_ESCO Soil evaporation compensation
coefficient 0 - 1
v_SURLAG Superficial runoff delay coefficient 1 - 24 v_CH_K1 Surface runoff loss transmission
coefficient 0 - 300
v_CH_N1 Manning Number for tributaries watercourses
0.01 - 30 Table 1. Summary of physical characteristics in the fluviometric sections.
Fluviometric Station
Area Perimeter
kC KF
km2 Km
generate. It was decided to assign an average area with 15 ha initially, producing 127 sub-basins. In order to achieve greater variation in spatial discretisation, it was necessary to increase the average area to 60 ha, reducing the total sub-basins to 21.
The parameters were modified over the prefix ‘v’ (substitute)
within the values range represented in Table 2. The same pattern for each scenario was considered.
At the end of calibration and validation the NS and Pbias coefficients, the processing time and the P-values of each scenario
were compared to verify patterns in the model response variations.
Parameters spatial distribution
The model parameters’ spatial distribution was performed by comparing the parameter values of each Itajai River basin
fluviometric station with the station’s physical indexes. In this way,
the model for each section displayed in Table 1 was calibrated and validated. The indices surveyed were: the area, the perimeter, the
compactness coefficient (kC) and the form factor (kF).
The kC associates the basin shape with that of a circle through the relationship between the basin perimeter and the circle perimeter of the same basin area. The calculated value tends to the unity while the basin shape approximates that of a circle (TONELLO et al., 2006). Equation 1 was used to calculate kC:
. P
kC 0 28 x A
= (1)
where: P is the perimeter in km; A is the area in km2.
The kF is the mean width ratio to the basin axis length (from the mouth to the furthest point in the area), comparing the basin aspect with a rectangle (TONELLO et al., 2006). The kF was calculated according to equation 2:
²
A
kF C
= (2)
where: A is the basin area in km2; C is the length in KM from the mouth to the furthest point in the area.
The area and perimeter were determined using ArcGIS software (version 10.1, Esri), based on the hydrology maps and
hydrographic units available on the Digital Maps platform in the
state of Santa Catarina with a 1:50,000 scale.
The Itajai River basin was calibrated at each fluviometric
station, following the order upstream to downstream. To perform
this calibration the HRUs corresponding to the fluviometric
station in question were selected and the SWAT model parameters
modified, generating improvements of the Nash and Pbias performance coefficients.
After calibrating and validating the model, Statistca (version 10, StatSoft) software was used to correlate the physical indices with the weighted parameters for each basin, using the Pearson
correlation coefficient. Regression equations were also generated
for each parameter.
The Pearson correlation coefficient is a statistic that
represents the variation index between two factors. In stronger
correlations, the coefficient will tend to values closer to ± 1.
Positive values indicate a direct correlation and negative values
the inverse correlation (MUKAKA, 2012). The value considered acceptable was proposed by Mukaka (2012), which indicates the
moderate correlation should be ≥ │0.5│.
Finally, to apply the regression equations and determine the mean deviation between the simulations, 22 sub-basins with a drainage area ranging from 9 to 110 km2 were randomly selected.
The deviation was estimated considering the simulated flows series
with the calibrated parameters for the Itajai River basin and the parameters in the small basin area, estimated according to their
physical characteristics. It was decided to verify the average flow and the flow with 95% occurrence frequency (Q95), as these are
important indicators for water resources management.
RESULTS AND DISCUSSION
The Concordia River basin calibration and validation resulted in the hydrographs shown in Figure 3. These were compared to
six different HRU discretisations of flow values observed in the
basin. The different discretisations showed similar behaviour over time and that the increase in the number of HRU caused a slight
variation in water flow. However, as found by Her et al. (2015), the HRUs discretisation process has a strong effect on the ground, land use and soil composition, so that the HRUs’ low number compromises sediment production and water quality.
The NS coefficient showed reduced variation with the
increase in the number of HRUs, demonstrating that the number of sub-basins is more relevant than the HRUs’ discretisation. This result corroborates the hypothesis of Bueno et al. (2017), who found the number of sub-basins tended to cause greater
sensitivity in the NS coefficient.
The coefficient Pbias improved according to the increase
in the number of HRUs. The more the sub-basin is discretized the better the model represents water storage. However, processing time is a limiting factor in the model calibration, which tends to
increase significantly with the number of HRUs, as shown in Table 5. The P-value for each parameter tests the null hypothesis
that the coefficient is equal to zero. In this research, the P-value
must be less than 0.05 to reject the null hypothesis. An indicator
with a low P-value is likely to be a significant addition to the model,
because changes in the indicator value are related to changes in the response variable (ABBASPOUR, 2015).
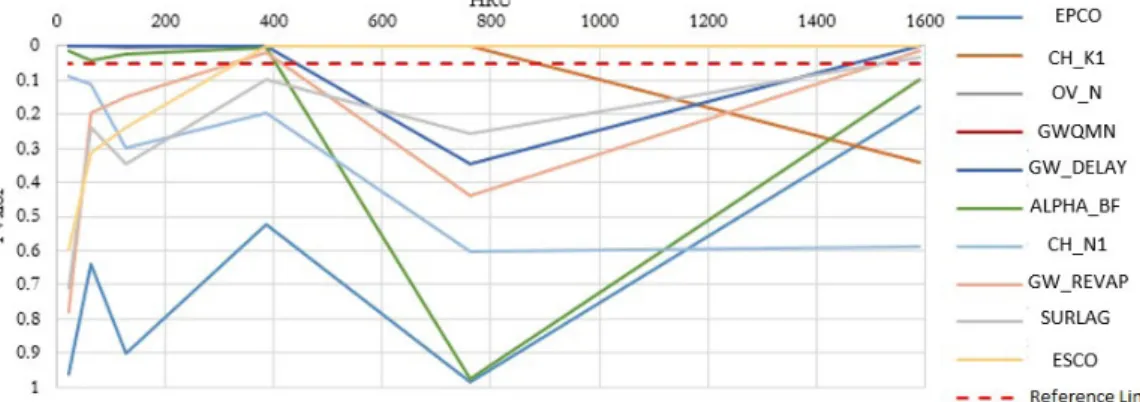
In this context, when the number of HRUs is less than
400, the parameters influenced are Alpha_bf, Gw_Delay, Gwqmn,
Ch_k1 and Ov_n (Figure 4). As for the discretisations that have a
greater number of HRUs, the parameters Gw_Delay, Gwqmn and Ov_N continued to be representative. The parameters Esco, Surlag
and Gw_Revap gain importance in the calibration. This shows that by increasing the number of HRUs the model better represents
the base flow, requiring coefficients to compensate the flow in a
saturated state and during soil evaporation.
Therefore, when the objective is to represent the flow peaks
in the basins, the HRUs’ discretisation does not become a limiting
factor. However, if the objective is to verify the base flow in the
small basin simulation, the number of HRUs is fundamental for better representation of the hydrological processes.
Hydrographs of the fluviometric sections examined for
Figure 3. Calibration hydrograms (2010 to 2013) and validation (2014 to 2016) of the different HRUs discretizations.
Figure 4. P-value result obtained by calibration of HRUs in Swat-Cup.
Table 5. NS, Pbias (%) and processing time for discrete HRUs.
HRUs Calibration Validation Processing time
(h)
NS Pbias NS Pbias
1590 0.65 -10 0.52 -17.8 24:15:30
780 0.68 -12.5 0.58 -22.5 12:30:25
387 0.64 -16.1 0.57 -16.5 9:53:28
127 0.65 -16.1 0.53 -17.2 6:29:29
64 0.61 -16.3 0.56 -17.4 1:48:54
the accuracy of the SWAT model in representing the parameters’ spatial distribution. The hydrographs presented reduced variation
in the maximum flow peaks.
The NS and Pbias coefficient values calculated for the SWAT
model calibration and validation in the sub-basins’ discretisation stage are presented in Table 6. The results show there are differences in the model parameters’ spatial representation, which can be
observed in the coefficient variation.
NS could be related to the precipitation spatial distribution
that occurred in the basin, indicating that even when the model
is fed by several rainfall stations it has difficulty reproducing high flow in some fluviometric stations, corroborating Pereira et al. (2014) and Zhang, Xu and Fu (2014), who obtained similar results.
The Pbias variation could be related to the soil discretisation, which causes low water storage. Consequently, the model estimates a
smaller flow than is observed. This effect becomes more significant
when verifying the validation. According to Pfannerstill, Guse and Fohrer (2014), the SWAT model tends to generate more
uncertainties in low flow periods. However, the coefficients
presented satisfactory values, demonstrating the model’s ability
to simulate flow in the hydrographic basin.
The correlation among the parameters and physical indexes was obtained only with kC (Figure 6). This was the only factor that presented correlation values above 0.5, evidence of a moderate correlation.
The parameters Surlag and Ch_K1 had the highest
correlation values. The Surlag parameter is a delay coefficient
Figure 6. Parameters correlation with the coefficient kC. Table 6. NS and Pbias results spatial distribution.
Fluviometric Station
Calibration (2010 - 2012)
Validation (2013 - 2016)
NS Pbias (%) NS Pbias (%)
Blumenau 0.74 23 0.71 25
Indaial 0.81 13 0.74 25
Apiuna 0.54 23 0.58 25
Rio do Sul 0.65 19 0.61 25
Ibirama 0.52 24 0.71 25
Ituporanga 0.60 22 0.5 23
Timbo 0.50 16 0.64 25
Taio 0.55 17 0.5 24
Brusque 0.66 20 0.67 18
Benedito 0.51 22 0.52 25
Salseiro 0.50 17 0.57 18
2009). The basins that most resemble a circle have smaller values for the parameter Surlag, as found in the correlation with the kC.
The parameters Ch_k1, Gw_delay and Alpha_bf have a correlation inversely proportional to kC. Therefore, the more the basin shape resembles a circle, the greater the parameter values. The function of parameter Ch_k1 is to control surface transmission
losses as it flows into the main channel (ARNOLD et al., 2012).
Thus, in circular basins the water loss increases due to the flow
tending to accumulate in the exudate (OLIVEIRA et al., 2007). The parameter gw_delay has the function of delaying groundwater
flow, stipulating the percolation time. It mainly depends upon the
water table depth and hydraulic properties. The parameter Alpha_bf is a recession constant, which indicates the response of the
groundwater flow to changes in recharge (ARNOLD et al., 2012). These two parameters are correlated because elongated basins have a longer drainage time, requiring smaller values for compensation.
The parameters Ov_n and Ch_N1 are the flow roughness coefficients (Manning coefficient) and can be defined as the friction the water suffers during the flow (MATOS et al., 2011). Comparing them with the kC, a direct relationship is observed, which could be caused by the decrease in concentration time in circular basins,
resulting in the Manning coefficient decrease (SILVEIRA, 2005). The parameter Esco is a compensation factor for soil evaporation. The model is able to draw more water from the lower levels due to the reduced value of this parameter (ARNOLD et al., 2012). This justifies the direct relationship between the ESCO parameter and kC, as circular basins tend to have a shorter concentration time, generating less water storage.
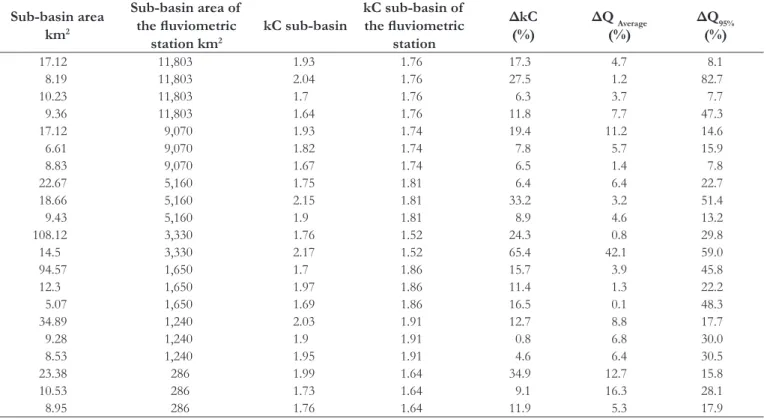
The application of regression equations developed from
the comparison between calibration parameters and coefficient kC
was carried out in 22 sub-basins (Table 7) to determine variations
caused by parameters in the water flow in small basins. In choosing
the sub-basins, the drainage area did not exceed 110 km2 and were
contained in most fluviometric stations’ sub-basins used in the
model calibration (Figure 1). The coefficient kC of each sub-basin
was also compared with the coefficient kC of the corresponding fluviometric station sub-basin.
The variations in the estimated average flows comprised between 0.8 and 42.1%. Therefore, depending on how the sub-basin calibration occurred, mean flow values can be underestimated or overestimated by up to 42.1%.
The difference between the simulated Q95 initially and after applying the regression equations ranged from 7.7 to 82.7%.
This indicates the parameters related to basin shape have a great
influence on the minimum simulated flow. Therefore, it is necessary
to compensate these values in order to manage water resources in the sub-basins.
The results corroborated the study by Spruill, Workman and Taraba (2000). They found the most influential flow calibration parameters in small basins were related to hydraulic conductivity,
channel base flow, drainage area, channel length and width. Thus, the uncertainty in the small-scale water flow representation is mainly associated with basin shape, and the coefficient kC can
be used to decrease the variable uncertainty. Circular basins tend
to have faster response time than elongated basins, so water flow
varies greatly when the calibrated basin shape differs from that analysed sub-basin.
In order to emphasize the results, the mean flow variation and the Q95 with parameters was used in the model calibration. The drainage area and the coefficient kC (Table 8) were compared
using the Pearson coefficient. The Pearson coefficient must have
Table 7. Difference between flow simulations in sub-basins from 2010 to 2016.
Sub-basin area km2
Sub-basin area of
the fluviometric
station km2
kC sub-basin
kC sub-basin of
the fluviometric
station
ΔkC
(%)
ΔQ Average
(%)
ΔQ95%
(%)
17.12 11,803 1.93 1.76 17.3 4.7 8.1
8.19 11,803 2.04 1.76 27.5 1.2 82.7
10.23 11,803 1.7 1.76 6.3 3.7 7.7
9.36 11,803 1.64 1.76 11.8 7.7 47.3
17.12 9,070 1.93 1.74 19.4 11.2 14.6
6.61 9,070 1.82 1.74 7.8 5.7 15.9
8.83 9,070 1.67 1.74 6.5 1.4 7.8
22.67 5,160 1.75 1.81 6.4 6.4 22.7
18.66 5,160 2.15 1.81 33.2 3.2 51.4
9.43 5,160 1.9 1.81 8.9 4.6 13.2
108.12 3,330 1.76 1.52 24.3 0.8 29.8
14.5 3,330 2.17 1.52 65.4 42.1 59.0
94.57 1,650 1.7 1.86 15.7 3.9 45.8
12.3 1,650 1.97 1.86 11.4 1.3 22.2
5.07 1,650 1.69 1.86 16.5 0.1 48.3
34.89 1,240 2.03 1.91 12.7 8.8 17.7
9.28 1,240 1.9 1.91 0.8 6.8 30.0
8.53 1,240 1.95 1.91 4.6 6.4 30.5
23.38 286 1.99 1.64 34.9 12.7 15.8
10.53 286 1.73 1.64 9.1 16.3 28.1
values equal to or greater than 0.5. Thus, there is a correlation between the parameters compared.
The variations between Q95 and the Surlag, Alpha_Bf and kC coefficients are correlated, indicating the changes in
recharge and the daily surface runoff discharged into the main
channel are influential factors in flows with 95% occurrence frequency. It also correlated the average flow variations with the coefficients Ch_k1 and kC, demonstrating the importance of surface transmission losses in the average flow determination.
Another point of uncertainty is the study area discretisation. When it represents small basins, one must detail the soil structure, the land use as well as the land slope. In this way, the model can
better simulate the water flow, sediments and nutrients. Jha et al. (2004) also presented this finding. They noted the sub-basin division depends on the expected model response. In this case, to control the uncertainties, it is necessary to plan basin division and discretisation based on the expected hydrological simulation responses.
CONCLUSION
The HRUs discretisation has shown there is no need to discriminate the sub-basins when the goal is to represent the
flow peaks in a small basin. However, if the objective is to verify the base flows, the number of HRUs is fundamental to a good
hydrological processes representation.
According to the results obtained by applying the regression equations drawn between the comparison of the calibration
parameters and the coefficient kC, it was determined the basin shape coefficient can generate up to 42.1% of variation in mean flow and 82.7% in Q95 of the sub-basins.
Thus, the regression equations used can help reduce uncertainties generated during parameter calibration. When using the model as a tool for water resources management, it is necessary to represent the hydrological processes’ spatial variabilities of all the sub-basins involved in the study area.
REFERENCES
ABBASPOUR, K. C. User manual for SWAT-CUP, SWAT calibration and uncertainty analysis programs. Switzerland: Swiss Federal Institute of Aquatic Science and Technology, 2015.
ABBASPOUR, K. C.; ROUHOLAHNEJAD, E.; VAGHEFI, S.;
SRINIVASAN, R.; YANG, H.; KLOVE, B. A continental-scale
hydrology and water quality model for Europe: Calibration and uncertainty of a high-resolution large-scale SWAT model. Journal
of Hydrology (Amsterdam), v. 524, p. 733-752, 2015. http://dx.doi. org/10.1016/j.jhydrol.2015.03.027.
ADAM, K. N.; FAN, F. M.; PONTES, P. R.; BRAVO, J. M.;
COLLISCHONN, W. Mudanças climáticas e vazões extremas
na Bacia do Rio Paraná. Revista Brasileira de Recursos Hídricos, v. 20, n. 4, p. 999-1007, 2015. http://dx.doi.org/10.21168/rbrh. v20n4.p999-1007.
ANA – AGÊNCIA NACIONAL DE ÁGUAS. Orientações para
consistência de dados fluviométricos. Brasília: ANA, 2012a. 19 p.
ANA – AGÊNCIA NACIONAL DE ÁGUAS. Diretrizes e análises
recomendadas para a consistência de dados pluviométricos. Brasília: ANA,
2012b. 18 p.
ANDRADE, M. A.; MELLO, C. R.; BESKOW, S. Simulação
hidrológica em uma bacia hidrográfica representativa dos Latossolos na região Alto Rio Grande, MG. Revista Brasileira de Engenharia Agricola e Ambiental-Agriambi, v. 17, n. 1, 2013.
ARAGÃO, R.; CRUZ, M. A. S.; AMORIM, J. R. A.; MENDONÇA, L. C.; FIGUEIRA, E. E.; SRINIVASAN, V. S. Análise de sensibilidade dos parâmetros do modelo SWAT e simulação dos processos hidrossedimentológicos em uma bacia do agreste nordestino. Revista Brasileira de Ciência do Solo, v. 37, n. 4, p. 1091-1102, 2013. http://dx.doi.org/10.1590/S0100-06832013000400026.
ARAÚJO, I. M. M.; NASCIMENTO, M. M. B.; OLIVEIRA, A. G. R. C. Recursos hídricos e saúde humana: impactos industriais e estratégias de manejo e proteção ambiental no município de Goiana/PE. INTERthesis: Revista Internacional Interdisciplinar, v. 13, n. 3, p. 163-181, 2016. http://dx.doi.org/10.5007/1807-1384.2016v13n3p163.
ARNOLD, J. G.; KINIRY, J. R.; SRINIVASAN, R.; WILLIAMS,
J. R.; HANEY, E. B.; NEITSCH, S. L. Soil & Water Assessment Tool. Texas: Texas Water Resources Institute, 2012.
BRESSIANI, D. A.; GASSMAN, P. W.; FERNANDES, J. G.;
GARBOSSA, L. H. P.; SRINIVASAN, R.; BONUMÁ, N. B.;
MENDIONDO, E. M. Review of soil and water assessment
tool (SWAT) applications in Brazil: Challenges and prospects. International Journal of Agricultural and Biological Engineering, v. 8, n. 3, p. 9-35, 2015.
BUENO, E. O.; OLIVEIRA, V. A.; VIOLA, M. R.; MELLO,
C. R. Desempenho do modelo swat para diferentes critérios de
Table 8. Comparison of the Pearson coefficient variation.
Parâmetros
Area kC ESCO EPCO SURLAG GW_DELAY CH_N1 OV_N GWQMIN ALPHA_BF CH_K1
ΔQ Average 0.32 0.44 0.45 0.3 0.37 -0.02 0.35 0.15 0.62 -0.18 0.68
geração de unidades de resposta hidrológica. Scientia Agraria, v. 18, n. 2, 2017.
CARR, G.; BLÖSCHL, G.; LOUCKS, D. P. Evaluating participation in water resource management: A review. Water Resources Research, v. 48, n. 11, p. 1-11, 2012.
CARVALHO, J.; CURI, W. F. Sistema de indicadores para a gestão de recursos hídricos em municípios: uma abordagem através dos métodos multicritério e multidecisor. Revista Brasileira de Gestão e Desenvolvimento Regional, v. 12, n. 2, 2016.
DANIEL, E. B.; CAMP, J. V.; LEBOEUF, E. J.; PENROD, J. R.;
DOBBINS, J. P.; ABKOWITZ, M. D. Watershed Modeling and
its Applications: A State-of-the-Art Review. The Open Hydrology Journal, v. 5, p. 26-50, 2011.
FRANCESCONI, W.; SRINIVASAN, R.; PÉREZ-MIÑANA,
E.; WILLCOCK, S. P.; QUINTERO, M. Using the Soil and Water Assessment Tool (SWAT) to model ecosystem services: A systematic review. Journal of Hydrology, v. 535, p. 625-636, 2016.
GEOAMBIENTE SENSORIAMENTO REMOTO LTDA.
Projeto de Proteção da Mata Atlântica em Santa Catarina (PPMA/ SC). Relatório Técnico do Mapeamento Temático Geral do Estado de Santa Catarina. São José dos Campos: Geoambiente, 2008. 90 p.
HER, Y.; FRANKENBERGER, J.; CHAUBEY, I.; SRINIVASAN, R. Threshold effects in HRU definition ofthe soil and water assessment tool. Transactions of the ASABE, v. 58, n. 2, p. 367-378, 2015.
JHA, M.; GASSMAN, P. W.; SECCHI, S.; GU, R.; ARNOLD, J. Effect of watershed subdivision on SWAT flow, sediment, and nutrient predictions. JAWRA Journal of the American Water Resources Association, v. 40, n. 3, p. 811-825. 2004.
LOEWEN, A. R.; PINHEIRO, A. Overland flow generation
mechanisms in the Concórdia River basin, in southern Brazil. RBRH: revista brasileira de recursos hídricos, v. 22, n. 1, 2017.
MATOS, A. J. S.; PIOLTINE, A.; MAUAD, F. F.; BARBOSA, A. A. Metodologia para a caracterização do coeficiente de Manning variando na seção transversal e ao longo do canal estudo de caso bacia do Alto Sapucaí-MG. RBRH: Revista Brasileira de Recursos Hídricos, v. 16, n. 4, p. 21-28, 2011. http://dx.doi.org/10.21168/ rbrh.v16n4.p21-28.
MOLINA-NAVARRO, E.; TROLLE, D.; MARTÍNEZ-PÉREZ,
S.; SASTRE-MERLÍN, A.; JEPPESEN, E. Hydrological and water quality impact assessment of a Mediterranean limno-reservoir under climate change and land use management scenarios. Journal of Hydrology, v. 509, p. 354-366, 2014.
MORIASI, D. N.; ARNOLD, J. G.; VAN LIEW, M. W.; BINGNER, R. L.; HARMEL, R. D.; VEITH, T. L. Model evaluation guidelines for systematic quantification of accuracy in watershed simulations. Transactions of the ASABE, v. 50, n. 3, p. 885-900, 2007.
MUKAKA, M. M. A guide to appropriate use of correlation coefficient in medical research. Malawi Medical Journal, v. 24, n. 3, p. 69-71, 2012.
NEITSCH, S. L.; ARNOLD, J. G.; KINIRY, J. R.; WILLIAMS, J. R. Overview of Soil and Water Assessment Tool (SWAT) Model, Ankeny: World Association of Soil and Water Conservation, 2009. v. 8, n. 3. Tier B (All countries/territories not listed here are in Tier A).
OLIVEIRA, S. N.; CARVALHO JÚNIOR, O. A.; SILVA, T. M.; GOMES, R. A. T.; MARTINS, É. S., GUIMARÃES, R. F.; SILVA, N. C. Delimitação automática de bacias de drenagens e análise multivariada de atributos morfométricos usando modelo digital de elevação hidrologicamente corrigido. Revista Brasileira de Geomorfologia, v. 8, n. 1, 2007.
PEREIRA, D. D. R.; MARTINEZ, M. A.; ALMEIDA, A. Q.
D.; PRUSKI, F. F.; SILVA, D. D.; ZONTA, J. H. Hydrological simulation using SWAT model in headwater basin in Southeast Brazil. Engenharia Agrícola, v. 34, n. 4, p. 789-799, 2014.
PEREIRA, D. D. R.; MARTINEZ, M. A.; SILVA, D. D.; PRUSKI, F. F. Hydrological simulation in a basin of typical tropical climate and soil using the SWAT model part II: Simulation of hydrological variables and soil use scenarios. Journal of Hydrology: Regional Studies, v. 5, p. 149-163, 2016.
PFANNERSTILL, M.; GUSE, B.; FOHRER, N. A multi‐storage
groundwater concept for the SWAT model to emphasize nonlinear groundwater dynamics in lowland catchments. Hydrological Processes, v. 28, n. 22, p. 5599-5612, 2014. http://dx.doi.org/10.1002/ hyp.10062.
SANTA CATARINA. CIRAM – CENTRO DE INFORMAÇÕES DE RECURSOS AMBIENTAIS E DE HIDROMETEOROLOGIA DE SANTA CATARINA. EPAGRI – EMPRESA DE PESQUISA AGROPECUÁRIA E EXTENSÃO RURAL DE SANTA CATARINA. Mapas digitais de Santa Catarina. 2007. Disponível
em: <http://ciram.epagri.sc.gov.br/mapoteca/>. Acesso em: 05 jun. 2017.
SANTOS, R. M. B.; FERNANDES, L. S.; MOURA, J. P.; PEREIRA, M. G.; PACHECO, F. A. L. The impact of climate change, human interference, scale and modeling uncertainties on the estimation of aquifer properties and river flow components. Journal of hydrology, v. 519, p. 1297-1314, 2014.
SILVEIRA, A. L. L. Desempenho de formulas de tempo de concentração em bacias urbanas e rurais. RBRH: Revista Brasileira de Recursos Hídricos, v. 10, n. 1, p. 5-23, 2005.
SPRUILL, C. A.; WORKMAN, S. R.; TARABA, J. L. Simulation of daily and monthly stream discharge from small watersheds using the SWAT model. Transactions of the ASAE, v. 43, n. 6, p. 1431-1439, 2000. http://dx.doi.org/10.13031/2013.3041.
TONELLO, K. C.; DIAS, H. C. T.; SOUZA, A. L.; RIBEIRO,
Cachoeira das Pombas, Guanhães – MG. Revista Árvore, v.30, n. 5, p.849-857, 2006.
WHITE, K. L.; CHAUBEY, I. Influence of hydrologic response unit (HRU) distribution on SWAT model flow and sediment predictions.
In: WATERSHED MANAGEMENT TO MEET WATER QUALITY STANDARDS AND EMERGING TMDL, 2005,
Atlanta. Proceedings… Georgia: American Society of Agricultural and Biological Engineers, 2005. p. 283. Available in: <https://elibrary. asabe.org/abstract.asp?aid=18081>. Accessed on: 16 out. 2017.
ZHANG, X.; XU, Y.; FU, G. Uncertainties in SWAT extreme flow simulation under climate change. Journal of Hydrology, v. 515, p. 205-222, 2014. http://dx.doi.org/10.1016/j.jhydrol.2014.04.064.
Authors contributions
Pedro Thiago Venzon: Contributed with the elaboration of the study central idea. Carried out the hydrological simulations, analysis and discussion of the results, preparation of the
manuscript including writing, drawing of figures and tables and
bibliographic review.
Adilson Pinheiro: Advisor. Contributed with the elaboration of the study central idea, hydrological simulations, analysis of the results and writing of the article.