Discover Implicit Relationships Between Researchers Using Email
Tracking
CAPSI’2011
Tiago Ferreira1, Alberto Silva2, Peter Bradley3a, Khilwani Nitesh3b, Madhur Agrawal3c 1) Instituto Superior Técnico, Lisbon, Portugal
2) IST/INESC-ID, Lisbon, Portugal [email protected]
3) Nano-Tera, Lausanne, Switzerland
a) [email protected], b) [email protected], c) [email protected]
Abstract
The study addresses the issue of discovering implicit relationships between individuals in a community using newsletters. It starts by discussing the technologies brought by Web 2.0 and focuses on interaction as the core to achieve reliable results. Then, it describes the proposed solution and its architecture and discusses the concept of communities and its relation with implicit and explicit connections. Finally, the paper discusses Nano-Tera.ch case study where the solution was developed and evaluated in a sample of one thousand of individuals, as well as the statistical results and conclusions.
Keywords: Web 2.0, Implicit Relationships, Email Tracking, Communities
1. Introduction
Web 2.0 brought a new generation of web-based communities represented by its innovation in terms of user interaction and information sharing [14]. The advent of web technology introduced new technology enablers such as online social networks (e.g. LinkedIn), social computing developments tools (e.g. wikis), documents sharing systems (e.g. email), and other collaborative environments (e.g. teleconferencing) that changed the way people interact and share knowledge [13]. Unsurprisingly, conventional interactions were encouraged to move to non-conventional and web-based interactions in order to improve information sharing and to achieve an effective communication without geographical limitations. However, both approaches, conventional and non-conventional communication, are the basis for the growth of social networks.
Characterized as being made of interactions or relationships, where nodes represent individuals and edges the relationships or interactions between them, social networks are a major source of communication between individuals [1][8][14]. This includes conventional communication in its face-to-face interactions, where people are physically linked and need personal contact to share information and non-conventional in a way that goes beyond the geographical barriers and connects people virtually. These connections can be defined as directed links (e.g. common activities) or undirected links (i.e. something unspecified), and described as explicit and implicit relations respectively. In any case, the connections establish new relationships and bring new ways of promote contact.
The business world and the education sphere are examples where web technology is helping their development and transforming how companies do business and the way students interact. The scientific world is not an exception. The interactions between researchers have been overcoming the physical limitations of conventional social networks and exploring the power of the new social technologies [18]. Their exploitation is a valuable asset to expand contacts, share knowledge and promote successful relationships among potential research partners. However, the problem comes when the ability to manage the data that arise from environments of interaction becomes more difficult to keep up in pace. When the number of individuals in a community reaches thousands, data management becomes more difficult to handle and therefore harder to discover implicit relationships. As a consequence, “the connections between individuals, groups and information become lost, or forgotten, and individuals and groups become ever more isolated” [16]. This could lead to non-collaboration and poor knowledge sharing due to the non-exploitation of hidden relationships between individuals, and between individuals and information.
For these reasons, it was developed the Email Management System. The goal was to discover non-visible connections among researchers in order to identify communities that share common interests or topics of study. These implicit relationships between researchers help to understand the structure of a scientific community and to formalize shared patterns. Unlike explicit networks, implicit networks are able to capture information beyond that which is given by researchers and help to better define their interactions [21]. In this research, implicit relations are described as those who derived from researchers’ actions and behavior with the content. In particular, with a set of HTML files (i.e. newsletters) that were designed and sent to researchers to capture their interactions with the content, i.e. their clicks. Moreover, Email Management System uses HTML language to design the newsletters, PHP scripting to capture the interactions and to discover hidden relationships, JpGraph graphic library to visualize the results, and electronic mail technology to spread the newsletters among the researchers.
The paper is structured in five sections where it presents the proposed solution by describing its main features and the research on which it is based followed by the evaluation that was made with the Nano-Tera.ch project and its statistical results, and the discussion about the results and some of the privacy issues. It ends with a reference to the related work and exposing the conclusions.
2. Solution
Online collaborative work is reaching large scales allowing people to work together even knowing that they are geographically apart from each other. Moreover, online collaborative environmental could be anything that enables people to collaborate without the need to meet face-to-face. Collaboration technologies, such as messaging, web portals, and electronic mail are extremely powerful tools to allow individuals to collaborate between them.
2.1. High-Level Architecture
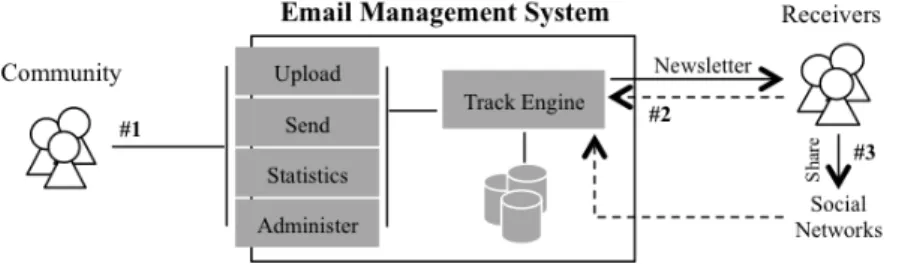
The proposed solution, named as EMS (Email Management System), uses email technology and PHP scripting to send and collect information about researchers. The most important functionalities are an extension of its main features of “Upload”, “Send”, “Administer”, and “Statistics” about each newsletter (Figure 1 [#1]). The “Track Engine” is responsible for tracking the information that arrives into the system in order to capture implicit relations and present statistical results. A community can upload information as a newsletter, send it to a set of contacts (scientific or not) and to its own community, see the statistics on the results (i.e. the data collected), and manage the information attached to each newsletter. On the other side, receivers have access to the newsletters through their email addresses and can share them on online social networks [#3]. The system is able to capture the interactions that come from both receivers and social networks [#2].
2.1.1. Upload
To spread information across scientific communities the EMS proposes the design and upload of an HTML newsletter into the system. Scientific communities gather information on their projects or topic of research and create an HTML newsletter to spread it out. A pre-format HTML document saves required user knowledge and time consuming editing workload. The “Tracking” focus is on the links at the HTML newsletter. On this stage, after uploading the newsletter, the system will track every link in order to capture any action (i.e. click) on it. The links are stored and identified according to their type. They can be typed as “text” every time the link is associated to any text format or “image” when it is linked to a visual representation. Thereby, when the information is represented in both ways — “text” and “image” — the action allows scientific community to study the interactions according to the links’ type, i.e. if receivers interact more with information as “text” or “image”. In the end, a last step regarding the newsletter’s upload is taken into account. In order to allow the system to organize the data and to discover implicit connections between receivers each link (in the newsletter) has to be categorized. As default, all links are categorized as “None” and no implicit connections are identified. Once the user (i.e. the scientific community) creates the categories and associates them with the links, the system is able to bring to light hidden relationships and shared patterns.
2.1.2. Send
The action of sending a newsletter is what initializes the process of analysis and therefore the statistical results. The user begins by setting the email subject and uploading the mailing list(s) of contacts that will receive the newsletters. Once the user’s input is completed, the system is able to send the newsletter by first customizing it according to each receiver’s personal information (names and email). It is called receiver to any researcher to which the newsletter is sent. The customization is done at the design level, where the newsletter’s header is personalized with the receiver’s names and at a lower level by modifying the HTML on the links. That is, before sending the newsletter to a specific receiver, the links are generated in order to track his actions. This process of links generation is done for every contact at the mailing list by following an URL standard:
Base-url/code/user-id/link-id/newsletter-id
Where the “base-url” is the common prefix to each URL, e.g. http://www.yoursite.com/. The “code” identifies the process to be applied to the information that follows. There are five defined processes to track different information: the action of opening the email with the newsletter, the action of clicking, the option to share or see online the newsletter, and to identify
to which social network a receiver share with. The “user-id” recognizes the user, i.e. the receiver that did the action and the “link-id” the link in which the receiver made the click. However, this information (“link-id”) is only used when the code describes an interpretation as a link. The last part is used to recognize the newsletter in which the action was made. In the end, the data collected is stored by the system according to the identified process. The information is then used for statistical purposes and to discover implicit connections among receivers (i.e. researchers).
2.1.3. Statistics and Data Analysis
The main feature about the proposed solution is its statistical functionality. The data on researchers’ interactions is stored and the statistical option allows scientific communities to take conclusions and understand the impact that a particularly newsletter had. The statistics are presented for each newsletter individually and displayed using the JpGraph library.
A. General Info
Once the process of sending is completed, the global information about the newsletter sent is automatically added to the “Statistics” option. This section answers some practical questions that arise when it comes to make an evaluation of the data. General information, such as name, data of upload, and links’ categories are part of the displayed data. Still, it presents the total number of clicks, the total number of individuals that clicked, the total number of individuals that opened the email with the newsletter, and the total number of contacts to which the newsletter was sent. This data allows scientific communities to understand the interest of their contacts on the newsletter and therefore the newsletter impact. Finally it presents the date on which the newsletters were sent and consequently the time that has passed since then.
B. Links Analysis
The statistical tool is designed to better explore the results on the researchers’ clicks. In this particular case a click is the action of clicking a link inside a newsletter. Every time this action happens the system stores it and then gather all the data to display it through statistical results. The visuals on the interactions about the links are some of the ways used to present the results. The following exposes the description options with data through percentage or the total number of clicks in order to present the data clearly with ease for analysis.
a) Types by Percentage
The presentation of the data in a newsletter can be identified as “text” or “image”. In the case of the links, they can be linking a piece of “text” or an “image” with an URL address. The action of clicking in any of these types is stored as it came from different sources, text or image. The goal is to understand with which type receivers interact more, i.e. if a particular community is more text or image focus. This information can be useful to design newsletters in order to encourage receivers to interact more. The more interactions a receiver does, the more consistent his implicit connections will be. In fact, the system is designed to study in what way the newsletters can be used to achieve a better quality and dissemination results.
The action of “See Online” and “Share” are also presented on these statistics. “See Online” is defined when receivers click the link of see the newsletter in the Brower. “Share” is about he willingness to share the newsletters with online communities. It could be an online social network, or through email. The option allow receivers to click a link with the purpose of sharing the newsletter but, once the action is pressed, the receivers are forwarded to a web page in which they choose what online social network they would like to share with. However, the “Share” actions presented on these results are the initial clicks, i.e. before being redirected to choose the particular social network. Both options, “See Online” and “Share”, are links presented inside the newsletter that each receiver gets on their email address.
b) Categories by Percentage
The ability to perceive to which subjects the researchers are more committed is achieved by categorizing the links at the newsletters. Scientific communities should categorize each link by creating connections with categories. The better the links are categorized, the easier will be to understand to which categories researchers interact more. In the end, categories are presented as a percentage according to the number of clicks that they receive and used to identify groups through researchers’ implicit relationships. When looking at the details the system shows which receivers are related with a specific category as well as the connection degree. The higher the number of clicks, the stronger the connection degree is.
c) Clicks per Link, Time, and Geography
The results are based on the interactions between researchers and newsletters. Every time a researcher clicks a link it is stored as an action and used as part of the results. The visualization of the results is complemented with graphics on the total number of clicks per link, time, and geographically. The first visual is based on the total number of clicks that each link received,
showing the links that had received more interactions and therefore which topics or categories researchers were more interested in.
The option about expose the results as a ration between the total number of clicks and time, show the interactions evolution according to the time. The visual begins on the date that the newsletter was sent and ends on the date of the last click. The goal is to understand the evolution in the receivers’ interest about the newsletters. It also helps scientific communities to realize which dates (and time) are more suitable to send a newsletter in order to achieve the best impact and therefore more interactions.
The geographical location of the clicks is also important particularly when a scientific community is spread around the world or it shares its newsletters with people across the globe. The visuals are presented by country, where each has the total number of clicks that came from there. This allows scientific communities to realize the impact and enthusiasm that a newsletter and their work can receive from other countries, even knowing that they have different cultures and (perhaps) different scientific interests.
d) Clicks per Social Network
The solution allows researchers to share newsletters within online social networks (e.g. digg and stumbleupon). It brings a new level of sharing by enabling the information to be spread across the world. Moreover, the system is designed to track the interactions that come from any source to which the newsletter was shared. When for the first time a newsletter is shared with a specific online social network a new newsletter is generated to meet that purpose, i.e. the newsletter-base is copied and modified to create a newsletter (with an unique ID) to be shared within a specific online social network. This allows the system to identify the source of the clicks. Thus, the visuals are organized in order to illustrate the online social networks associated with their total number of clicks. The goal is to understand the success in the penetration of online social networks by scientific communities and which of them are more scientific oriented.
C. Receivers Analysis
As the statistical analysis is important to explore the results about the links, also receivers are a key aspect to achieve useful conclusions about the newsletters. In addiction, receivers’ interactions are the core to discover hidden relationships between them. The follow points describe the ways that statistical information regarding receivers is presented.
a) Number of Clicks
Once the newsletters reach the receivers’ email the interactions between receivers and the newsletters are stored by the system. Thus, the total number of clicks per receiver can be identified by the sum of all of their clicks. In this case, the statistical results are presented as a podium where receivers appear in descending order, i.e. the receiver with more interactions comes in the first position and the one who had fewer interactions fills the last. This option allows scientific communities to identify which receivers (namely researchers) are more active.
b) Grouping
The purpose about categorizing the links is to identify groups where individuals are connected by a common interest. When a receiver clicks a link, his action is stored and associated with the link’s category. Thus, a receiver is connected with the links he clicked and the categories that are associated with those links. This connection between receivers and categories allows the system to discover groups and assign a degree of cohesion. A group is defined as a set of people that are related in some way and the degree of cohesion is about how strong the connections between individuals are inside a group. The higher the number of individuals’ clicks in a category, the stronger the group cohesion is.
The proposed solution associates to each category a group, i.e. if the scientific community defines health as a category it will also be a group, particularly the group’s name. The total number of clicks and the set of people (that interacted with the category) also define a group. The set is presented by a list of people’s names, email and cohesion degree, which defines how involved a researcher is with a particular subject or group.
2.1.4. Administrative Aspects
This section defines the way information is managed in the EMS. Scientific communities can update and delete information related to the newsletters and receivers’ interactions. Regarding the newsletters, communities can easily update the links’ categorization or delete all their data (from the uploaded files to all interactions). As for the receivers, communities can remove their tracked information and reduce their interactions to none. The option was introduced for privacy reasons, allowing the removal of the data from the researchers who do not feel comfortable for being tracked. However, this action will also delete some of the implicit relations between receivers and consequently change the statistics.
2.2. Interaction and Online Communities
Web 2.0 places users at the core of its success and empowers them to create and manage their own content. The key aspect of interaction at Web 2.0 offers the user the power of interact with the content and with other users. The information becomes fluid rather than static [17] and the user can shape it. This new way of interaction, where people can communicate virtually, exceeds the physical barriers and motivates online cooperation. “It’s a story about community and collaboration on a scale never seen before” [22]. Internet is now the biggest channel of knowledge with million of Wikipedia articles and YouTube video. In several ways, such as online messaging, comments, video posting, internet allows users to be interactive and content generator. On the other hand, face-to-face communication remains important to maintain successful interactions. On this book about effective communication, Chris (1999) says that “communication is carried out face-to-face with other individuals: asking for information and offering advice”. In scenarios where security is an issue, the process of sharing information is made “one-to-one situation”, especially in the scientific world [3]. An intelligent balance between face-to-face and web-based collaboration empowers researchers with a rich set of tools to gain valuable collaborations and expands contacts.
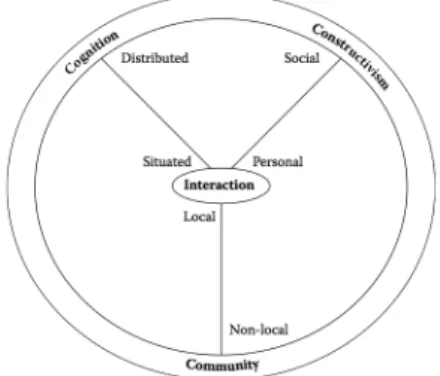
Figure 2 – “Interactionist Framework” proposed by Vrasidas and Zembylas (2004)
In 2004, Vrasidas and Zembylas developed a framework that puts interaction at the center of human activity, interrelated with three areas: social constructivism, situated and distribution cognition, and communities of practice [24] (Figure 2). Similarly, EMS places interaction as the core to discover implicit connections. Researchers interact with the newsletters and the system tracks those interactions to design a graph of relationships between them. According to Blumer (1969), human activity relies in “symbolic interactionism” ideas, where interaction plays the basis role for the growth of any relationship. Still, Vrasidas and Glass (2002) defined interaction as “the reciprocal actions of two or more actors within a given context”, meaning that it is an ongoing process that is based in a context and also creates context. In fact, Email Management System proposes newsletter in order to create context and deliver it to their receivers. Once the
information is well structured and supported by a clear design, it is easier to create context and make it reach the receivers. On the other hand, as soon as receivers understand the context more easily they will interact with the content. “There is a reflexive relationship between context and interaction that prevent the isolation of both” [21].
The symbolic “interactionist framework” presents constructivism as an aspect that can be personal or social. While personal constructivism is about the knowledge being constructed in the head of the learner, social constructivism focuses its knowledge in “communities of practice” through social interaction. Particularly in the EMS, it focuses on encouraging the activities of sharing as communities of practice by spreading the work of a scientific community with other communities as well as online social communities.
The concept of “situated cognition” was introduced by Brown et al. (1989) and it is applied when the knowledge is an integral part of the learning process. As for “distributed cognition” is about the knowledge being distributed through online participants and their physical environmental. The distributed aspect is practiced by EMS by distributing scientific content across communities of practice. Zaphiris and Ang (2010) define communities of practice as “a shared commitment for a particular practice that creates an interactional network enabling and promoting knowledge sharing and professional development” [24], in other words, as a groups of individuals that are connect by what they do and learn together. With the evolution of the web technologies, the collaboration is being encouraged to use new technologies to facilitate the participation in “nonlocal” communities. As for “local” environment it continues to play a fundamental role in collaboration among communities.
The exploration of web technology encourages people to collaborate virtually and therefore to create online communities. Rheingold (1993) defined online communities as “social aggregations that emerge from the Net when enough people carry on those public discussions long enough, with sufficient human feeling, to form webs of personal relationships in cyberspace”. Thus, it is important to make receivers feel that their contributions have value and that they help the community to grow. EMS brings the concept of online communities by expanding scientific work and allowing individuals to interact with the content. This refers to the process where people can learn and work together using technology systems, particularly through newsletters reading and interaction.
The use of technological innovations to effectively achieve collaboration has been important to enrich scientific work and expand contacts. Social interaction and virtual communities not only improve productivity and learning outcomes via collaboration work but also the way researchers
get involved and communicate, overcoming geographic barriers and making use of web technology as a collaboration tool.
2.3. Implicit and Explicit Relations
The study about relationship is covered at various fields. Logic and philosophy define it as a link between individuals or objects, and mathematics as a generalization of arithmetic relations [22]. As for computer science relations describe links between components or objects. However, once the EMS represents its data as a network, the relations are the links between the nodes, and the nodes the researchers that interact with the newsletters. What is particular about the proposed system is that its network is only based on implicit relationships. Unlike the explicit relations, who define the relationships that are clearly indicated and acknowledged by individuals, implicit relations are based on individuals’ behavior.
As mentioned above, every time a researcher clicks a link the action is tracked so the system could be able to discover implicit connections. The process begins after the newsletter reaches researchers’ mailing box. There, researchers can interact with the newsletter by clicking on the links and the system will store those actions before forwarding the researcher to the real link. Once, the links are tracked (i.e. modified to record the actions on it) when any receiver clicks, the request is forwarded to the server, which in turn forwards the request to the real link by matching the generated newsletter’s link with the actual link. This process is shown in the Figure 1 [#3], where the dotted arrow represents both communication of asking and answering about the real link.
The implicit relations lead from the interactions between researchers and newsletters, along with the links’ categorization. A click in a specific link results into a relation between the researcher and the link’s categories and therefore an implicit connection between that researcher and the researchers that clicked the same categories. However, the implicit connections between researchers may differ on their cohesion depending on the total number of interactions with a category. The more interactions in a category, the higher the cohesion between the researcher and the category will be.
2.4. Girvan-Newman Algorithm
The identification of implicit connections leaves the possibility to organize researchers by groups. This option is achieved through the use of Girvan-Newman Algorithm, which “identifies group structures based solely on link analysis” [13]. In fact, the use of Newman’s algorithm leads to the use of “edge betweenness” as a measure for community detection. In a
classical definition betweenness is defined as the state of being between two other in an ordered mathematical set. In a graph context, edge-betweenness is a centrality measure of an edge within a graph, in other words, the number of shortest paths that pass through a given edge. In 1997, Freeman introduced the concept of betweenness centrality (or “betweenness”) of a node i in a simple graph as “the total number of shortest paths that pass through node i on the network”. For a graph G: = (N, E), betweenness centrality of a node i is given by the expression 𝑔 𝑖 = !!"(!)
!!"
!!!!! where σst represents the total number of shortest paths from node s to node t
and σst(i) the total number of those paths that pass through node i. Newman and Girvan (2002)
extended this definition to “edge betweenness” where betweenness of an edge e is the number of shortest paths between two edges that pass through it. In the particular approach of community detection as a graph representation Girvan and Newman noted that “traditional methods such as hierarchical clustering worked well for tightly-coupled communities, but tended to separate peripheral vertices from the clusters to which they seemed naturally to belong” [20]. To improve the existing methods for communities’ detection Girvan and Newman proposed its new algorithm based on edge betweenness:
For a connected graph G: DO
Calculate betweenness for all edges. Remove edge(s) with highest betweenness. UNTIL G is no longer connected.
Repeat for each connected component Gk of G, until no edges remain.
With the proposed algorithm Newman and Girvan argued that “edge betweenness is a good way to identify edges that act as ‘bridges’ between two communities, carrying large numbers of shortest paths between pairs of vertices”. This approach allows the detection of community structure “in which network nodes are joined together in tightly knit groups, between which there are only looser connections” [11]. However, to implement the Girvan-Newman algorithm the EMS proposes the use “Vizster” as a tool to visualize communities.
2.5. Visualization of Social Networks
“Vizster” was implemented by Heer and Boyd (2005) with the goal of “building a visualization system that end-users of social networking services could use to facilitate discovery and increased awareness of their online community” [13], in other words, an interactive system to visualize online social networks and allow the exploration of community structure. The network is presented as an egocentric networks once it places an individual as the center and then his
immediate connections, creating an indirect graph of social activity. An animated layout is used to organize the network and to provide a clear visualization. It also allows a useful linkage view, by clicking two nodes and highlighting the common connections between them.
For the community identification and visualization Vizster is extremely powerful as it is able to identify and represent community groups at the various stages of Girvan-Newman Algorithm allowing the user to search for alternative community configurations. In addiction, the system has a search engine, which enables scientific communities to search for keywords highlighting the nodes where the keyword(s) exist. The network design is based in the Shneiderman’s mantra of “overview first, zoom and filter, then details-on-demand”, instead of the classical approach of “start with what you know, then grow” and has the X-ray mode in order to explore profile attributes. Since Vizster is also an open source tool, scientific communities can use its functionalities to identify and visualize communities as well as shaping it according to their needs.
3. Evaluation
The evaluation of the proposed system was made in a scientific community called Nano-Tera.ch with a high diversity of projects. The goal was to discover relationships between their researchers and bring to light common interests. By following a set of steps, the EMS was measured on their scientific community about 6 months, with the development and test of 4 newsletters.
3.1. About Nano-Tera.ch
The scientific community of Nano-Tera.ch is a Swiss program with more than 40 projects in different areas such as health, security, and environment and it vision challenges the convergence of expertise from different fields as a strategic approach to stimulate innovation. Towards this strategic objective, it is also one of the scientific communities trying to understand its researches’ behavior [23]. In addition, Nano-Tera.ch has a strong point in the study of interactive communities by offering two different approaches. “Inside-out Perspective” where each project has its own WikiPage and it is “strongly encourage to participate and share information such as abstracts, news, didactic videos, and interesting results published” [23]. And the “Outside-in Perspective” where Nano-Tera has defined “several themes to expand the vision of the application potentials for each research field” [23]. The goal is to trigger the interest from the outside communities about Nano-Tera projects as well as gain larger exposure to obtain contributions from the outside world.
3.2. Results
Although the evaluation of the EMS was based in 4 newsletters and 6 months of analysis, the statistical data presented in the following results are only based in the last newsletter. This relates to the evolution of the system in order to improve the statistical analysis and therefore the quality of the results. However, the results are based in two months of study where they were 93 clicks from 54 individuals of 139 that opened the email with the newsletter.
a) Links’ Types by Percentage
The results show clearly that Nano-Tera scientific community is more text (82%) than imagine based (3%). The total number of clicks on links associated with text were clear higher than those related with images. The fact for this statistics holds in the use of images with low scientific sense and to the reduced number of images regarding the existing text.
b) Links’ Categories by Percentage
Once the categories extend for the groups, we could identify that the community is primarily divided in three main groups, “Health”, “Environment”, and “Security”, with the total number of clicks of 30, 21, and 17 respectively. Because Nano-Tera has projects in these subjects the results show the commitment that those projects have about learning and to be updated about Nano-Tera community. However, it would be expected the identification of more groups once Nano-Tera has more projects in different subjects. The reason may be the weak of the news on those areas or the lack of interest in newsletters.
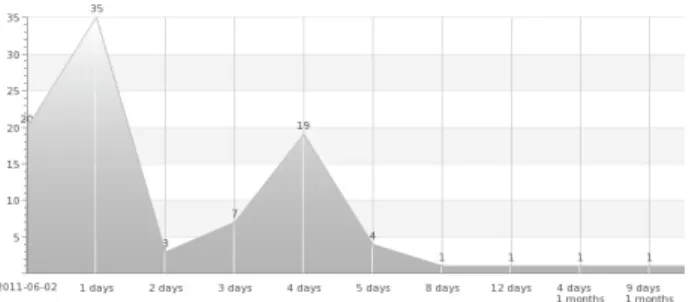
c) Clicks per Date
Figure 3 – Results about the link’s types
Figure 4 – Results on the link’s categories
This particular case is interesting because the newsletter was sent two days before the weekend and at 7 p.m. The results show that both day and hour are important to achieve a higher impact. The 7 p.m. was not a good option since most researchers check their email the next day or postpone the decision of reading the Nano-Tera email. Both scenarios are bad because the email will be pushed down on the list of received emails or the receiver will kill the reading by postponing it. After that the results show that researcher become off-line during the weekend and return to check their emails earlier in the week.
d) Community Detection
The community detection is performed using Vizster as a visualization tool. Vizster applies the Girvan-Newman algorithm and places the community detection through the implicit connections discovered by the EMS. EMS is responsible to create a network of researchers implicit connected and generate the XML file to be read by Vizster. The results show that Nano-Tera, according to the last newsletter, is divided into four different groups where people are connect according to common interests. The details show that the group #1 is based on researchers that have interest on “Nano-Tera”, i.e. researchers who strongly clicked on the links related to Nano-Tera, the group #2 is tightly based on researchers interested on “Environment” and slightly concerned about “Health”. On the other hand, the groups #3 and #4 are strongly connected to the subjects of “Security” and “Health” respectively. However, it is also possible to identify researchers with an additional interest on “Environment”. In the end, although researches are connected with different subjects, they are strongly linked to one in particular. This analysis allows Nano-Tera to identify which community of people with given attributes they should contact when they want to send a newsletter, or organize a conference in a particular subject.
4. Discussion
The following discussion tries to explain some curiosities about the results. The first one relies on the reduced number of clicks compared to the total number of emails sent (over five hundred contacts). In fact, the answer could be the lack of interest in the newsletter’s subject, the poor newsletter’s design or structure, be away from the office, or especially the tight filtering that the researchers do on their mailing boxes. However, the presented results are based on one of the two different newsletters that were sent in order to try different designs. Still, the option for a newsletter also has the disadvantage of competing against hundreds of other newsletters that reach researchers’ email box.
Another interesting result is the action of sharing. Once the option of share is clicked is not possible to know if the researcher really shared the newsletter. The final click is done at the sphere of the online social network and cannot be controlled by the system. However when a researcher decides to share the newsletter a new newsletter is created containing a unique ID that identifies the social network. But, when looking at the records it is not possible to find any of these IDs, meaning that the decision of sharing was not carried till the end or that no one at the social network clicked the newsletter. The conclusion is that Nano-Tera should find an alternative to penetrate social network, such as implement a feature to share the newsletter automatically with online social networks and encourage their community to share with their contacts in the social networks.
The use of the researchers’ personal information (e.g. names and email) to present the results brings on board the issue of privacy. Even though the study of communities’ behavior is an important aspect to discover hidden connections between researchers it is also important to ensure that all the collected data is security managed without compromising the safety of researchers. In fact, there are some security issues that can be applied to the system, such as, default “track” option off, restrict access to the data, and the use of a unique ID or a set of attributes to represent researchers. Either way, the security issues should be designed to protect researchers’ personal information without compromising the study about scientific communities. In the end, what the EMS tracks is not individuals’ personal information but a set of attributes (e.g. occupation, involved projects, department) that help discovering interests and therefore implicit relationships.
In summary, the present interesting and exciting results prove that the strategy to address scientific communities needs to be improved in order to encourage researchers to be more active and therefore help the results to be more consistent.
5. Related Work
In 2002, Ducheneaut and Bellotti commented that “even people having offices next to each other, still use email as a principal communication medium” [16]. Additionally, previous works have also used email has a source to discover implicit relations. In 1993, Schwatz and Wood, used email headers to extract shared interests between people using graph theory. However, this approach suffers from a lack of specificity since it ignored the message text and subject hiding the context in which the interests arise. PeCo (Ogata and Yano, 1998) collected users relationship through email “From” and “To” headers by extracting keywords from the message text. Still, is missing the analysis of the core message that can bring to light hidden relationships which are not represented in the “Subject”, “From”, and “To” fields of an email message. In 2003, McArthur and Bruza discover implicit connections by mining semantic associations from people’s communications. They proposed a model called HALe that automatically creates a dimensional representation of words based on the email corpus and uses it to discover a network of people implicit connected. However, the solution does not focus on the interactions between people and content, especially with a scientific perspective.
More recently, Al Chakra, O'Doherty, Rice, and Yap (2008) developed a system that uses email technology to track information dispersion based in the content substitution. The solution identifies entities to receive the email and “embeds a unique serial number by strategically changing words in the email content” [4]. When a leak occurs the application is able to identify its source and thus information dispersion. The system has a business perspective and its designed to be used in scenarios where the protection of data is crucial. In addiction its application domain is business focus and its functions are limited to the identification of information dispersion. When it comes to discover hidden relationships between people, the system is not able to answer this question and to give a reliable result.
Foulger, Chipperfield, Cooper, and Storms (2008) invented a system and a method to generate and track an email campaign. The system generates an email campaign template from an email target database, which uses to create a custom email for each email target. The email campaign engine sends each custom email to the corresponding email target where it includes a custom uniform resource locator (URL) to identify the source of each interaction. Every time an email target selects a link the action is store by the server and after used for statistical purposes. However, even though the same track method is used the system is not designed to explore the implicit connections between email targets and does not allow communities to change the system according to their needs. In fact, the system is well designed for marketing purposes but limited for data mining in a scientific perspective.
The major feature about the Email Management System is its scientific focus. The collected data is managed to obtain information about communities and to improve the way they explore their individuals’ behavior. A missing link between the data and its scientific perspective is the flaw that characterizes the existing systems. The proposed solution allows communities to bring to light hidden relationships between individuals and to categorize connections in order to enable building groups of individuals based on common interests. The exercise is about making the researchers’ grouping easier by finding implicit connections according to their actions. In the end, researchers can discover or be informed about people working in the same (or related) topic and understand which subjects have more interaction, as well as receive feedback from the outside world. In addiction, EMS allows communities to shape it according to their needs and to future developments thanks to its open-source basis. As important as the discovery and analysis of implicit relationships is the ability to improve the solution and thus help the communities.
6. Conclusion
The Email Management System tries to fill the need for scientific communities to learn more about their researchers. It identifies implicit connections between researchers by extracting information about their behavior and scientific interests. By placing interaction as the core, EMS is able to bring to light hidden relationships and to understand the commitment of a scientific community. The system proposes the design and spread of information as newsletters and subsequent tracking of the data that comes from the interactions between researchers and the content. The information is after used for statistical purposes in order to allow scientific communities to reach conclusions about their own. For example, if they are text or image based, to which subjects they interact more, what is the evolution of interactions over time, what are the researchers more committed, and what are the groups inside a scientific communities based on their implicit connections. In the end, communities can exploit EMS functionalities with the aim of expanding their knowledge about each individual and to better explore common interests.
7. Acknowledgements
This work is supported by funding from the Strategic Executive Committee of Nano-Tera.ch which is a program financed by the Swiss Government. Special thanks go to Professor Chris Tucci from CSI/EPFL who is supporting the Community Knowledge Development (CKD) project that triggered the present focused work.
8. References
[1] Aggarwal, C. “An introduction to social network data analytics”, Springer Science And Business Media, LLC 2011.
[2] Anandarajan, A. Anandarajan, M. “An Overview of e-Research Collaboration”, Springer-Verlag Berlin Heidelberg 2010, 3-11.
[3] Begley, K. Face to Face Communication – Making Human Connections in a
Technology-Driven World, Thomson Place, Boston, 2004.
[4] Chakra, Al. O'doherty, S. Rice, J. Yap, B. “Embedding a unique serial number into the content of an email for tracking information dispersion”, Patents on Demand, P.A. IBM-RSW, 2008.
[5] Choi, S. Kang, Y. Lee, H. “The effects of socio-technical enablers on knowledge sharing: an exploratory examination”, Journal of Information Science, 34 (5) 2008, 742–754. [6] Cucchiarelli, A. D’Antonio, F. Velardi, P. “Analyzing Collaborations Through
Content-Based Social Networks”, Springer-Verlag London Limited 2010, 387-409.
[7] Drázdilová, P. Obadi, G. Slaninová, K. Martinovic, J. Snásel, V. “Analysis and Visualization of Relations in eLearning”, Springer-Verlag London Limited 2010, 291-318.
[8] Freeman, L. The development of social network analysis, BookSurge LLC, 2004.
[9] Freitas, H. Barão, A. Silva, A. Social Networks in Information Systems - Tools and
Services (Chapter 1.10), 2008, IGI Global.
[10] Gibson, B. “Enabling an Accessible Web 2.0”, IBM Emerging Technologies.
[11] Girvan, M. Newman, M. “Community structure in social and biological networks”, Lawrence A. Shepp, June 11, 2002, vol. 99, no. 12, 7821-7826.
[12] Harley, J. Blismas, N. “An Anatomy of Collaboration Within the Online Environment”, Springer-Verlag Berlin Heidelberg 2010, 14-34.
[13] Heer, J. Boyd D., “Vizster: Visualizing Online Social Networks”, 2005 IEEE Symposium on Information Visualization, 2005.
[14] Isaías, P. Miranda, P. Pífano, S. “Critical Success Factors for Web 2.0”, Springer-Verlag Berlin, Heidelberg 2009, 354-363.
[15] Jackson, M. Watts, A. “The Evolution of Social and Economic Networks”, Journal of E5. conomic Theory, 106 (2002), 265-295.
[16] McArthur, R. Bruza P., “Discovery of implicit and explicit connections between people using email utterance”, Kluwer Academic Publishers, 2003, 21-40.
[17] O’Reilly, T. “What Is Web 2.0: Design Patterns and Business Models for the Next Generation of Software”, O'Reilly Media, Sebastopol (CA) USA, 17-37.
[18] Papacharissi, Z. A Networked Self: Identity, Community, and Culture on Social Network
Sites, Routledge, 2010.
[19] Payton, D. “Discovering Collaborators by Analyzing Trails Through an Information Space”, HRL Laboratories LLC.
[20] Pinney, J. Westhead, D. “Betweenness-based decomposition methods for social and biological networks”, Interdisciplinary Statistics and Bioinformatics: Proceedings (2006), 87-90.
[21] Rangwala, H. Jamali, S. “Co-Participation Networks Using Comment Information”, The AAAI Press, Menlo Park, California, 2010, 315-318.
[22] URL: http://en.wikipedia.org/wiki/Relationship
[23] URL: http://www.nano-tera.ch/members/management.html, http://www.nano-tera.ch/topdownbottomup/index.html
[24] Zaphiris, P. Ang, C. Social Computing and Virtual Communities, Chapman and Hall/CRC, 1 edition, 2009.