Valorisation of tomato wastes for development of nutrient-rich
antioxidant ingredients: A sustainable approach towards the needs of the
today's society
José Pinela
a,b, M.A. Prieto
a,c,⁎
, Maria Filomena Barreiro
d, Ana Maria Carvalho
a, M. Beatriz P.P. Oliveira
b,
Thomas P. Curran
e, Isabel C.F.R. Ferreira
a,⁎
aMountain Research Centre (CIMO), ESA, Polytechnic Institute of Bragança, Campus de Santa Apolónia, 1172, 5300-253 Bragança, Portugal bREQUIMTE/LAQV, Faculty of Pharmacy, University of Porto, Rua Jorge Viterbo Ferreira, n° 228, 4050-313 Porto, Portugal
cNutrition and Bromatology Group, Faculty of Food Science and Technology, University of Vigo, Ourense Campus, E32004 Ourense, Spain
dLaboratory of Separation and Reaction Engineering (LSRE), Associate Laboratory LSRE/LCM, Polytechnic Institute of Bragança, Campus de Santa Apolónia, 1134, 5301-857 Bragança, Portugal eUCD School of Biosystems and Food Engineering, University College Dublin, Belfield, Dublin 4, Ireland
a b s t r a c t
a r t i c l e
i n f o
Article history:
Received 20 December 2016
Received in revised form 31 January 2017 Accepted 8 February 2017
Available online 11 February 2017
Nutrient-rich antioxidant ingredients were produced from tomato fruit wastes using a microwave-assisted ex-traction (MAE) process. Different conditions of exex-traction time (t), temperature (T), ethanol concentration (Et) and solid/liquid ratio (S/L) were combined in a circumscribed central composite design and optimized by re-sponse surface methodology. The model was statistically validated and used for prediction in the experimental range. Under the global optimal MAE conditions (t= 20 min,T= 180 °C,Et= 47.4% andS/L= 45 g/L), it was possible to obtain an extraction yield of 75.5% and ingredients with high levels of sugars, proteins, phenolics, andflavonoids, and interesting antioxidant properties measuredviaABTS•+scavenging activity and oxidative haemolysis inhibition assay (OxHLIA). The antioxidant capacity of the extracts was lower compared to the one of commercial food additives. However, the sustainably developed ingredients may be used in the fortification and functionalisation of food, as well as for incorporation in feed products.
Industrial relevance:This study addresses current needs of the agri-food sector, namely the recycling of plant wastes and production of valuable extracts for the food/feed industry. A MAE process was developed and opti-mized to maximize the recovery of nutrients and antioxidants from tomato fruit wastes. The optimum processing conditions established in this study allowed a high extraction yield and reduced solvent consumption. MAE can be considered as a sustainable alternative to conventional extraction methods. Thesefindings will contribute to promote a more sustainable bioeconomy in the agro-food sector.
© 2017 Elsevier Ltd. All rights reserved. Keywords:
Tomato waste valorisation Microwave-assisted extraction Nutritional ingredients Antioxidant activity Response surface methodology
1. Introduction
The strict legislation for human health and environmental safety implemented today, and the emergence of novel methodologies for the extraction, fractionation, and recovery of biomolecules have caused great interest in plant-derived waste valorisation. Different kinds and amounts of agri-food wastes are produced within the food-supply chain, representing a disposal problem for the industry (FAO, 2013), but promising sources of nutrients and phytochemicals (Ravindran &
Jaiswal, 2016; Riggi & Avola, 2008). Thus, the sustainable use of plant-derived wastes for recovery of added-value compounds with potential application in the food, feed, biotechnological, and pharmaceutical in-dustries may help to tackle the societal challenges of the 21st century.
The recovery of valuable molecules from agri-food wastes and its recycling inside the food chain as food ingredients can be carried out fol-lowing the so-called“5-stages universal recovery process”(Galanakis, 2012, 2013). This holistic approach includes: (1) macroscopic pretreat-ment; (2) separation of macro- and micromolecules; (3) extraction; (4) purification/isolation; and (5) encapsulation or product formation (Galanakis, 2012). Recent trends on extraction, one of the most impor-tant steps of the recovery process, have focused onfinding more effi -cient and green technologies that minimize the extraction time and solvent consumption. Among them, microwave-assisted extraction (MAE) (Albuquerque et al., 2017; Pinela, Prieto, Carvalho, et al., 2016b), ultrasound-assisted extraction (Albuquerque et al., 2017;
–
Abbreviations: t, extraction time;T, temperature;Et, ethanol concentration; S/L, solid/ liquid ratio; PROT, total protein content; RS, reducing sugars; TFC, totalflavonoid content; TPC, total phenolic content; TS, total sugars.
⁎ Corresponding authors.
E-mail addresses:[email protected](M.A. Prieto),[email protected](I.C.F.R. Ferreira).
http://dx.doi.org/10.1016/j.ifset.2017.02.004 1466-8564/© 2017 Elsevier Ltd. All rights reserved.
Contents lists available atScienceDirect
Innovative Food Science and Emerging Technologies
Heleno et al., 2016), and extraction with electrotechnologies (such as pulsed electricfields, high-voltage electrical discharges and pulsed ohmic heating (Barba, Galanakis, Esteve, Frigola, & Vorobiev, 2015; Galanakis, 2012, 2013; Roselló-Soto et al., 2015)) and pressurized liq-uids (Galanakis, 2013; Setyaningsih, Saputro, Palma, & Barroso, 2016) generally meet these requirements. In the case of MAE, the microwaves energy heat the solvent and interacts directly with the free water mol-ecules present inside the plant material, resulting in a rapid build-up of pressure within cells and a pressure-driven enhanced mass transfer of compounds into the solvent. This hot-spot technique has been indi-cated to achieve high yields of specific phytochemicals (Deng et al., 2015) and to minimize its degradation and the energy consumption (Strati & Oreopoulou, 2014; Zhang, Yang, & Wang, 2011).
Extraction processes are significantly affected by several factors (Albuquerque et al., 2017; Heleno et al., 2016; Pinela et al., 2016b; Wong et al., 2015). For its optimization, one-factor-at-a-time ap-proaches do not evaluate interactive effects among variables and de-mand an increased number of experimental trials. However, these problems can be overcome using the response surface methodology (RSM), a collection of statistical and mathematical techniques based on thefit of a polynomial equation to the experimental data, which must describe the behaviour of a data set, with the aim of making statis-tical previsions (Bezerra, Santelli, Oliveira, Villar, & Escaleira, 2008). When planning MAE experiments, it is also necessary to choose an ap-propriate experimental design. The circumscribed central composite design (CCCD) is a common RSM used and consists of a design with cen-tre points and a group of axial points, also called star points, to estimate the process curvature (Box & Hunter, 1957). It is also important to carry out preliminary studies to select relevant variables and centre the ex-perimental domain.
Currently, there are large amounts of fresh tomato wastes resulting from the crop growing, as well as during packaging, processing, storage, and sale, which consist of plant remains, green fruits, turning fruits, red unmarketable fruits, and miscellaneous materials (Riggi & Avola, 2008). In addition, losses resulting from a surplus production of this crop can also occur. The fruit contains large amounts of bioactive compounds (Barros et al., 2012; Pinela, Barros, Carvalho, & Ferreira, 2012), which are involved in the reduced risk for chronic degenerative diseases induced by oxidative stress and inflammation, such as cardiovascular diseases and various types of cancer (Kim, Nam, & Friedman, 2015;Li, Deng, Liu, Loewen, & Tsao, 2014; Pinela, Oliveira, & Ferreira, 2016c; Stajčićet al., 2015; Vilahur et al., 2014). Additionally, there is a growing demand by the food industry and consumers for the use of natural functional and nutritional ingredients in foods instead of chemically synthesized molecules (Carocho, Morales, & Ferreira, 2015). Because of this, the tomato wastes are promising cheap resources to be recovered and recycled inside the food chain, in order to implement a sustainable strategy that addresses the current challenges of the industrialized world.
In this sense, this study aims the valorisation of fresh tomato fruit wastes by establishing a MAE protocol for production of nutritionally valuable ingredients with antioxidant properties based on a CCCD. In this approach, the levels of total sugars, reducing sugars, proteins, total phenolics, and totalflavonoids were determined and used as dependent variables; as well as the antioxidant activity, evaluated through the ABTS and OxHLIAin vitroassays, which was compared with the results of typical commercial antioxidants used in the food industry.
2. Material and methods
2.1. Equipment, standards and reagents
Equipments:Microwave apparatus (Biotage® Initiator+, Uppsala, Sweden) using closed high precision glass vials. Multiskan Spectrum
Microplate Photometer (Thermo Fisher Scientific, Inc., Shanghai, China) using 96-well polypropylene microplates.
Standards and reagents:ABTS (2,2′ -azino-bis(3-ethylbenzothiazo-line-6-sulfonic acid)), AAPH (2,2′-azobis(2-methylpropionamidine) dihydrochloride), trolox (6-hydroxy-2,5,7,8-tetramethylchroman-2-carboxylic acid), BHA (butylated hydroxyanisole), BHT (butylated hy-droxytoluene), PG (propyl 3,4,5-trihydroxybenzoate), TOC ((2R )-2,5,7,8-tetramethyl-2-[(4R,8R )-(4,8,12-trimethyltridecyl)]-6-chromanol or α-tocopherol), ETX
(6-ethoxy-2,2,4-trimethyl-1,2-dihydroquinoline or ethoxyquin) and TBHQ (tert-butylhydroquinone), with a purity higher than 98%, were purchased from Sigma S.A. (St. Louis, MO, USA). All other chemicals and solvents were of analytical grade and purchased from common sources. Water was treated in a Milli-Q water purification system (Millipore, model A10, Billerica, MA, USA).
2.2. Preparation of the extracts
2.2.1. Plant material
Unmarketable ripe red tomato (Lycopersicon esculentumMill.) sur-pluses from a farmers' variety (locally known as“tomate redondo”) were directly obtained from a local producer in Miranda do Douro, North-eastern Portugal. Pericarps without seeds, corresponding to most common tomato wastes, were lyophilized (Free Zone 4.5, Labconco, Kansas City, MO, USA), reduced to afine dried powder (20 mesh) and kept at−20 °C until analysis.
2.2.2. Microwave-assisted extraction
The MAE process was performed in a microwave apparatus using closed vials of 20 mL (final volume). The powdered dried samples were extracted at different time (t), temperature (T), ethanol concen-tration (Et) and solid/liquid ratio (S/L) ranging as defined by the RSM experimental design presented in Table A1. During extraction, samples were stirred at 600 rpm and irradiated at 200 W. After that, the reaction mixture in the closed vial was quickly cooled in the processing chamber and then centrifuged at 6000 rpm for 10 min. The supernatant was care-fully collected, evaporated under reduced pressure to remove the sol-vent andfinally re-suspended in distilled water for further analysis. A full diagram of the process performed is presented in Fig. A1.
2.3. Evaluation of the extraction yield
The extracted residue (%) was evaluated gravimetrically in crucibles by partially evaporating the water at 60 °C followed by a treatment at 105 °C during 24 h.
2.4. Evaluation of compositional parameters
Total sugars (TS) were evaluated by the phenol-sulphuric acid meth-od using glucose as standard (Dubois, Gilles, Hamilton, Rebers, & Smith, 1956) and expressed in mg per g of extract (mg/g E).
Reducing sugars (RS) were evaluated by the 3,5-dinitrosalicylic acid (DNS) reaction using glucose as standard (Bernfeld P, 1951) and expressed in mg per g of extract (mg/g E).
The total protein content (PROT) was calculated by multiplying the total nitrogen content by the conversion factor of 6.25 (Havilah, E.J., Wallis, D.M., Morris, R., Woolnough, J.A., 1977) and expressed in mg per g of extract (mg/g E).
The total phenolic content (TPC) was determined by the Folin-Ciocalteu method with some modifications (Pereira, Barros, Carvalho, & Ferreira, 2011) using gallic acid as standard and expressed as mg of gallic acid equivalents (GAE) per g of extract (mg GAE/g E).
The totalflavonoid content (TFC) was determined by the colorimet-ric method as described by the authors (Barros, Carvalho, Morais, & Ferreira, 2010) using catechin as standard, and expressed as mg of catechin equivalents (CE) per g of extract (mg CE/g E).
2.5. Evaluation of the antioxidant activity
2.5.1. ABTS assay
The ABTS•+solution (250μL) prepared according to other authors
(Prieto, Curran, Gowen, & Vázquez, 2015) was mixed with the extracts (50μL) in a 96-well microplate (flat bottom). The microplate reader was
programmed to read the absorbance at 414 nm to follow the reduction of ABTS•+(15 nM) at 30 °C by monitoring the decrease in absorbance until the reaction reached a steady state (Serpen, Capuano, Fogliano, & Gökmen, 2007).
The asymptotic variation of the ABTS•+scavenging activity in func-tion of an antioxidant compound suggests that some radical-generating properties of the system can be saturated (Gieseg & Esterbauer, 1994). In general, these patterns can be adjusted by a group of mathematical expressions (mechanistic or not) that translates the pattern of the re-sponse into parameters that allow to deduce the meaning and/or quan-tify the effect of the dependent variable in a simple and global mode. The applicability of different mathematical expressions to quantify the antioxidant response have been discussed (Prieto, Vázquez, & Murado, 2014). In this sense, the Weibull cumulative distribution function was selected (Weibull & Sweden, 1951). Thus, the variation of the ABTS•+ response (R) in function of increasing concentrations of an antioxidant (A) was described using the Weibull model rearranged for our own pur-poses according to Eq.(1).
R Að Þ ¼K 1−exp −ln 2ð Þ1−a 2Vm
Ka A
a
ð1Þ
where the parameterKis the concentration of the ABTS•+(15 nM) and is the starting point of the response. The parameterVmcorresponds to
the average amount of scavenged molecules per g of extracted material (nM of ABTS/g E). The parameterais a shape parameter related to the slope that can produce potential profiles (ab1),first order kinetic
ones (a= 1) and a variety of sigmoid profiles (aN1). For the calculation
of theIC50the following relation was used:
IC50¼Ka ln2
2Vm ð
2Þ
2.5.2. Oxidative haemolysis inhibition assay (OxHLIA)
Erythrocytes were obtained from different adult sheep, washed at least three times with PBS and re-suspended in PBS at 2.8% (v/v) (Takebayashi et al., 2007). The erythrocyte suspensions (50μL), in the
absence or presence of an antioxidant sample (100μL) in PBS, were
added to a 96-wellflat bottom microplate. Complete haemolysis was obtained by adding water to the erythrocyte suspension without sam-ple. The plate was pre-incubated with a lid at 37 °C, then AAPH (50μL,
160 mM in PBS) was added to initiate the assay and incubated at 37 °C in with shaking. The optical density at 660 nm was measured every 10 min (Takebayashi, Iwahashi, Ishimi, & Tai, 2012). The percent-age of survival erythrocyte population (P) was calculated using Eq.(3):
P¼ nt−nmax
n0−nmax
100 ð3Þ
wherenis the optical density measure at the start of the reaction (0) or at anyt(min) andnmaxis the maximum optical density of the complete haemolysis. Then, the time to reach 50% of the survival population (IC50) was obtained graphically for an increasing concentration of an antioxi-dant. Afterwards, theτvalues for each dose tested were analyzed line-arly as follows:
IC50ð Þ ¼D bþmD ð4Þ
whereIC50is the dose needed to reach 50% of the lysed erythrocyte
population,bis the intercept (min) andmis the slope of the process (min/g E).
2.5.3. Evaluated commercial food additives
The antioxidant activity of the extracts was compared to that of dif-ferent commercial antioxidants, which are listed below:
(a) BHA (E320): a synthetic antioxidant mainly used as preserva-tive in lipophilic and hydrophilic environments.
(b) BHT (E321): a synthetic lipophilic antioxidant compound used as food additive.
(c) PG (E310): an antioxidant commonly added in lipophilic foods to prevent oxidation.
(d) TOC (E306): a lipophilic compound useful for its antioxidant properties.
(e) ETX (E324): a synthetic lipophilic preservative commonly used in animal feeds.
(f) TBHQ (E319): a synthetic highly effective antioxidant in foods. (g) Trolox: a water-soluble antioxidant compound used in biolog-ical or biochembiolog-ical applications for oxidation inhibition purposes.
2.6. Response surface methodology
2.6.1. Experimental design
Afive-level CCCD coupled with RSM was applied to optimize the MAE conditions for production of nutritionally valuable ingredients with antioxidant properties from tomato wastes. It was intended to produce afinal product with potential as a food additive or ingredi-ent for fortification and functionalisation purposes. For this, the four independent variables of extraction time (min,x1), temperature (°C,x2), ethanol concentration (%,x3) and solid/liquid ratio (g/L,x4) were selected based on a previous study (Pinela, Prieto, Barreiro, et al., 2016a). The same study also found that the microwave power do not influence the MAE process. The combined effects of these four variables on the evaluated responses were evaluated in a CCCD as proposed by Box and Hunter (Box & Hunter, 1957). The optimiza-tion study was solved using 25 independent combinaoptimiza-tions and 7 replicates at the centre of the experimental domain, which, in other cases, could imply 625 possible combinations. In this design, the experimental points are generated on a sphere around the centre point (five levels of each factor), which is a supposed to be an optimum position for the response and is repeated to maximize the prediction (Box, Hunter, & Hunter, 2005). A detail description of the mathematical expressions to calculate the design distribution and to decode and code the ranges of the variables tested can be found in Table A1 of the Supplemental material.
2.6.2. Mathematical modelling
The response surface models werefitted by means of least-squares calculation using the following second-order polynomial equation:
Y¼b0þ∑ n
i¼1biXiþ ∑ n−1
i¼1
jNi ∑n j¼2bijXiXjþ
∑n i¼1biiX
2
i ð5Þ
where Y is the dependent variable (response variable) to be modelled,Xiand Xj define the independent variables, b0 is the constant coefficient,biis the coefficient of linear effect,bijis the
coefficient of interaction effect,biithe coefficients of quadratic effect
andnis the number of variables. Although the model parameters obtained are empirical and cannot be associated with a mechanistic meaning, they are useful to predict the results of untested operation conditions (Pinela et al., 2016a). The sign of the effect marks the response performance. In this way, when a factor has a positive effect, the response is higher at the high level and when a factor has a negative effect, the response is lower at the high level. The
higher the absolute value of a coefficient, the more important the weight of the corresponding variable (Heleno et al., 2016).
2.6.3. Simplex procedure for optimize the variables to a maximum response
For optimization of the MAE conditions, the parametric model re-sponses produced were integrated into a simplex tool to solve non-lin-ear problems (Heleno et al., 2016; Pinela et al., 2016a) andfind the variable values that will maximize the extraction of nutrients and phy-tochemicals of interest. Limitations were made to the variable coded values to avoid unnatural conditions (i.e., lower times than 0 or higher values than 100% of the solvent).
2.7. Numerical methods and statistical analysis
Allfitting procedures, coefficient estimates and statistical calcula-tions were performed using a Microsoft Excel spreadsheet and graphical illustrations presented were developed in the software DeltaGraph V6. Fitting and statistical analysis of the experimental results according to the proposed equations were carried out in four phases:
Coefficients determination:Parametric estimates were obtained by minimization of the sum of quadratic differences between observed and model-predicted values, using the nonlinear least-square (quasi-Newton) method provided by the macroSolverinMicrosoft Excel2003 (Kemmer & Keller, 2010), which allows a quick testing of a hypotheses and its consequences (Murado & Prieto, 2013).
Coefficients significance:The determination of the parametric confi -dence intervals done using the‘SolverAid’(Prikler, 2009). The model was simplified by dropping the terms which were not statistically sig-nificant atα= 0.05.
Model consistency:The FisherFtest (α= 0.05) was used to
deter-mine whether the constructed models were adequate to describe the observed data (Shi & Tsai, 2002).
Other statistical assessment criteria:To re-check the uniformity of the model the following criteria were applied: a) the‘SolverStat’macro (Comuzzi, Polese, Melchior, Portanova, & Tolazzi, 2003), which was used for the assessment of parameter and model prediction uncer-tainties; b) R2that is interpreted as the proportion of the variability of the dependent variable explained by the model; c) adjusted coefficient of determination (R2
adj), which is a correction to R2taking into account the number of variables used in the model; d) bias and accuracy factors of all equations were calculated to evaluate the quality offittings to experimental data, such as the Mean Squared Error (MSE), the Root Mean Square of the Errors (RMSE) and the Mean Absolute Percentage Error (MAPE); e) the Durbin-Watson coefficient (DW) to check if the residuals of the model are not auto-correlated; and f) the Analysis Of Variance table (ANOVA) to evaluate the explanatory power of the variables.
3. Results and discussion
3.1. Preliminary experiments
A preliminary study was carried out to centre the experimental do-main of the variables and select the relevant ones before RSM application. The parametric results obtained from the preliminary anal-ysis of the relevant system variables are presented in Table A2. The ex-traction yield, TPC and TFC were evaluated as responses. Only linear relations were found and the confidence interval of the slope was used to test the statically significance (s) or non-significance (ns) of the independent variable on the evaluated response. Other statistical in-formation such as the correlation coefficient and F test are also displayed.EtandS/Lhad significant effects on the three measured re-sponses. TheTinduced significant effects on TPC and TFC. Thetwas only significant for TPC. The absorption level, an internal factor of the in-strument software, did not induced significant changes on the evaluated responses. These results are in agreement with those reported in a study
to optimize the extraction of hydrophilic and lipophilic antioxidants from a surplus production of tomato (Pinela et al., 2016a).
3.2. RSM analysis
3.2.1. Determination of the parameters that will be used as responses for the analysis of the antioxidant behaviour in the RSM
Fig. A2 illustrates the antioxidant responses of the ABTS•+assay for the different extracts obtained under the RSM experimental design presented in Table A1. Each graph illustrates the dose responses of the 25 independent variable combinations, in which dots represents the remaining nM of ABTS radicals in function of the used concentration (which were standardized into 0–1 format to be able to display all of them together) and lines represent the fitted response to the mathematical model of Eq.(1). The obtained parametricfitting values are shown in Table A3. The parameterKis the initial concentration of ABTS•+(15 nM) used in the antioxidant reaction, the parameterVmcorresponds to the amount of scavenged
nM ABTS/g E which ranged from 1.71 to 3.11, and the parameterIC50 indicates the concentration needed to reach 50% of the maximum protective effect obtaining the lowest value (corresponding to the highest activity) at run no. 23 (1.70 g E). All coefficients showed effects with significant parametric intervals at the 95% confidence level (α= 0.05).
The OxHLIA assay is based on the inhibition of free radical-induced membrane damage in sheep erythrocytes by antioxidants. The erythrocytes are subjected to haemolytic activity by the action of hydrophilic and lipophilic radicals in an aqueous system (Prieto & Vázquez, 2014). The hydrophilic radicals result from the thermal decomposition of AAPH, which attacks the biomembranes of erythrocytes and eventually cause haemolysis. Because of this attack, lipophilic radicals are generated through a lipid peroxidation phenomenon. The antioxidants can capture the hydrophilic and/or lipophilic radicals and, consequently, retarded the haemolytic time. Additionally, these radicals and substrate targets are biologically relevant compared to otherin vitroassays; for this reason, this bioassay is considered as being halfway betweenin vitroandin vivo. The antioxidant responses of the OxHLIA assay are illustrated in Fig. A3 for the extracts obtained under the RSM experimental design (Table A1). On the left-hand side, each graph illustrates the concentration-time responses of seven serial dilutions and the control of the 25 independent variable combinations. For each graph on the right-hand side, dots represent the extension of half-life spam of the erythrocyte population values in a concentra-tion-response format obtained from the concentration-time responses presented in the left-hand side, and lines represent the fitted responses to the mathematical model of Eq.(4). The obtained parametricfitting values are shown in Table A3. The parameterbis the intercept (min) which corresponds to the haemolytic time of the reaction without antioxidant (control) andmis the slope of the process (min/g E) that measures the sample capacity to extend the half-life of the erythrocyte population. Therefore, the higher them
value, the higher the antioxidant capacity of the extract,i.e., the higher free radical-induced membrane damage inhibition capacity of the extracts. The highest response (16.8 min/g E) was achieved with the run n° 16.
3.2.2. Mathematical models developed from the CCCD with four variables
The results obtained according to the statisticalCCCDare shown inTable 1for each of the computed responses. Afterfitting Eq.(5) to the response results ofTable 1using a non-linear least-squares procedure, the estimated parametric values, parametric intervals and numerical statistical criteria were obtained and presented inTable 2. Those coefficients, which showed effects with coeffi -cient interval values (α= 0.05) higher than the parameter value
Table 1
Numerical values of the responses obtained under the conditions of the RSM design. The estimated numerical values ofvm(nM ABTS/g E) andm(min/g E) used as responses were achieved using the Eq.(1)and Eq.(4), respectively.
Run Experimental domain Residue Compositional parameters Antioxidant activity
X1: t X2: T X3: Et X4: S/L Yield TS RS PROT TPC TFC ABTS OxHLIA
min °C % g/L mg/g E mg/g E mg/g E mg GAE/g E mg CE/g E nM ABTS/g E min/g E
1 -1(5) -1 (90) -1 (25) -1 (15) 71.08 646.0 324.7 35.26 6.81 0.51 2.41 2.28
2 1(15) -1 (90) -1 (25) -1 (15) 71.16 577.3 399.1 47.28 5.37 0.38 2.75 2.70
3 -1(5) 1 (150) -1 (25) -1 (15) 68.90 569.3 405.6 46.20 8.98 0.66 2.94 3.43
4 1(15) 1 (150) -1 (25) -1 (15) 69.42 596.4 444.4 58.25 14.14 0.84 2.67 8.03
5 -1(5) -1 (90) 1 (75) -1 (15) 73.51 715.2 543.5 25.91 14.23 0.99 1.71 6.59
6 1(15) -1 (90) 1 (75) -1 (15) 69.86 634.6 490.1 36.38 7.64 0.69 2.09 10.26
7 -1(5)` 1 (150) 1 (75) -1 (15) 67.68 591.2 442.8 35.66 21.69 1.04 2.16 10.48
8 1(15) 1 (150) 1 (75) -1 (15) 67.20 602.8 397.8 46.73 26.09 1.26 2.59 15.72
9 -1(5)` -1 (90) -1 (25) 1 (35) 67.01 726.1 392.1 51.71 6.72 0.27 2.28 2.43
10 1(15)` -1 (90) -1 (25) 1 (35) 67.24 634.4 442.1 63.20 5.37 0.16 2.63 2.98
11 -1(5)` 1 (150) -1 (25) 1 (35) 70.01 582.6 443.5 66.24 9.67 0.77 2.93 3.82
12 1(15) 1 (150) -1 (25) 1 (35) 70.12 613.1 486.1 78.15 13.51 1.00 2.88 9.04
13 -1(5) -1 (90) 1 (75) 1 (35) 60.62 673.0 523.8 38.07 7.37 0.57 2.07 6.16
14 1(15) -1 (90) 1 (75) 1 (35) 60.72 625.1 482.7 48.35 6.20 0.46 2.43 9.92
15 -1(5) 1 (150) 1 (75) 1 (35) 64.58 532.0 427.8 51.82 21.72 1.28 2.43 9.58
16 1(15) 1 (150) 1 (75) 1 (35) 64.95 533.9 380.7 63.06 27.70 1.72 2.61 14.92
17 -2(0) 0 (120) 0 (50) 0 (25) 68.96 617.7 471.2 53.91 6.79 0.43 2.21 4.49
18 2(20) 0 (120) 0 (50) 0 (25) 68.52 603.3 467.4 76.64 6.50 0.43 2.55 12.87
19 0(10) -2 (60) 0 (50) 0 (25) 71.53 624.4 428.4 38.31 8.54 0.85 1.88 3.20
20 0(10) 2 (180) 0 (50) 0 (25) 72.51 482.8 378.9 64.15 38.63 2.86 2.58 5.45
21 0(10) 0 (120) -2 (0) 0 (25) 64.90 629.5 432.9 36.81 5.05 0.23 2.83 2.51
22 0(10) 0 (120) 2 (100) 0 (25) 52.58 650.2 513.6 14.71 15.64 0.71 2.15 15.42
23 0(10) 0 (120) 0 (50) -2 (5) 71.60 659.9 406.8 41.15 4.98 0.56 2.59 8.09
24 0(10) 0 (120) 0 (50) 2 (45) 64.83 633.4 443.5 72.98 5.70 0.46 3.11 8.81
25 0(10) 0 (120) 0 (50) 0 (25) 68.89 623.0 470.2 65.46 5.61 0.46 2.85 8.29
26 0(10) 0 (120) 0 (50) 0 (25) 68.48 656.8 475.0 65.06 5.68 0.46 2.41 8.14
27 0(10) 0 (120) 0 (50) 0 (25) 68.50 646.1 470.0 65.08 5.70 0.45 2.75 8.15
28 0(10) 0 (120) 0 (50) 0 (25) 68.47 640.5 470.9 65.06 5.72 0.45 2.94 8.24
29 0(10) 0 (120) 0 (50) 0 (25) 68.67 651.9 471.2 65.24 6.27 0.47 2.67 8.10
30 0(10) 0 (120) 0 (50) 0 (25) 68.43 637.0 471.9 65.01 6.02 0.44 1.71 8.14
31 0(10) 0 (120) 0 (50) 0 (25) 68.85 643.8 470.1 65.41 6.34 0.43 2.09 8.11
32 0(10) 0 (120) 0 (50) 0 (25) 68.70 652.7 471.5 65.27 6.31 0.44 2.16 8.17
Table 2
Parametric estimations of thefive-level factorial designfitted to the second-order polynomial model of Eq.(5), confidence intervals of the estimated parameter values (α= 0.05) and statistical information of the model proposed for each response.
Residue Compositional parameters Antioxidant activity
Yield TS RS PROT TPC TFC ABTS OxHLIA
Fitting coefficients obtained from Eq.(5)
Intercept b0 68.80±0.59 644.57±6.33 470.27±3.14 65.17±1.95 6.32±1.01 0.45±0.06 2.85±0.06 8.41±0.41
Linear effect b1 -0.15±0.04 -10.26±4.83 ns 5.67±1.13 0.34±0.08 0.02±0.01 0.10±0.04 1.90±0.37
b2 ns -37.23±4.83 -11.18±2.40 6.32±1.13 6.00±0.77 0.36±0.05 0.18±0.04 1.51±0.37
b3 -2.10±0.45 ns 21.39±2.40 -6.02±1.13 3.47±0.77 0.18±0.05 -0.20±0.04 3.11±0.37
b4 -1.96±0.45 ns 8.51±2.40 8.03±1.13 ns ns 0.08±0.04 ns
Quadratic effect b11 ns -7.89±4.33 ns ns ns ns -0.12±0.03 ns
b22 0.97±0.40 -22.12±4.33 -17.44±2.15 -3.54±1.02 4.58±0.69 0.35±0.05 -0.16±0.03 -1.02±0.33
b33 -2.35±0.40 ns ns -9.91±1.02 1.27±0.69 ns -0.09±0.03 ns
b44 ns ns -12.07±2.15 -2.08±1.02 ns ns ns ns
Interactive effect b12 ns 22.48±5.92 ns ns 1.87±0.95 0.11±0.07 -0.07±0.05 0.75±0.46
b13 ns ns -24.52±2.93 ns ns ns 0.06±0.05 ns
b14 ns ns ns ns ns ns ns ns
b23 ns -10.36±5.92 -38.29±2.93 ns 2.48±0.95 ns ns ns
b24 1.65±0.55 -11.49±5.92 ns ns ns 0.13±0.07 ns ns
b34 -1.32±0.55 -21.69±5.92 -15.59±2.93 ns ns ns 0.06±0.05 ns
Statistical information of thefitting analysis
Observations 32 32 32 32 32 32 32 32
R2 0.9552 0.9627 0.9723 0.9794 0.9690 0.9573 0.9565 0.9675
R2adj 0.9182 0.9319 0.9460 0.9590 0.9435 0.9222 0.9206 0.9407
MSE 29.5 4358.6 3886.4 434.3 120.3 0.5 0.2 25.6
RMSE 5.43 66.02 62.34 20.84 10.97 0.70 0.47 5.06
MAPE 0.87 1.20 0.71 0.74 11.33 12.50 2.01 8.68
DW 1.65 2.61 1.88 2.05 1.77 2.31 2.38 2.53
ns: no significant coefficient; R2: correlation coefficient; R2adj: the adjusted coefficient of determination for the model; MSE: the mean squared error; RMSE: the root mean square of the
errors; MAPE: the mean absolute percentage error; and DW: the Durbin-Watson statistic.
were consider as non-significant (ns) and were not used in model development.
Therefore, mathematical models were built, obtaining the following second-order polynomial equations according to Eq.(5)for each of the responses assessed:
For the extraction yield:
for the residue:
YYield=68.8−0.15x1−2.1x3−2.0x4+1.0x22−2.4x32+1.6x2x4−1.3x3x4 (6)
For each compositional parameter:
for the
TS: YTS=644−10x1−37x2−8x12−22x22−10x2x3−11x2x4−21x3x4 (7)
for the RS:
YRS¼470−11x2−21x3−8:5x4−17:5x22−12x42−24:5x1x3 −38x2x3−15:5x3x4
(8)
for the PROT:
YPROT=65.1 + 5.6x1+6.3x2−6.1x3−8.0x4−3.5x22−9.9x32−2.1x42 (9)
for the TPC:
YTPC=6.3 + 0.3x1+6x2+3.5x3+ 4.5x22+1.2x32+ 1.9x1x2+ 2.5x2x3 (10)
for the TFC:
YTFC=0.45 + 0.02x1+ 0.36x2+ 0.18x3+ 0.35x22+ 0.11x1x2+0.13x2x4 (11)
For each antioxidant activity:
for the ABTS:
YABTS¼2:85þ0:1x1þ0:18x2−0:2x3þ0:08x4−0:12x 2 1−0:16x
2 2 −0:1x
2
3−0:07x1x2þ0:06x1x3þ0:06x3x4 (12)
for the OxHLIA: YOxHLIA=8.4 + 1.9x1+1.5x2+ 3.1x3−1.1x22+ 0.75x1x2 (13)
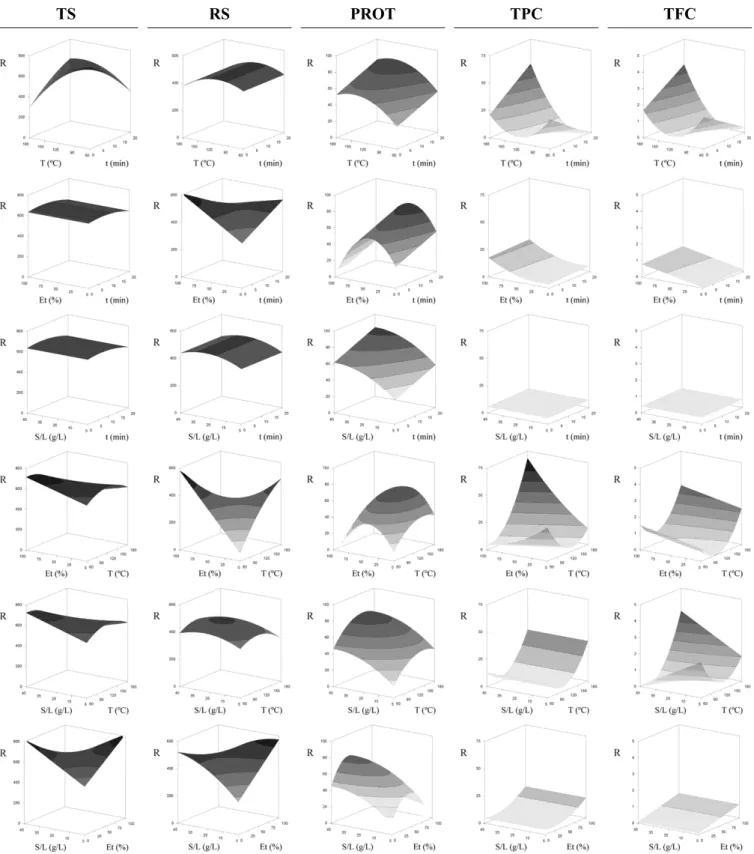
wherex1(extraction time),x2(temperature),x3(ethanol concentra-tion),x4(solid/liquid ratio),Yis the response, sub-indices indicate the analytical criteria used as responses for RSM. The Eqs. (6) to (13) trans-late the response patterns for each response showing sceneries with complex diversity. Linear, quadratic and interactive effects were found playing an important and significant role in all responses tested.
3.2.3. Detailed analysis of the obtained response patterns
The best way to visualize the effect of the independent variables on the studied responses (dependent variables) is to draw 3D response surface graphs of the model, which were done by varying two variables within the experimental range and holding the other ones constant at the centre of their experimental domain (t= 10 min,T= 120 °C,
Et= 50% andS/L= 25 g/L). The analysis of the model is presented below.
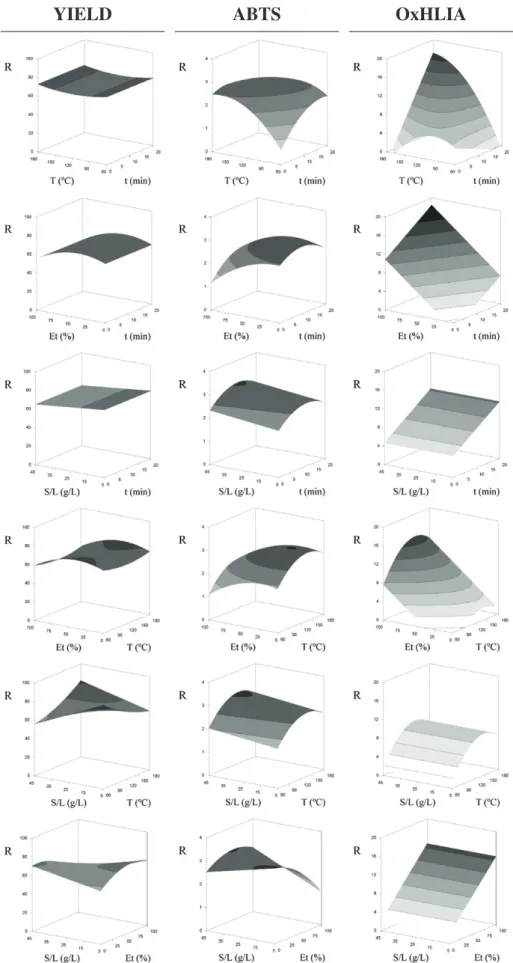
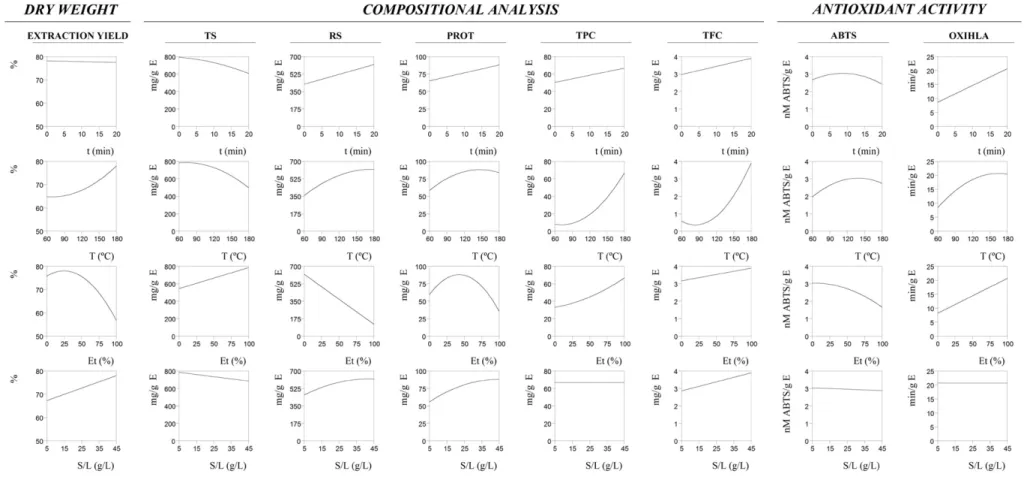
3.2.3.1. Extraction yield.The results of the extraction yield are presented inTable 1. The amount of extracted residue ranged from 52.58 to 73.51% with the experimental runs no. 22 and 5, respectively.Fig. 3shows that the increase inTandS/Lincreased the extraction yield. The interaction between these two variables (Table 2) is represented in the 3D graph ofFig. 2, where it can be seen that despite the higher extraction yield oc-curred at higherTandS/L, low ranges of these variables also induced a positive effect in the response. In turn, the increase inEtup to 24.7% in-creased the quantity of extracted residue, but the response gradually decreased at higherEt(Fig. 3). The negative interaction between this variable andS/Lis shown inFig. 3; the higher responses were obtained at highS/Land lowEtand at lowS/Land highEt. The optimal extraction conditions (t= 2 min,T= 180 °C,Et= 24.7% andS/L= 45 g/L) origi-nated a extraction yield of 78% (Table 3).
3.2.3.2. Compositional parameters.The amounts of TS, RS, PROT, TPC and TFC in the different extracts produced under the RSM experimental de-sign are presented inTable 1. The TS content ranged from 482.8 to 726.1 mg/g extract, while the quantity of reducing sugars ranged from 324.7 to 543.5 mg/g E. Curiously, these responses were affected in a con-trary way as can be seen in the 2D individual responses ofFig. 3. Longert
and higherTdecreased the TS content in a non-linear way (Table 2), but a positive interaction occurred between these variables. This interaction
is visually represented in the 3D graph ofFig. 1. In turn, the amount of RS was higher in the extracts obtained with a longertand a higherT
andS/L, but with a lowerEt. In fact, while pure ethanol was appropriated to extract total sugars, water was suitable for the recovery of RS. From the analysis ofTable 2andFig. 1, it can be concluded that the higher levels of RS were obtained when using higherEtand lowert, but an im-provement was also found when using a lowEtand a longert. Compa-rable interaction were also found among the variablesEtandT. The optimal processing conditions for TS were:t= 2 min,T= 71.9 °C,
Et = 100%, andS/L = 5 g/L, and for RS were:t = 20 min, T= 176.3 °C,Et= 0%, andS/L= 41.5 g/L (Table 3) and originated the amounts of 791.9 and 619.5 mg/g extract, respectively. The elevatedT
was preferable for obtaining extract rich in reducing sugars, since starch and sucrose can be hydrolyzed into reducing sugars (Hui, Nip, Nollet, Paliyath, & Simpson, 2007).
The PROT content ranged from 14.71 (run no. 22) to 78.15 mg/g E (run no. 12) (Table 1). In general, the increase int,TandS/Limproved the extraction performance, while an intermediateEt(42.3%) was favourable (Fig. 1andFig. 3). The response surfaces of the different var-iable combinations shown inFig. 2clearly illustrate the described trends. The effect oftwas linear, but the one of the other three variables was quadratic (Table 2). This may be due to the disruption of hydrogen bonds and migration of ions that enhance the solvent penetration into the matrix and release the intracellular solutes by disrupting the cell wall (Li et al., 2010), thus improving the PROT extraction. The de-struction of protein-lignocellulose fraction binding may also increase the extraction. However, aThigher than 146.7 °C decreased the protein yield probably due to its denaturation. Under optimal processing condi-tions (t= 20 min,T= 146.7 °C,Et= 42.3%, andS/L= 44.3 g/L;Table 3) Table 3
Optimal processing conditions in natural values that lead to optimal response values.
Optimal processing conditions Response optimum
X1: t
(min) X2: T
(°C) X3: Et
(%)
X4: S/L
(g/L)
For the extraction yield
Residue 2.0 180.0 24.7 45.0 78.0±3.4 %
For each compositional parameter
TS 2.0 71.9 100.0 5.0 791.9±30.8 mg/g E
RS 20.0 176.3 0.0 41.5 619.5±50.2 mg/g E
PROT 20.0 146.7 42.3 44.3 88.0±10.4 mg/g E
TFC 20.0 180.0 100.0 45.0 66.8±5.3 mg GAE/g E
TPC 20.0 180.0 100.0 45.0 3.89±0.6 mg CE/g E
For each antioxidant activity
ABTS 8.75 138.5 3.4 5.0 3.0±0.7 nM ABTS/g E
OxHLIA 20.0 164.2 100.0 45.0 20.6±3.7 min/g E
Intermediate conditions for extraction yield, compositional parameters and antioxidant activity
Residue 2.0 180.0 24.7 45.0 78.0±3.4 %
TS 20.0 180.0 24.1 45.0 540.2±33.7 mg/g E
RS 487.8±44.4 mg/g E
PROT 78.2±18.1 mg/g E
TFC 37.4±16.3 mg GAE/g E
TPC 3.3±1.5 mg CE/g E
ABTS 20.0 143.3 100.0 45.0 2.4±0.6 nM ABTS/g E
OxHLIA 20.2±3.5 min/g E
Global processing conditions
Residue 20.0 180.0 47.4 45.0 75.5±5.1 %
TS 480.3±41.8 mg/g E
RS 361.2±52.4 mg/g E
PROT 83.2±15.6 mg/g E
TPC 43.9±13.9 mg GAE/g E
TFC 3.5±1.3 mg CE/g E
ABTS 2.2±0.3 nM ABTS/g E
OxHLIA 13.8±2.4 min/g E
it was possible to achieve a level of 88 mg of PROT per g E. In a previous study,Roselló-Soto et al. (2015)observed that the independent variable
Etalso significantly affects the PROT recovery from olive (Olea europaea
L.) kernel samples extracted for 20 min and pretreated with high voltage electrical discharges. The PROT yield was higher when 25%Et
was used and decreased with higher percentages. The suitability of
pretreatments with high voltage electrical discharges and 5 h extrac-tions with 30%Etfor obtaining protein-rich extracts from blackberries (Rubus fruticosusL.) was also demonstrated byBarba et al. (2015).
The phenolic compounds are important hydrophilic constituents of tomato. In this study, the levels of TPC ranged from 4.98 to 38.63 mg GAE/g E and the TFC varied from 0.16 to 2.86 mg CE/g E
TS
RS
PROT
TPC
TFC
Fig. 1.Matrix combination of the response surfaces of the compositional parameter responses tested developed using Eq.(5). For representation purposes, the variables excluded in each
YIELD
ABTS
OxHLIA
Fig. 2.Matrix combination of the response surfaces of the extracted residue obtained and the antioxidant activity exhibited (tested by the ABTS and OxHLIA methods) developed using Eq.
(5). For representation purposes, the variables excluded in each 3D graph were positioned at the centre of their experimental domain (t= 10 min;T= 120 °C;Et= 50%; andS/L= 25 g/L). The obtained parametricfitting values are presented inTable 2.
Fig. 3.Individual responses of all studied parameters. The variables excluded in each 2D graph were positioned at their respective individual optimum processing conditions presented inTable 3. The obtained parametricfitting values that describe the response are presented inTable 2.
8
J.
Pi
ne
la
et
al
./
In
no
vat
iv
e
Fo
od
Sc
ie
nc
e
an
d
Em
er
gi
n
g
Te
ch
no
lo
gi
es
4
1
(2
0
17
)
16
0
–
17
(Table 1). In both cases, the highest levels were measured in the ex-tract obtained with the experimental run no. 20. In general, the stud-ied independent variables had similar effects on the extraction of TPC and TFC (Fig. 2), dependent variables that were found to be signifi -cantly correlated (Table A4). The interactive effects betweenTand
tare illustrated in the 3D graphs ofFig. 1for both cases. The response was higher at increasedTand longert, but low ranges of these vari-ables also slightly increased the obtained response. Comparable in-teractive effects betweenTandEtandTandS/Lwere also found for TPC and TFC respectively. Under optimal processing conditions (t= 20 min,T= 180 °C,Et= 100%, andS/L= 45 g/L;Table 3), amounts of 66.8 mg GAE/g E and 3.89 mg CE/g E were obtained for TPC and TFC, respectively. The significant impact of some of these in-dependent variables on the extraction of TPC and TFC was verified in other studies using innovative technologies.Barba et al. (2015) re-ported that longert(up to 5 h) promoted the recovery of TPC from blackberries pretreated with high voltage electrical discharges. Roselló-Soto et al. (2015)showed that the higherEtimproved the extraction of TPC from olive kernel. However, degradation of TPC occurred when high voltage electrical discharges at high-energy inputs were applied. HigherEtalso promoted improved responses in terms of TPC, TFC and antioxidant activity of a palm kernel by-product extract (Wong et al., 2015). It is important to note that the Folin-Ciocalteu method used to measure TPC suffers from a number of interfering substances, such as ascorbic acid, sugars and organic acids, which may overestimate the TPC response (Lester, Lewers, Medina, & Saftner, 2012). Nevertheless, the TPC detected in the tomato waste extracts was not found correlated with TS or RS (Table A4).
3.2.3.3. Antioxidant activity.The results of the antioxidant activity of the different tomato waste extracts are presented inTable 1. While the ABTS•+scavenging activity was higher when lowerEt(3.4%) andS/L
(5 g/L) were used, the OxHLIA exhibited a better performance at higher levels of these variables (Et= 100% andS/L= 45 g/L) (Fig. 3). However, the variableS/Ldid not had a significant effect on the inhibition of free radical-induced membrane damage in the sheep erythrocytes (Table 2). The higherThad a positive impact on the antioxidant properties. In-teresting to note the interactive effects between the variablestandT; the extracts submitted to a longer processingt(20 min) and a higher
T(164.2 °C) revealed increased OxHLIA responses; and the ABTS•+ scav-enging activity was detachable in extract obtained with shorter process-ingtand highT, andvice versa. In this assay there were other interactive effects, namely betweentandEtandEtandS/L. The optimum process-ing conditions (Table 3) to obtain extracts with an improved ABTS•+
scavenging activity were as follow:t= 8.75 min,T= 138.5 °C,Et= 3.4%, andS/L= 5 g/L. In turn, the processing conditions oft= 20 min,
T= 164.2 °C,Et= 100%, andS/L= 45 g/L originated extracts with a high capacity to prevent the free radical-induced membrane damage in sheep erythrocytes.
3.2.3.4. Antioxidant activity of tomato waste extracts vs. commercial anti-oxidants.Different antioxidant compounds have been used as food addi-tives to prevent oxidative deterioration processes (Carocho, Barreiro, Morales, & Ferreira, 2014). However, due to limitation on the use of syn-thetic antioxidants and enhanced public awareness of health issues, there is an increasing need to develop and use health-promoting natural antioxidant ingredients in foods (Carocho et al., 2015). In this study, the antioxidant activity of the extracts was compared to the activity of com-mercial antioxidants communally used in the food industry. Table A3 provided in Supplementary material presents the obtained parametric fitting values for the evaluated antioxidants. The synthetic antioxidants TBHQ and ETX revealed the highest oxidative haemolysis inhibition capacity (844.1 and 728.2 min/mg A, respectively). In the ABTS assay, the higher ABTS•+scavenging activity was demonstrated by the antiox-idants TBHQ and PG (0.050 and 0.097 nM ABTS/g A, respectively).
Despite the antioxidant activity of the extracts is much lower compared with the evaluated commercial antioxidants, it is important to note that these tomato waste extracts are composed of different biomolecules while the commercial antioxidants are isolated pure compounds.
3.3. Global MAE conditions that maximize all responses
Optimal MAE conditions were determined for production of tomato waste ingredients with high levels of all nutrients or with high antioxi-dant properties, as well as global MAE conditions for maximizing all evaluated responses and thus obtaining nutrient-rich antioxidant ingre-dients. Under the global optimal MAE conditions (t= 20 min,T= 180 °C,Et= 47.4% andS/L= 45 g/L), it was possible to obtain a extrac-tion yield of 75.5% and ingredients with 480.3 mg/g E of TS, 361.2 mg/g E of RS, 83.2 mg/g E of PROT, 43.9 mg GAE/g E of TPC and 3.5 mg CE/g E and a ABTS•+scavenging activity of 2.2 nM ABTS/g E and OxHLIA inhi-bition of 13.8 min/g E. Based on these optimized processing parameters it will be possible to produce food ingredients with different properties according to the intended purpose (with high levels of nutrients, in-creased antioxidant properties, or both) and thus give value to tomato fruit wastes. These results are in line with those previously reported byPinela et al. (2016b). The authors verified that the global optimum MAE conditions for obtained tomato extracts rich in the major phenolic acids (benzyl alcohol dihexose and acis p-coumaric acid derivative) and flavonoids (quercetin pentosylrutinoside and quercetin-3-O -rutinoside) and with antioxidant properties (measuredviaDPPH free-radical scavenging activity and reducing power) were based on a high processingtof 20 min,Tof 180 °C andS/Lof 45 g/L, in agreement with the results of this study. However, water was the most suitable ex-traction solvent.
4. Conclusions
The valorisation of tomato wastes for production of nutrient-rich an-tioxidant ingredients is a sustainable strategy that can contributes to a bio-economy and helps to tackle the societal challenges of this century. In fact, this study addresses modern concepts of green chemistry, name-ly the recycling of agri-food wastes and the use of more sustainable ex-traction methods. Despite the moderate capital cost of commercial microwave systems (Galanakis, Barba, & Prasad, 2015), MAE allowed obtain high extraction yields and reduce the solvent consumption. The developed MAE process was designed based on a CCCD combining dif-ferent levels oft,T,Etand S/L, which were optimized by RSM. The pro-posed model was validated based on the high values of R2adj and on the non-significant differences between experimental and predicted values. Optimal MAE conditions were calculated for each of the eight depen-dent variables, for the set of compositional parameters and antioxidant activities, as well as for all studied responses, which will allow produc-ing extracts with the desired compositional/antioxidant profiles. The antioxidant capacity of the extracts of tomato fruit waste was lower than the one of commercial antioxidants widely used in the food indus-try. However, the developed ingredients presented potential to be used in the fortification and functionalisation of food, or be incorporated in feed products.
Conflict of interest
Authors declare no conflict of interest.
Acknowledgments
The authors are grateful to the Foundation for Science and Technol-ogy (FCT) (UID/AGR/00690/2013, UID/QUI/50006/2013 - POCI/01/ 0145/FERDER/007265, UID/EQU/50020/2013) and (SFRH/BD/92994/ 2013) of Portugal and FEDER forfinancial support to CIMO (UID/AGR/ 00690/2013); to FCT/MEC forfinancial support to REQUIMTE/LAQV
(UID/QUI/50006/2013 - POCI/01/0145/FERDER/007265) and LSRE (UID/EQU/50020/2013) through national funds and co-financed by FEDER under Programme PT2020, and to QREN, ON2 and FEDER (Pro-ject NORTE-07-0162-FEDER-000050); to FCT for the PhD scholarship (SFRH/BD/92994/2013) attributed to J. Pinela, funded by the European Social Fund and MEC through Programa Operacional Capital Humano (POCH); to the Xunta de Galicia forfinancial support for the post-doc-toral researcher of M.A. Prieto; and to Araceli Menduiña Santomé for her professional work and dedication.
Appendix A. Supplementary data
Supplementary data to this article can be found online athttp://dx. doi.org/10.1016/j.ifset.2017.02.004.
References
Albuquerque, B. R., Prieto, M. A., Barreiro, M. F., Rodrigues, A., Curran, T. P., Barros, L., & Ferreira, I. C. F. R. (2017).Catechin-based extract optimization obtained fromArbutus unedoL. fruits using maceration/microwave/ultrasound extraction techniques.
Industrial Crops and Products,95, 404–415.
Barba, F. J., Galanakis, C. M., Esteve, M. J., Frigola, A., & Vorobiev, E. (2015).Potential use of pulsed electric technologies and ultrasounds to improve the recovery of high-added value compounds from blackberries.Journal of Food Engineering,
167, 38–44.
Barros, L., Carvalho, A. M., Morais, J. S., & Ferreira, I. C. F. R. (2010).Strawberry-tree, black-thorn and rose fruits: Detailed characterisation in nutrients and phytochemicals with antioxidant properties.Food Chemistry,120(1), 247–254.
Barros, L., Dueñas, M., Pinela, J., Carvalho, A. M., Buelga, C. S., & Ferreira, I. C. F. R. (2012). Characterization and quantification of phenolic compounds in four tomato (Lycopersicon esculentum L.) farmers' varieties in northeastern Portugal homegardens.Plant Foods for Human Nutrition (Dordrecht, Netherlands),67(3), 229–234.
Bernfeld, P. (1951).Enzymes of starch degradation and synthesis.Advances in Enzymology and Related Areas of Molecular Biology,12, 379–428.
Bezerra, M. A., Santelli, R. E., Oliveira, E. P., Villar, L. S., & Escaleira, E. A. (2008).Response surface methodology (RSM) as a tool for optimization in analytical chemistry.
Talanta,76, 965–977.
Box, G. E. P., & Hunter, J. S. (1957).Multi-factor experimental designs for exploring re-sponse surfaces.The Annals of Mathematical Statistics,28(1), 195–241.
Box, G., Hunter, J., & Hunter, W. (2005).Statistics for experimenters: Design, innovation and discovery(2nd ed.). Wiley.
Carocho, M., Barreiro, M. F., Morales, P., & Ferreira, I. C. F. R. (2014).Adding molecules to food, pros and cons: A review on synthetic and natural food additives.Comprehensive Reviews in Food Science and Food Safety,13(4), 377–399.
Carocho, M., Morales, P., & Ferreira, I. C. F. R. (2015).Natural food additives: Quo vadis?
Trends in Food Science & Technology,45(2), 284–295.
Comuzzi, C., Polese, P., Melchior, A., Portanova, R., & Tolazzi, M. (2003).SOLVERSTAT: A new utility for multipurpose analysis. An application to the investigation of dioxygenated Co (II) complex formation in dimethylsulfoxide solution.Talanta,
59(1), 67–80.
Deng, Q., Zinoviadou, K. G., Galanakis, C. M., Orlien, V., Grimi, N., Vorobiev, E., ... Barba, F. J. (2015).The effects of conventional and non-conventional processing on glucosino-lates and its derived forms, isothiocyanates: Extraction, degradation, and applica-tions.Food Engineering Reviews,7(3), 357–381.
Dubois, M., Gilles, K. A., Hamilton, J. K., Rebers, P. A., & Smith, F. (1956).Colorimetric method for determination of sugars and related substances.Analytical Chemistry,
28(3), 350–356.
FAO (2013).Food wastage footprint. Impacts on natural resources. Summary report. Food wastage footprint impacts on natural resources.Food and Agriculture Organization.
Galanakis, C. M. (2012).Recovery of high added-value components from food wastes: Conventional, emerging technologies and commercialized applications.Trends in Food Science & Technology,26(2), 68–87.
Galanakis, C. M. (2013).Emerging technologies for the production of nutraceuticals from agricultural by-products: A viewpoint of opportunities and challenges.Food and Bioproducts Processing,91(4), 575–579.
Galanakis, C. M., Barba, F. J., & Prasad, K. N. (2015).Cost and safety issues of emerging technologies against conventional techniques. In C. M. Galanakis (Ed.),Food waste re-covery(pp. 321–336). Academic Press.
Gieseg, S. P., & Esterbauer, H. (1994).Low density lipoprotein is saturable by pro-oxidant copper.FEBS Letters,343(3), 188–194.
Havilah, E. J., Wallis, D. M., Morris, R., & Woolnough, J. A. (1977).A microcolorimetric method for determination of ammonia in Kjeldahl digests with a manual spectropho-tometer.Laboratory Practice,26, 545–547.
Heleno, S. A., Diz, P., Prieto, M. A., Barros, L., Rodrigues, A., Barreiro, M. F., & Ferreira, I. C. F. R. (2016).Optimization of ultrasound-assisted extraction to obtain mycosterols from
Agaricus bisporusL. by response surface methodology and comparison with conven-tional Soxhlet extraction.Food Chemistry,197, 1054–1063.
Hui, Y. H., Nip, W. K., Nollet, L. M. L., Paliyath, G., & Simpson, B. K. (2007).Food biochem-istry and food processing.Blackwell Publishing.
Kemmer, G., & Keller, S. (2010).Nonlinear least-squares datafitting in Excel spreadsheets.
Nature Protocols,5(2), 267–281.
Kim, S. P., Nam, S. H., & Friedman, M. (2015).The tomato glycoalkaloidα-tomatine in-duces caspase-independent cell death in mouse colon cancer CT-26 cells and transplanted tumors in mice.Journal of Agricultural and Food Chemistry,63(4), 1142–1150.
Lester, G. E., Lewers, K. S., Medina, M. B., & Saftner, R. A. (2012).Comparative analysis of strawberry total phenolics via Fast Blue BB vs. Folin–Ciocalteu: Assay interference by ascorbic acid.Journal of Food Composition and Analysis,
27(1), 102–107.
Li, J., Zu, Y. -G., Fu, Y. -J., Yang, Y. -C., Li, S. -M., Li, Z. -N., & Wink, M. (2010). Optimi-zation of microwave-assisted extraction of triterpene saponins from defatted residue of yellow horn (Xanthoceras sorbifoliaBunge.) kernel and evaluation of its antioxidant activity.Innovative Food Science & Emerging Technologies,
11(4), 637–643.
Li, H., Deng, Z., Liu, R., Loewen, S., & Tsao, R. (2014).Bioaccessibility,in vitroantioxidant activities and in vivo anti-inflammatory activities of a purple tomato (Solanum lycopersicumL.).Food Chemistry,159, 353–360.
Murado, M. A., & Prieto, M. A. (2013).Dose-response analysis in the joint action of two effectors. A new approach to simulation, identification and modelling of some basic interactions.PLoS ONE,8(4), e61391.
Pereira, C., Barros, L., Carvalho, A. M., & Ferreira, I. C. F. R. (2011).Nutritional compo-sition and bioactive properties of commonly consumed wild greens: Potential sources for new trends in modern diets.Food Research International,44(9), 2634–2640.
Pinela, J., Barros, L., Carvalho, A. M., & Ferreira, I. C. F. R. (2012).Nutritional composition and antioxidant activity of four tomato (Lycopersicon esculentumL.) farmers' varieties in Northeastern Portugal homegardens.Food and Chemical Toxicology,50(3–4), 829–834.
Pinela, J., Prieto, M. A., Barreiro, M. F., Carvalho, A. M., Oliveira, M. B. P. P., Vázquez, J. A., & Ferreira, I. C. F. R. (2016a).Optimization of microwave-assisted extraction of hydro-philic and lipohydro-philic antioxidants from a surplus tomato crop by response surface methodology.Food and Bioproducts Processing,98, 283–298.
Pinela, J., Prieto, M. A., Carvalho, A. M., Barreiro, M. F., Oliveira, M. B. P. P., Barros, L., & Ferreira, I. C. F. R. (2016b).Microwave-assisted extraction of phenolic acids and flavonoids and production of antioxidant ingredients from tomato: A nutraceuti-cal-oriented optimization study.Separation and Purification Technology,164, 114–124.
Pinela, J., Oliveira, M. B. P. P., & Ferreira, I. C. F. R. (2016c).Bioactive compounds of toma-toes as health promoters. In L. R. da Silva, & B. Silva (Eds.),Natural bioactive com-pounds from fruits and vegetables as health promoters. 2. (pp. 48–91). Bentham Science Publishers (Chapter 3).
Prieto, M. A., & Vázquez, J. A. (2014).A time-dose model to quantify the antioxidant responses of the oxidative hemolysis inhibition assay (OxHLIA) and its extension to evaluate other hemolytic effectors.BioMed Research International,2014, 15–17.
Prieto, M. A., Vázquez, J. A., & Murado, M. A. (2014).A critical point: The problems asso-ciated with the variety of criteria to quantify the antioxidant capacity.Journal of Agricultural and Food Chemistry,62(24), 5472–5484.
Prieto, M., Curran, T., Gowen, A., & Vázquez, J. (2015).An efficient methodology for quan-tification of synergy and antagonism in single electron transfer antioxidant assays.
Food Research International,67, 284–298.
Prikler, S. (2009).Robert de Levie: Advanced Excel for scientific data analysis (2nd ed).
Analytical and Bioanalytical Chemistry,395, 1945–1964.
Ravindran, R., & Jaiswal, A. K. (2016).Exploitation of food industry waste for high-value products.Trends in Biotechnology,34(1), 58–69.
Riggi, E., & Avola, G. (2008).Fresh tomato packinghouses waste as high added-value biosource.Resources, Conservation and Recycling,53(1–2), 96–106.
Roselló-Soto, E., Barba, F. J., Parniakov, O., Galanakis, C. M., Lebovka, N., Grimi, N., & Vorobiev, E. (2015).High voltage electrical discharges, pulsed electricfield, and ultra-sound assisted extraction of protein and phenolic compounds from olive kernel.Food and Bioprocess Technology,8(4), 885–894.
Serpen, A., Capuano, E., Fogliano, V., & Gökmen, V. (2007).A new procedure to measure the antioxidant activity of insoluble food components.Journal of Agricultural and Food Chemistry,55(19), 7676–7681.
Setyaningsih, W., Saputro, I. E., Palma, M., & Barroso, C. G. (2016).Pressurized liquid ex-traction of phenolic compounds from rice (Oryza sativa) grains.Food Chemistry,
192, 452–459.
Shi, P., & Tsai, C. -L. (2002).Regression model selection: A residual likelihood approach.
Journal of the Royal Statistical Society. Series B (Statistical Methodology),64(2), 237–252.
Stajčić, S.,Ćetković, G.,Čanadanović-Brunet, J., Djilas, S., Mandić, A., &Četojević-Simin, D.
(2015).Tomato waste: Carotenoids content, antioxidant and cell growth activities.
Food Chemistry,172, 225–232.
Strati, I. F., & Oreopoulou, V. (2014).Recovery of carotenoids from tomato processing by-products–A review.Food Research International,65, 311–321.
Takebayashi, J., Kaji, H., Ichiyama, K., Makino, K., Gohda, E., Yamamoto, I., & Tai, A. (2007).Inhibition of free radical-induced erythrocyte hemolysis by 2-O-substituted ascorbic acid derivatives.Free Radical Biology and Medicine,43(8), 1156–1164.
Takebayashi, J., Iwahashi, N., Ishimi, Y., & Tai, A. (2012).Development of a simple 96-well plate method for evaluation of antioxidant activity based on the oxidative haemolysis inhibition assay (OxHLIA).Food Chemistry,134(1), 606–610.
Vilahur, G., Cubedo, J., Padró, T., Casaní, L., Mendieta, G., González, A., & Badimon, L. (2014).Intake of cooked tomato sauce preserves coronary endothelial function and
improves apolipoprotein A-I and apolipoprotein J protein profile in high-density lipo-proteins.Translational Research,44–56.
Weibull, W., & Sweden, S. (1951).A statistical distribution function of wide applicability.
Journal of Applied Mechanics,18(3), 293–297.
Wong, W. H., Lee, W. X., Ramanan, R. N., Tee, L. H., Kong, K. W., Galanakis, C. M., ... Prasad, K. N. (2015).Two level half factorial design for the extraction of phenolics,flavonoids
and antioxidants recovery from palm kernel by-product.Industrial Crops and Products,63, 238–248.
Zhang, H. -F., Yang, X. -H., & Wang, Y. (2011).Microwave assisted extraction of secondary metabolites from plants: Current status and future directions.Trends in Food Science & Technology,22(12), 672–688.